Valencia West, AZ (Arizona) Houses and Residents
| Valencia West: | $309,882 |
| Arizona: | $402,800 |
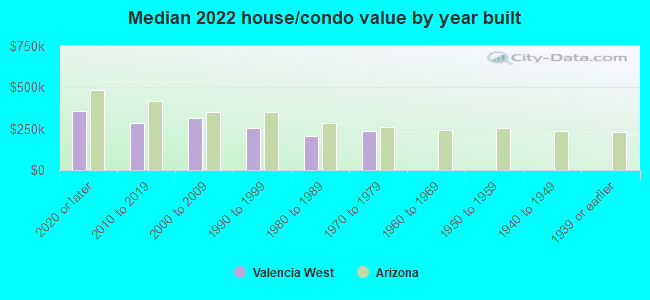
Mean price in 2022:
Detached houses: $226,444
Here: $226,444 State: $521,408 Mobile homes: $80,319
Here: $80,319 State: $141,516
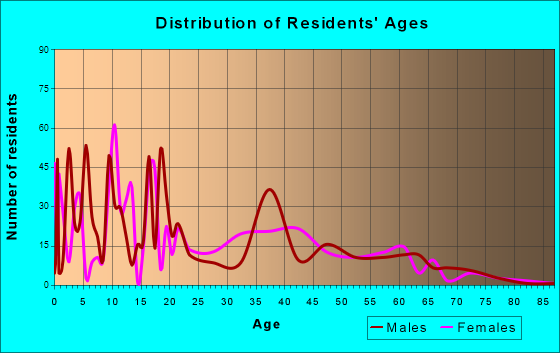
Total population: 9,355 (Urban population: 0, Rural population: 2,451 (112 farm, 2,339 nonfarm))
Houses: 4,824 (4,668 occupied: 4,360 owner occupied, 369 renter occupied)
| % of renters here: | 8% |
| State: | 33% |
Housing density: 501 houses/condos per square mile
Median price asked for vacant for-sale houses and condos in 2022: $1,226,228.
Median contract rent in 2022: $1,191 (lower quartile is $977, upper quartile is $1,383)
Median gross rent in Valencia West, AZ in 2022: $1,376
Housing units in Valencia West with a mortgage: 3,313 (312 second mortgage, 0 home equity loan, 275 both second mortgage and home equity loan)
Houses without a mortgage: 0
Median household income for houses/condos with a mortgage: $76,617
Median household income for apartments without a mortgage: $70,405
Median monthly housing costs: $1,339
Compare current foreclosures near Valencia West, AZ:
| Photo | Address | Area | Beds / Baths | Price | Details |
|---|---|---|---|---|---|

|
#1
S Cowpoke Dr
Tucson, AZ 85757
|
1,524 sq. feet
|
2 baths 3 beds |
show details | |

|
#2
N Casimir Pulaski Ave
Tucson, AZ 85741
|
1,693 sq. feet
|
2 baths 4 beds |
show details | |

|
#3
N Frannea Dr
Tucson, AZ 85712
|
1,894 sq. feet
|
2 baths 3 beds |
show details | |

|
#4
S Camino Libertad
Tucson, AZ 85746
|
1,288 sq. feet
|
2 baths 4 beds |
show details | |

|
#5
S Birch Ave
Tucson, AZ 85730
|
1,313 sq. feet
|
2 baths 3 beds |
show details | |

|
#6
N Lyra Ln
Tucson, AZ 85742
|
1,513 sq. feet
|
3 baths 3 beds |
show details | |

|
#7
W Cattail Pl
Tucson, AZ 85745
|
1,278 sq. feet
|
2 baths 3 beds |
show details | |

|
#8
E Drexel Manor Stra
Tucson, AZ 85706
|
2,072 sq. feet
|
3 baths 4 beds |
show details | |

|
#9
W Tucana St
Tucson, AZ 85745
|
4,496 sq. feet
|
3 baths 5 beds |
show details | |

|
#10
S Cherokee Ln
Tucson, AZ 85736
|
1,848 sq. feet
|
2 baths 3 beds |
show details |
| Photo | Address | Area | Beds / Baths | Price | Details |
|---|---|---|---|---|---|

|
#11
W Nebraska St
Tucson, AZ 85746
|
2,341 sq. feet
|
2 baths 4 beds |
show details | |

|
#12
E Malvern St
Tucson, AZ 85711
|
- sq. feet
|
2 baths 4 beds |
show details | |

|
#13
S Winmor Ave
Tucson, AZ 85713
|
1,699 sq. feet
|
1 baths 3 beds |
show details | |

|
#14
W District St
Tucson, AZ 85714
|
1,782 sq. feet
|
2 baths 4 beds |
show details | |

|
#15
E Silverlake Rd
Tucson, AZ 85713
|
1,765 sq. feet
|
2 baths 4 beds |
show details | |

|
#16
S Kelvin Stra
Tucson, AZ 85713
|
1,374 sq. feet
|
2 baths 3 beds |
show details | |

|
#17
E Calle Orion
Tucson, AZ 85710
|
1,654 sq. feet
|
2 baths 3 beds |
show details | |

|
#18
N Panorama View Dr
Tucson, AZ 85704
|
1,873 sq. feet
|
2 baths 4 beds |
show details | |

|
#19
W Palmdale St
Tucson, AZ 85714
|
660 sq. feet
|
2 baths 2 beds |
show details | |

|
#20
W Sago Cir
Tucson, AZ 85705
|
975 sq. feet
|
3 baths 3 beds |
show details |
| Photo | Address | Area | Beds / Baths | Price | Details |
|---|---|---|---|---|---|

|
#21
S Paseo Don Rolando
Tucson, AZ 85746
|
1,862 sq. feet
|
2 baths 4 beds |
show details | |

|
#22
N Warner Ter
Tucson, AZ 85705
|
1,369 sq. feet
|
3 baths 3 beds |
show details | |

|
#23
S Helena Stra
Tucson, AZ 85706
|
1,475 sq. feet
|
2 baths 3 beds |
show details | |

|
#24
S 8th Ave
Tucson, AZ 85756
|
1,408 sq. feet
|
2 baths 3 beds |
show details | |

|
#25
W Calle De Rosita
Tucson, AZ 85746
|
1,448 sq. feet
|
2 baths 3 beds |
show details | |

|
#26
W High Ridge Dr
Tucson, AZ 85736
|
1,248 sq. feet
|
3 baths 2 beds |
show details | |

|
#27
E Hidalgo Vis
Tucson, AZ 85713
|
1,084 sq. feet
|
1 baths 2 beds |
show details | |

|
#28
S Olsen Ave
Tucson, AZ 85713
|
945 sq. feet
|
1 baths 3 beds |
show details | |

|
#29
E Wolfhead Dr
Tucson, AZ 85730
|
1,512 sq. feet
|
2 baths 3 beds |
show details | |

|
#30
S Downing Ave
Tucson, AZ 85756
|
1,428 sq. feet
|
2 baths 3 beds |
show details |
| Photo | Address | Area | Beds / Baths | Price | Details |
|---|---|---|---|---|---|

|
#31
E Warwick Vis
Tucson, AZ 85713
|
1,326 sq. feet
|
2 baths 2 beds |
show details | |

|
#32
E Paseo Luisa
Tucson, AZ 85711
|
1,624 sq. feet
|
2 baths 3 beds |
show details | |

|
#33
S Gainsborough Rd
Tucson, AZ 85746
|
1,204 sq. feet
|
2 baths 3 beds |
show details | |

|
#34
N Bayou Dr
Tucson, AZ 85741
|
1,351 sq. feet
|
2 baths 3 beds |
show details | |

|
#35
W Old Pecos Pl
Tucson, AZ 85743
|
1,749 sq. feet
|
2 baths 3 beds |
show details | |

|
#36
E Thomas Jefferson Way
Sahuarita, AZ 85629
|
2,234 sq. feet
|
3 baths 4 beds |
show details | |

|
#37
S San Rafael Dr
Tucson, AZ 85713
|
1,471 sq. feet
|
2 baths 4 beds |
show details | |

|
#38
N Coral Bells Dr
Tucson, AZ 85745
|
2,466 sq. feet
|
3 baths 3 beds |
show details | |

|
#39
W Country Meadow Dr
Tucson, AZ 85742
|
1,292 sq. feet
|
2 baths 2 beds |
show details | |

|
#40
N Canyon Moonlight Pl
Tucson, AZ 85745
|
3,521 sq. feet
|
3 baths 4 beds |
show details |
| Photo | Address | Area | Beds / Baths | Price | Details |
|---|---|---|---|---|---|

|
#41
E 5th St
Tucson, AZ 85711
|
1,343 sq. feet
|
1 baths 2 beds |
show details | |

|
#42
W Bagley Way
Tucson, AZ 85746
|
2,838 sq. feet
|
3 baths 5 beds |
show details | |

|
#43
E Fortaleza St
Tucson, AZ 85712
|
1,390 sq. feet
|
2 baths 2 beds |
show details | |

|
#44
W Burgundy Way
Tucson, AZ 85746
|
1,670 sq. feet
|
2 baths 4 beds |
show details | |

|
#45
S Liberty Ave
Tucson, AZ 85706
|
1,083 sq. feet
|
2 baths 3 beds |
show details | |

|
#46
W Santa Luisa St
Tucson, AZ 85706
|
1,030 sq. feet
|
2 baths 3 beds |
show details | |

|
#47
S Logger Dr
Tucson, AZ 85746
|
1,413 sq. feet
|
2 baths 3 beds |
show details | |

|
#48
W Santa Luisa St
Tucson, AZ 85706
|
1,305 sq. feet
|
2 baths 3 beds |
show details | |

|
#49
S Avenida Santa Carolina
Tucson, AZ 85756
|
2,071 sq. feet
|
3 baths 4 beds |
show details | |

|
Check over 1 million property listings on Foreclosure.com!
|
browse all offers | |||


 | Tell me about the area southwest of Tucson (2 replies) |
| Overview of neighborhoods in Tucson / surrounding area? (1 reply) |
| Tucson, americas emptiest city? (25 replies) |
| An accurate view of tucson, please (25 replies) |
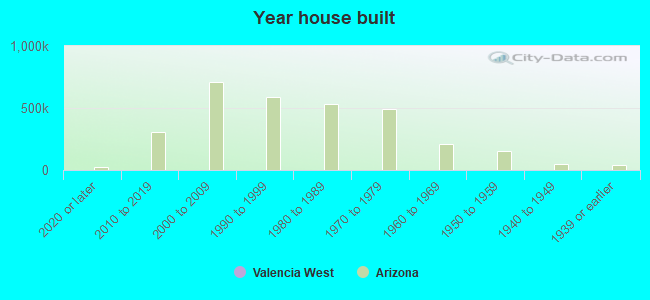
Median year apartment built: 2002
Household type by relationship:
Households: 13,891- Male householders: 2,301 (641 living alone), Female householders: 2,350 (411 living alone)
2,538 spouses (2,452 opposite-sex spouses), 260 unmarried partners, (252 opposite-sex unmarried partners), 5,207 children (4,225 natural, 633 adopted, 349 stepchildren), 266 grandchildren, 101 brothers or sisters, 253 parents, 37 foster children, 181 other relatives, 370 non-relatives
- In group quarters: 21
Size of family households: 1,202 2-persons, 569 3-persons, 882 4-persons, 325 5-persons, 303 6-persons, 70 7-or-more-persons.
Size of nonfamily households: 1,112 1-person, 58 2-persons, 108 4-persons.
2,522 married couples with children.
954 single-parent households (343 men, 611 women).
59.3% of residents of Valencia West speak English at home.
37.6% of residents speak Spanish at home (79% speak English very well, 9% speak English well, 7% speak English not well, 5% don't speak English at all).
0.1% of residents speak other Indo-European language at home (100% speak English very well).
0.6% of residents speak Asian or Pacific Island language at home (71% speak English very well, 29% speak English well).
1.1% of residents speak other language at home (100% speak English very well).
Foreign born population: 2,033 (14.6%)
(71.4% of them are naturalized citizens)
| Here: | 6.1 |
| State: | 6.0 |
| Here: | 6.1 |
| State: | 4.1 |
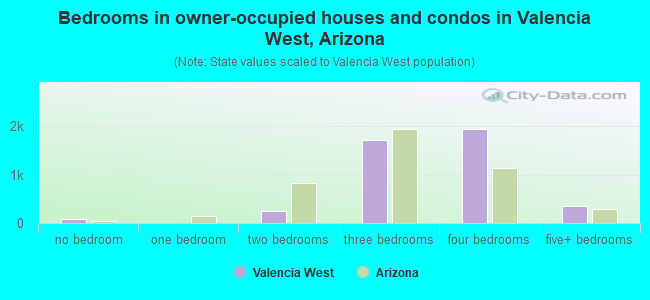
- Bedrooms in owner-occupied houses and condos in Valencia West, Arizona
- 77no bedroom
- 91 bedroom
- 2472 bedrooms
- 1,7263 bedrooms
- 1,9454 bedrooms
- 3575+ bedrooms
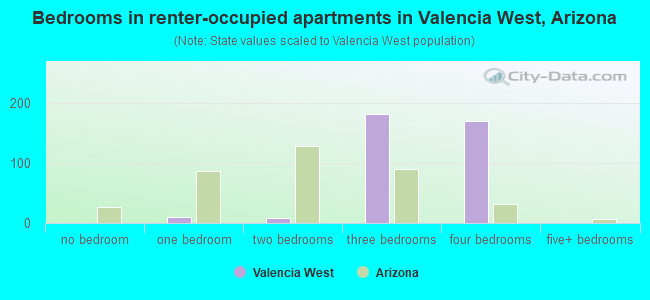
- Bedrooms in renter-occupied apartments in Valencia West, Arizona
- 0no bedroom
- 101 bedroom
- 82 bedrooms
- 1813 bedrooms
- 1704 bedrooms
- 05+ bedrooms
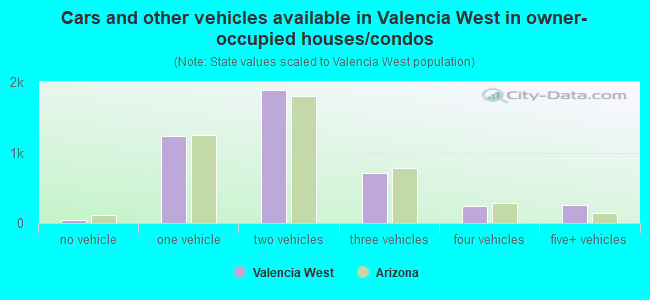
- Cars and other vehicles available in Valencia West in owner-occupied houses/condos
- 48no vehicle
- 1,2271 vehicle
- 1,8802 vehicles
- 7033 vehicles
- 2474 vehicles
- 2575+ vehicles
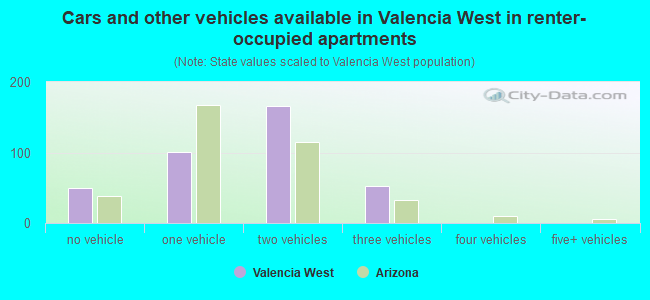
- Cars and other vehicles available in Valencia West in renter-occupied apartments
- 50no vehicle
- 1011 vehicle
- 1662 vehicles
- 533 vehicles
- 04 vehicles
- 05+ vehicles
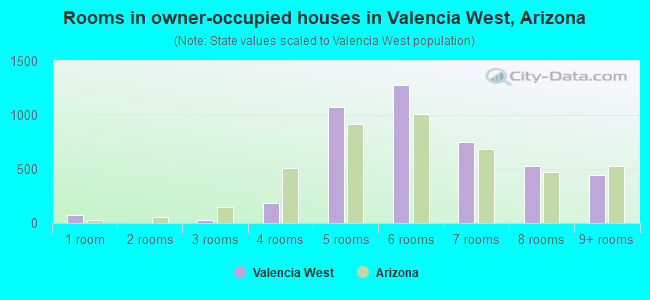
- Rooms in owner-occupied houses in Valencia West, Arizona
- 771 room
- 02 rooms
- 303 rooms
- 1844 rooms
- 1,0725 rooms
- 1,2786 rooms
- 7467 rooms
- 5308 rooms
- 4449+ rooms
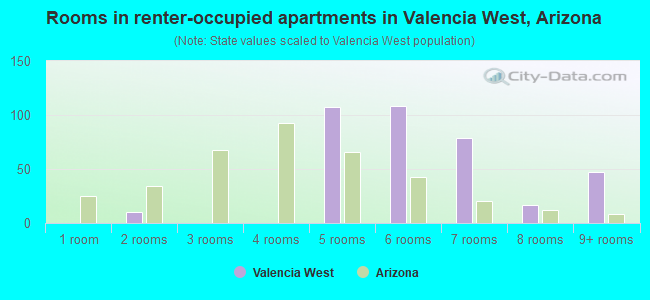
- Rooms in renter-occupied apartments in Valencia West, Arizona
- 01 room
- 102 rooms
- 03 rooms
- 04 rooms
- 1075 rooms
- 1086 rooms
- 797 rooms
- 178 rooms
- 479+ rooms
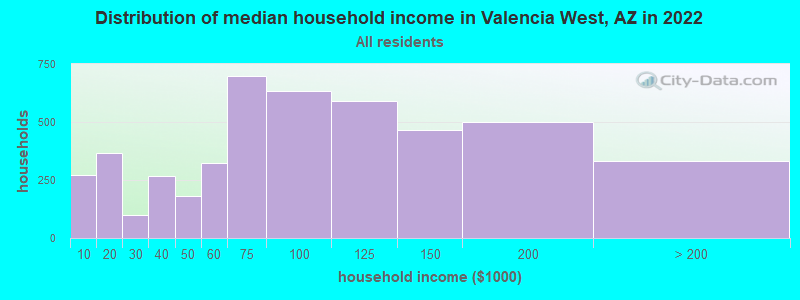
Valencia West, AZ household income distribution

- 270Less than $10,000
- 367$10,000 to $19,999
- 97$20,000 to $29,999
- 269$30,000 to $39,999
- 179$40,000 to $49,999
- 324$50,000 to $59,999
- 699$60,000 to $74,999
- 634$75,000 to $99,999
- 592$100,000 to $124,999
- 465$125,000 to $149,999
- 502$150,000 to $199,999
- 332$200,000 or more
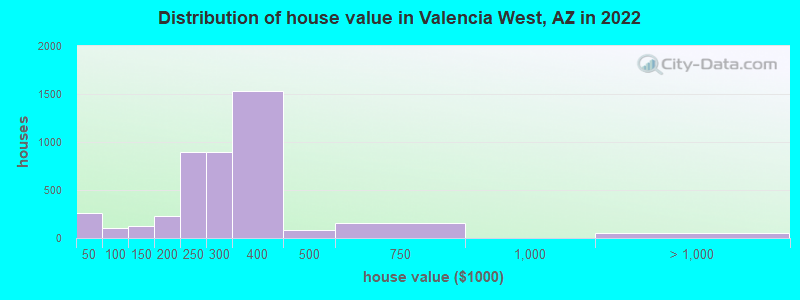
Home value of owner - occupied houses in 2022 in Valencia West, AZ
-
- 18Less than $10,000
- 11$10,000 to $14,999
- 81$15,000 to $19,999
- 85$30,000 to $34,999
- 61$35,000 to $39,999
- 47$50,000 to $59,999
- 6$70,000 to $79,999
- 33$80,000 to $89,999
- 19$90,000 to $99,999
- 85$100,000 to $124,999
- 39$125,000 to $149,999
- 111$150,000 to $174,999
- 119$175,000 to $199,999
- 900$200,000 to $249,999
- 892$250,000 to $299,999
- 1,533$300,000 to $399,999
- 79$400,000 to $499,999
- 160$500,000 to $749,999
- 53$1,000,000 to $1,499,999
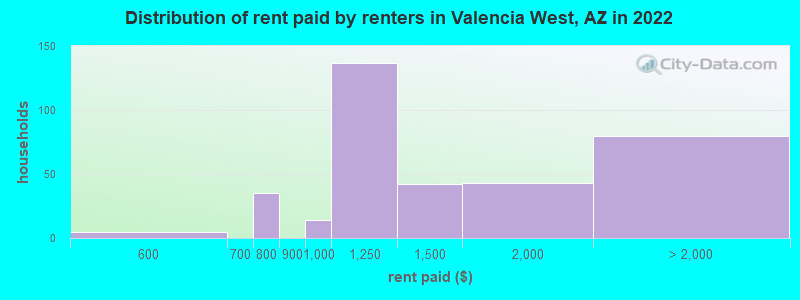
Rent paid by renters in 2022 in Valencia West, AZ
-
- 4$550 to $599
- 35$700 to $749
- 13$900 to $999
- 137$1,000 to $1,249
- 42$1,250 to $1,499
- 43$1,500 to $1,999
- 80No cash rent
Percentage of workers working in this county: 96.2%
Number of people working at home: 687 (10.7% of all workers)
Travel time to work (commute)
- Less than 5 minutes: 38
- 5 to 9 minutes: 219
- 10 to 14 minutes: 145
- 15 to 19 minutes: 374
- 20 to 24 minutes: 768
- 25 to 29 minutes: 363
- 30 to 34 minutes: 1,592
- 35 to 39 minutes: 501
- 40 to 44 minutes: 378
- 45 to 59 minutes: 918
- 60 to 89 minutes: 157
- 90 or more minutes: 234
Means of transportation to work:
- Drove a car alone: 593 (70.1%)
- Carpooled: 213 (25.2%)
- Bus or trolley bus: 3 (0.4%)
- Walked: 4 (0.5%)
- Other means: 33 (3.9%)
- Unemployment by race in 2022
- Unemployment rate for White non-Hispanic residents
- 12.0%Males
- 1.7%Females
- Unemployment rate for American Indian and Alaska Native residents
- 20.1%Females
- Unemployment rate for other race residents
- 3.4%Females
- Unemployment rate for two or more race residents
- 2.7%Males
- Unemployment rate for Hispanic or Latino residents
- 1.0%Females
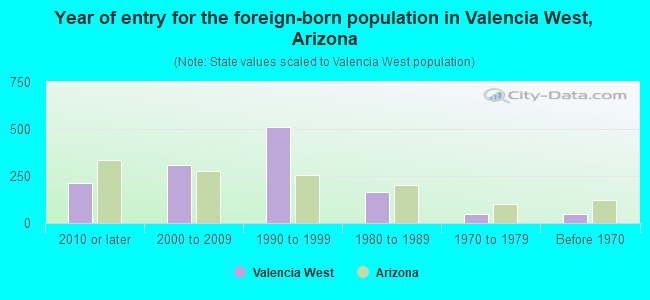
- Year of entry for the foreign-born population in Valencia West, Arizona
- 2142010 or later
- 3102000 to 2009
- 5081990 to 1999
- 1651980 to 1989
- 491970 to 1979
- 47Before 1970
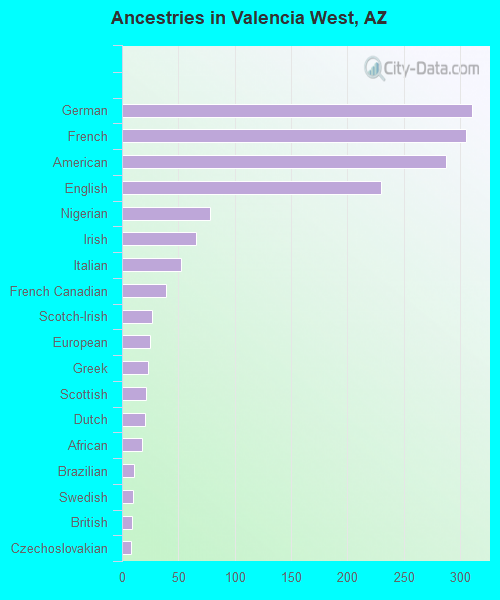
First ancestries reported:
- German: 310 (3.9%)
- French: 305 (3.8%)
- American: 287 (3.6%)
- English: 230 (2.9%)
- Nigerian: 78 (1.0%)
- Irish: 66 (0.8%)
- Italian: 52 (0.7%)
- French Canadian: 39 (0.5%)
- Scotch-Irish: 27 (0.3%)
- European: 25 (0.3%)
- Greek: 23 (0.3%)
- Scottish: 21 (0.3%)
- Dutch: 20 (0.3%)
- African: 18 (0.2%)
- Brazilian: 11 (0.1%)
- Swedish: 10 (0.1%)
- British: 9 (0.1%)
- Czechoslovakian: 8 (0.1%)
Most common places of birth for foreign-born residents (%):
| Valencia West: | 81.0% (1,726) |
| Arizona: | 53.4% (500,086) |
| Valencia West: | 5.6% (119) |
| Arizona: | 0.4% (3,330) |
| Valencia West: | 3.3% (71) |
| Arizona: | 0.1% (1,095) |
| Valencia West: | 2.0% (42) |
| Arizona: | 1.2% (10,932) |
| Valencia West: | 1.6% (35) |
| Arizona: | 4.3% (40,102) |
Place of birth for U.S.-born residents:
- This state: 7,876
- Other state: 3,738
- Northeast: 532
- Midwest: 797
- South: 812
- West: 1,620
97.0% of Valencia West residents lived in the same house 1 years ago.
Out of people who lived in different houses, 29.2% lived in this county.
Out of people who lived in different counties, 19.6% lived in Arizona.
| Valencia West: | 97.0% |
| State average: | 86.0% |
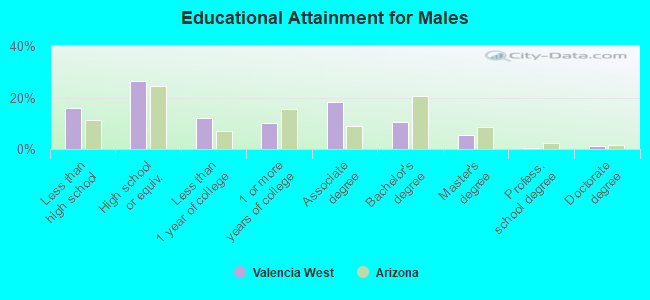
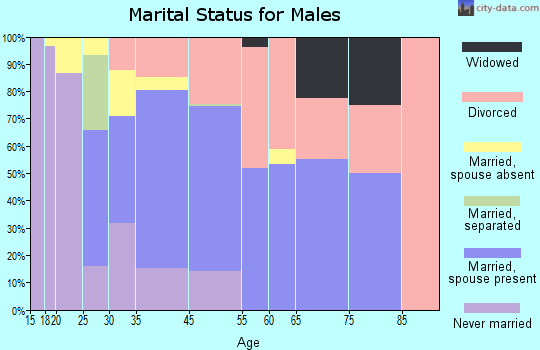
Education attainment for males 25 years and older:
- No schooling: 108
- Nursery to 4th grade: 11
- 5th and 6th grade: 66
- 7th and 8th grade: 18
- 9th grade: 79
- 10th grade: 32
- 11th grade: 140
- 12th grade, no diploma: 207
- High school graduate (or equivalency): 1,102
- Less than 1 year of college: 506
- Some college more than 1 year, no degree: 419
- Associate degree: 757
- Bachelor's degree: 432
- Master's degree: 221
- Professional school degree: 15
- Doctorate degree: 55
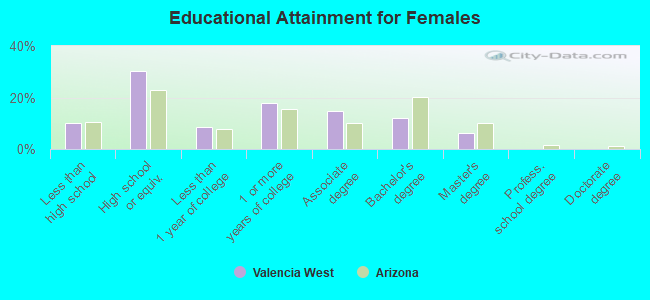
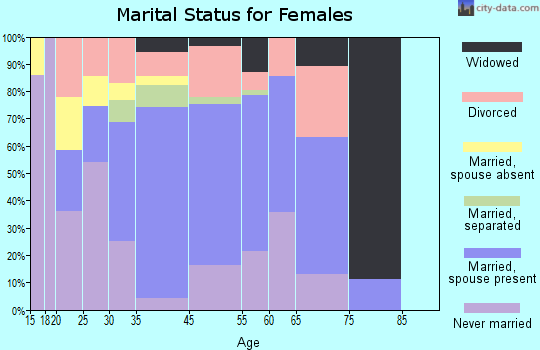
Education attainment for females 25 years and older:
- No schooling: 126
- Nursery to 4th grade: 79
- 5th and 6th grade: 37
- 7th and 8th grade: 97
- 9th grade: 0
- 10th grade: 32
- 11th grade: 17
- 12th grade, no diploma: 67
- High school graduate (or equivalency): 1,367
- Less than 1 year of college: 389
- Some college more than 1 year, no degree: 802
- Associate degree: 658
- Bachelor's degree: 549
- Master's degree: 285
- Professional school degree: 8
- Doctorate degree: 0
Housing units in structures:
- One, detached: 4,183
- One, attached: 66
- 3 or 4: 26
- 5 to 9: 15
- Mobile homes: 532
Median worth of mobile homes: $108,072
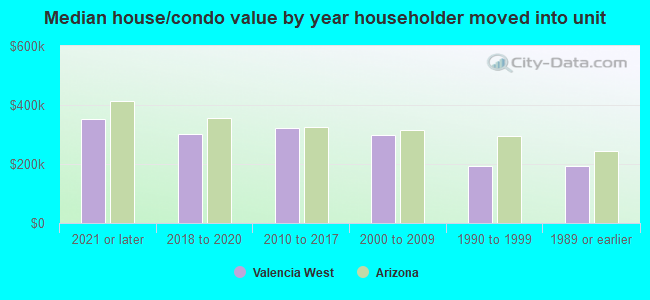
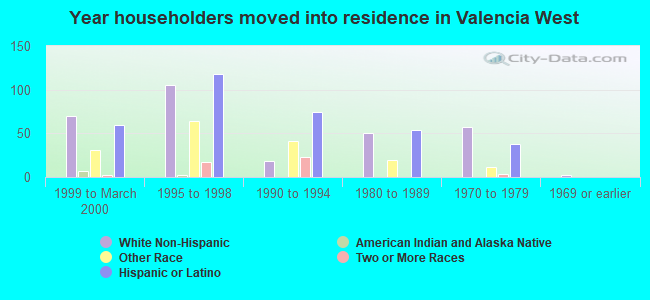
House/condo owner moved in on average 7 years ago
Renter moved in on average 6 years ago
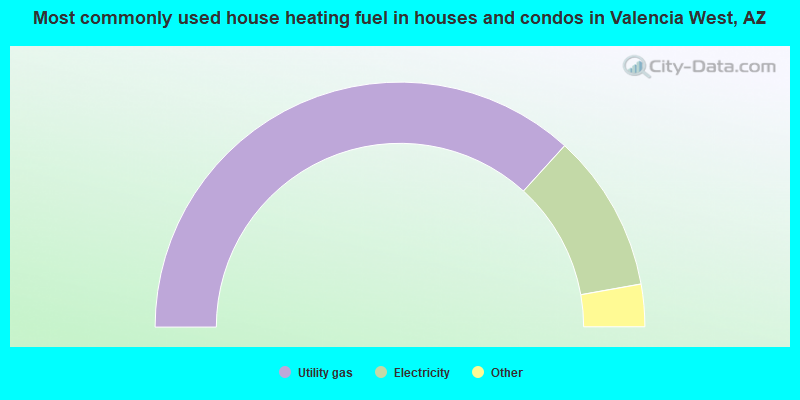
- 73.5%Utility gas
- 20.9%Electricity
- 3.2%Bottled, tank, or LP gas
- 1.3%Solar energy
- 0.6%No fuel used
- 0.5%Other fuel
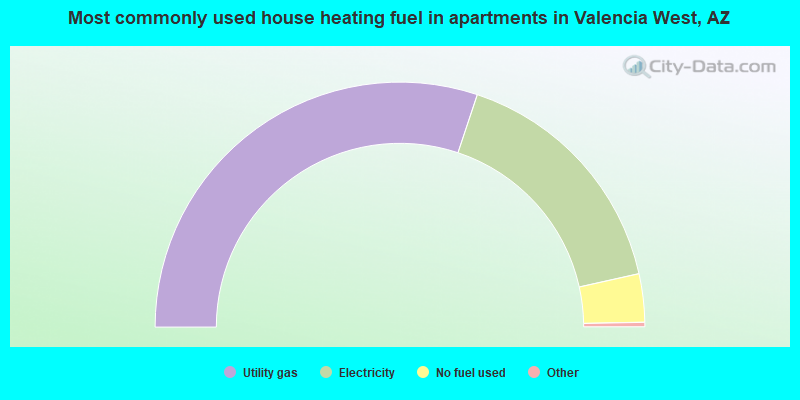
- 60.6%Utility gas
- 33.0%Electricity
- 6.4%No fuel used
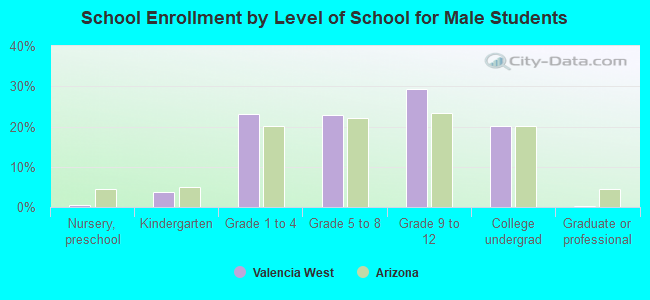
Private vs. public school enrollment:
| Here: | 6.3% |
| Arizona: | 10.4% |
| Here: | 13.8% |
| Arizona: | 8.8% |
| Here: | 11.1% |
| Arizona: | 13.1% |