Housing density: 653 houses/condos per square mile
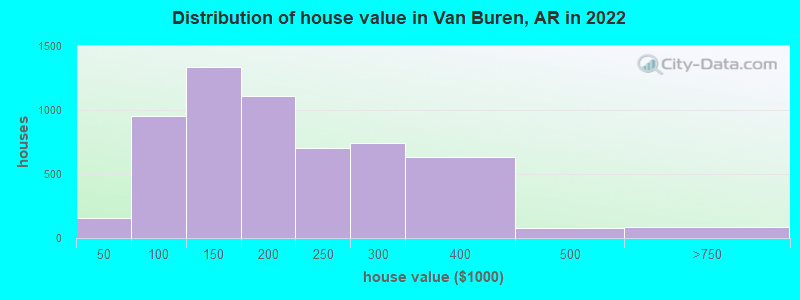
Median price asked for vacant for-sale houses and condos in 2022: $121,045.
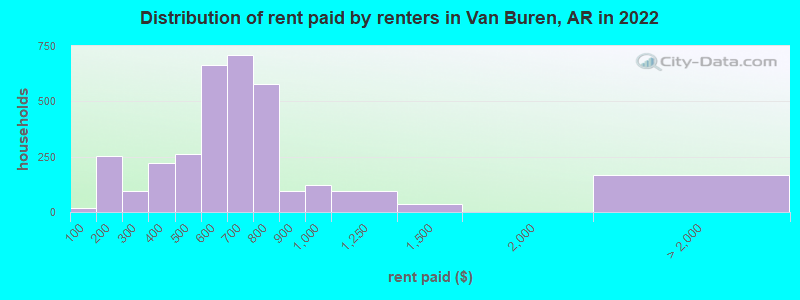
Median contract rent in 2022: $603 (lower quartile is $484, upper quartile is $725)
Median rent asked for vacant for-rent units in 2022: $782
Median gross rent in Van Buren, AR in 2022: $773
Housing units in Van Buren with a mortgage: 3,410 (135 second mortgage, 0 home equity loan, 120 both second mortgage and home equity loan) Houses without a mortgage: 47
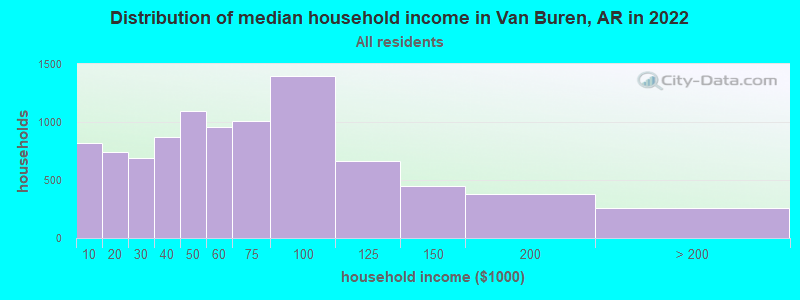
Median household income for houses/condos with a mortgage: $76,057
Median household income for apartments without a mortgage: $60,311
Size of family households: 2,932 2-persons, 1,492 3-persons, 1,026 4-persons, 552 5-persons, 279 6-persons, 127 7-or-more-persons.
Size of nonfamily households: 2,413 1-person, 377 2-persons, 28 3-persons.
3,049 married couples with children.
1,484 single-parent households (504 men, 980 women).
84.7% of residents of Van Buren speak English at home.
13.2% of residents speak Spanish at home (69% speak English very well, 13% speak English well, 10% speak English not well, 8% don't speak English at all).
0.9% of residents speak other Indo-European language at home (94% speak English very well, 6% speak English well).
1.7% of residents speak Asian or Pacific Island language at home (41% speak English very well, 30% speak English well, 22% speak English not well, 8% don't speak English at all).
0.2% of residents speak other language at home (100% speak English very well).
Foreign born population: 1,962 (8.3%)
(54.3% of them are naturalized citizens)
Percentage of workers working in this county: 46.6% Number of people working at home: 411 (4.2% of all workers)
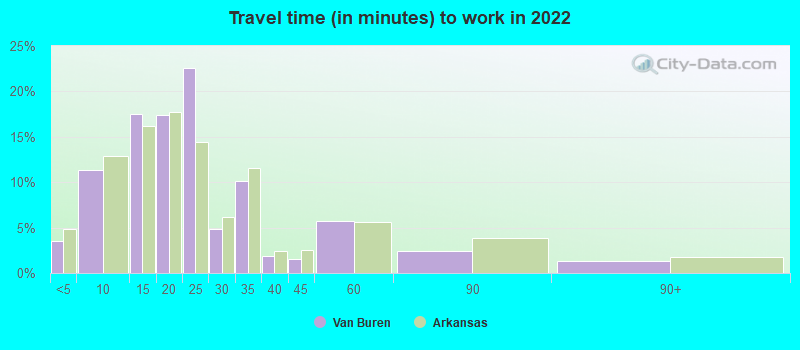
Travel time to work (commute)
Less than 5 minutes: 358
5 to 9 minutes: 1,161
10 to 14 minutes: 1,596
15 to 19 minutes: 1,671
20 to 24 minutes: 2,029
25 to 29 minutes: 919
30 to 34 minutes: 873
35 to 39 minutes: 99
40 to 44 minutes: 71
45 to 59 minutes: 96
60 to 89 minutes: 276
90 or more minutes: 78
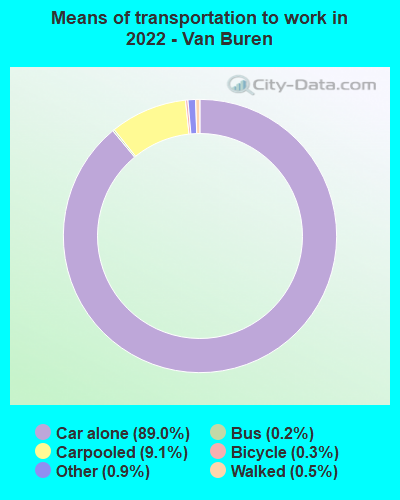
Means of transportation to work:
Drove a car alone: 9,148 (85.5%)
Carpooled: 816 (7.6%)
Bus: 22 (0.2%)
Taxi: 98 (0.9%)
Bicycle: 23 (0.2%)
Walked: 53 (0.5%)
Worked at home: 411 (3.8%)
Unemployment by race in 2022
Unemployment rate for White non-Hispanic residents
7.4%Males
6.8%Females
Unemployment rate for Black residents
21.8%Males
Unemployment rate for other race residents
6.2%Males
5.6%Females
Unemployment rate for two or more race residents
17.6%Males
Unemployment rate for Hispanic or Latino residents
10.2%Males
1.5%Females
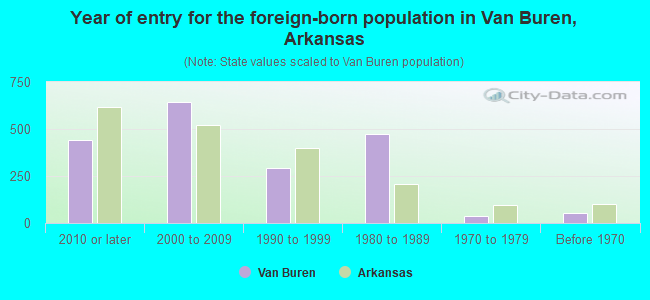
Year of entry for the foreign-born population in Van Buren, Arkansas
4432010 or later
6432000 to 2009
2911990 to 1999
4711980 to 1989
391970 to 1979
51Before 1970
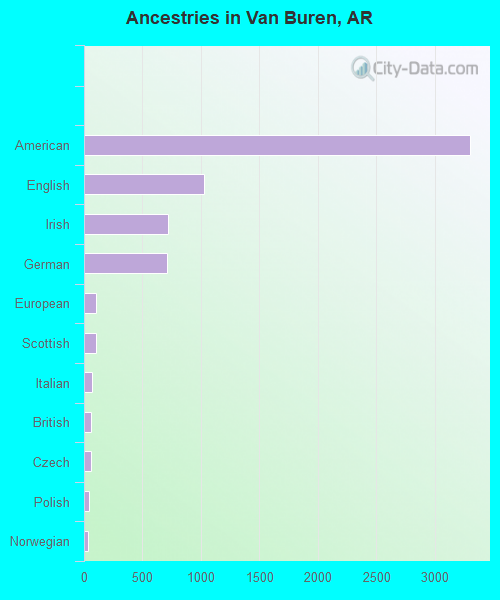
First ancestries reported:
American: 3,299 (29.5%)
English: 1,027 (9.2%)
Irish: 718 (6.4%)
German: 708 (6.3%)
European: 106 (0.9%)
Scottish: 106 (0.9%)
Italian: 66 (0.6%)
British: 59 (0.5%)
Czech: 59 (0.5%)
Polish: 42 (0.4%)
Norwegian: 31 (0.3%)
Dutch: 27 (0.2%)
French: 27 (0.2%)
Welsh: 26 (0.2%)
French Canadian: 23 (0.2%)
Scotch-Irish: 23 (0.2%)
Armenian: 17 (0.2%)
Belgian: 10 (0.09%)
Eastern European: 9 (0.08%)
Portuguese: 9 (0.08%)
Albanian: 8 (0.07%)
Jordanian: 7 (0.06%)
Swedish: 6 (0.05%)
Ukrainian: 3 (0.03%)
Most common places of birth for foreign-born residents (%):
El Salvador
Van Buren:
42.2% (822)
Arkansas:
10.7% (16,210)
Mexico
Van Buren:
16.4% (320)
Arkansas:
40.2% (61,075)
Laos
Van Buren:
9.7% (189)
Arkansas:
2.2% (3,381)
Guatemala
Van Buren:
8.0% (156)
Arkansas:
3.5% (5,376)
Germany
Van Buren:
3.6% (70)
Arkansas:
1.8% (2,721)
Vietnam
Van Buren:
3.4% (66)
Arkansas:
2.7% (4,028)
Kuwait
Van Buren:
3.0% (58)
Arkansas:
0.1% (133)
Peru
Van Buren:
2.9% (56)
Arkansas:
0.3% (486)
Honduras
Van Buren:
2.1% (41)
Arkansas:
1.1% (1,606)
United Kingdom, excluding England and Scotland
Van Buren:
2.1% (40)
Arkansas:
0.8% (1,283)
Philippines
Van Buren:
1.8% (36)
Arkansas:
2.7% (4,128)
Pakistan
Van Buren:
1.6% (31)
Arkansas:
0.8% (1,236)
Place of birth for U.S.-born residents:
This state: 13,853
Other state: 7,606
Northeast: 548
Midwest: 1,529
South: 3,064
West: 2,520
85.3% of Van Buren residents lived in the same house 1 years ago. Out of people who lived in different houses, 33.9% lived in this county. Out of people who lived in different counties, 65.8% lived in Arkansas.
Van Buren:
85.3%
State average:
87.0%
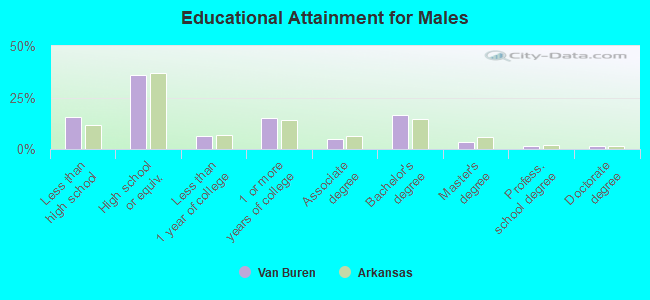
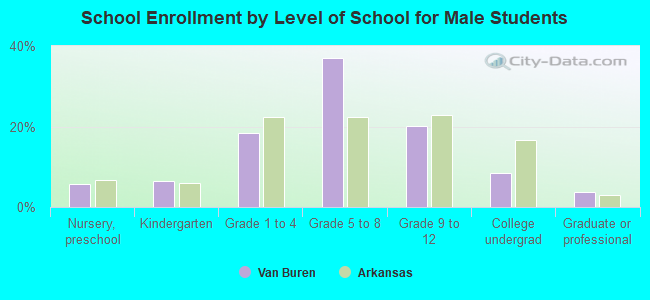
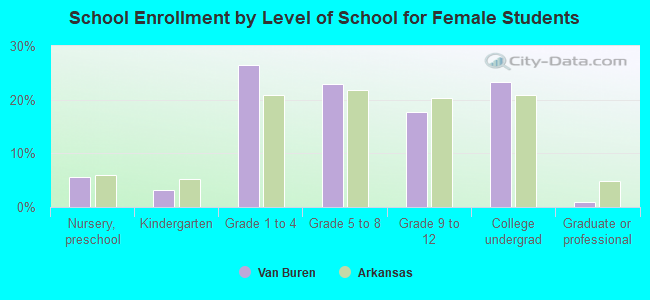
Education attainment for males 25 years and older:
No schooling: 191
Nursery to 4th grade: 43
5th and 6th grade: 42
7th and 8th grade: 155
9th grade: 193
10th grade: 132
11th grade: 141
12th grade, no diploma: 311
High school graduate (or equivalency): 2,800
Less than 1 year of college: 493
Some college more than 1 year, no degree: 1,162
Associate degree: 372
Bachelor's degree: 1,272
Master's degree: 278
Professional school degree: 111
Doctorate degree: 118
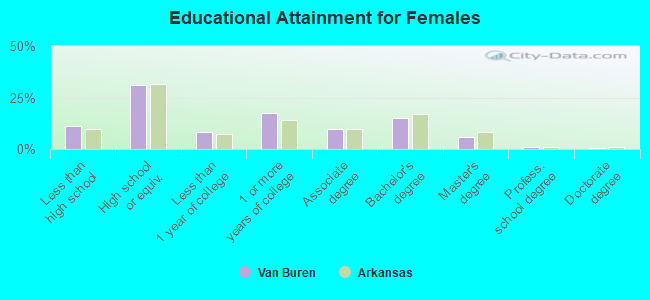
Education attainment for females 25 years and older:
No schooling: 89
Nursery to 4th grade: 58
5th and 6th grade: 11
7th and 8th grade: 139
9th grade: 111
10th grade: 235
11th grade: 147
12th grade, no diploma: 141
High school graduate (or equivalency): 2,618
Less than 1 year of college: 696
Some college more than 1 year, no degree: 1,497
Associate degree: 840
Bachelor's degree: 1,281
Master's degree: 501
Professional school degree: 77
Doctorate degree: 36
Housing units in structures:
One, detached: 7,482
One, attached: 182
Two: 771
3 or 4: 315
5 to 9: 309
10 to 19: 401
20 to 49: 123
50 or more: 134
Mobile homes: 118
Housing units lacking complete plumbing facilities in 2022: 1.4%
Housing units lacking complete kitchen facilities in 2022: 2.9%
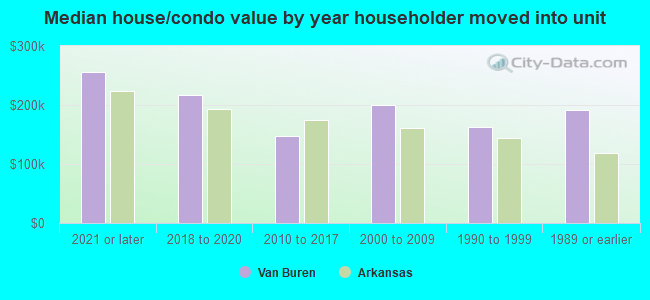
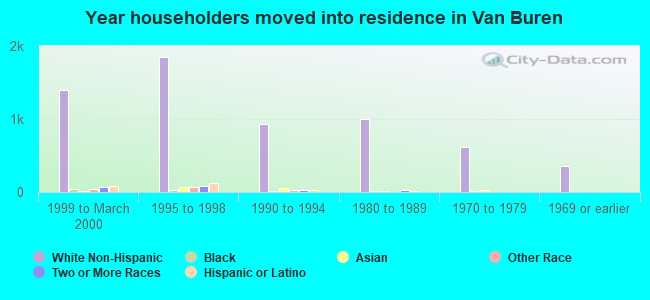
House/condo owner moved in on average 10 years ago