Van Buren, OH (Ohio) Houses and Residents
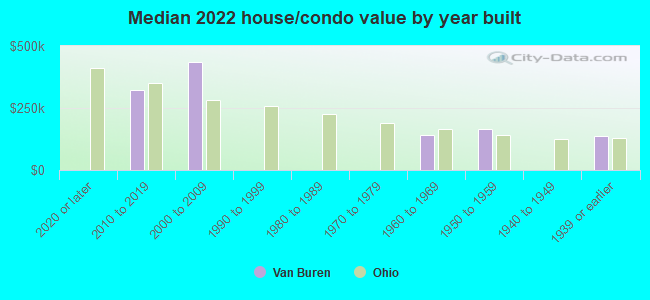
| Van Buren: | $166,203 |
| Ohio: | $204,100 |
Mean price in 2022:
Detached houses: $173,796
Here: $173,796 State: $254,366
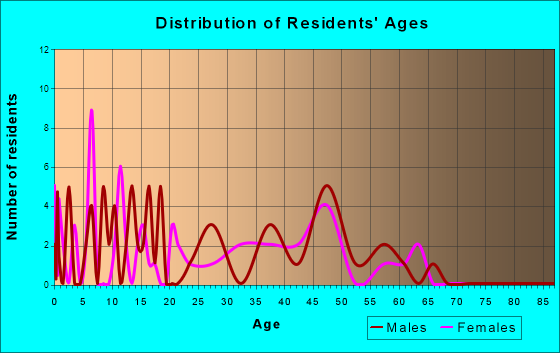
Total population: 363 (Urban population: 264 (all inside urban clusters), Rural population: 34 (all nonfarm))
Houses: 186 (186 occupied: 182 owner occupied, 7 renter occupied)
| % of renters here: | 4% |
| State: | 33% |
Housing density: 747 houses/condos per square mile
Median price asked for vacant for-sale houses and condos in 2022 in this county: $118,128.
Housing units in Van Buren with a mortgage: 130 (6 second mortgage, 0 home equity loan, 5 both second mortgage and home equity loan)
Houses without a mortgage: 0
Median household income for houses/condos with a mortgage: $88,513
Median household income for apartments without a mortgage: $102,267
Median monthly housing costs: $985
Compare current foreclosures near Van Buren, OH:
| Photo | Address | Area | Beds / Baths | Price | Details |
|---|---|---|---|---|---|

|
#1
Freyman Rd
Cygnet, OH 43413
|
2,046 sq. feet
|
2 baths 3 beds |
show details | |

|
#2
E Eagle St
Fostoria, OH 44830
|
1,380 sq. feet
|
1 baths 2 beds |
show details | |

|
#3
Main St
West Millgrove, OH 43467
|
- sq. feet
|
1 baths 3 beds |
show details | |

|
#4
Birch Ct
Findlay, OH 45840
|
1,300 sq. feet
|
1 baths 3 beds |
show details | |

|
#5
W Lytle St
Fostoria, OH 44830
|
1,856 sq. feet
|
1 baths 2 beds |
show details | |

|
#6
Rhodes Ave
North Baltimore, OH 45872
|
1,048 sq. feet
|
1 baths 2 beds |
show details | |

|
#7
W State Route 12
Fostoria, OH 44830
|
1,756 sq. feet
|
2 baths 2 beds |
show details | |

|
#8
Parkside Pl
Findlay, OH 45840
|
1,805 sq. feet
|
2 baths 2 beds |
show details | |

|
#9
Leonard St
Fostoria, OH 44830
|
1,218 sq. feet
|
1 baths 3 beds |
show details | |

|
#10
Hurd Ave
Findlay, OH 45840
|
1,131 sq. feet
|
1 baths 2 beds |
show details |
| Photo | Address | Area | Beds / Baths | Price | Details |
|---|---|---|---|---|---|

|
#11
Washington St
Findlay, OH 45840
|
1,616 sq. feet
|
1 baths 3 beds |
show details | |

|
#12
Center St
Findlay, OH 45840
|
1,699 sq. feet
|
1 baths 4 beds |
show details | |

|
#13
Rosewood Dr
Bowling Green, OH 43402
|
1,437 sq. feet
|
2 baths 3 beds |
show details | |

|
#14
Eastowne Park Row
Findlay, OH 45840
|
2,289 sq. feet
|
1 baths 3 beds |
show details | |

|
#15
Greendale Ave
Findlay, OH 45840
|
2,677 sq. feet
|
2 baths 5 beds |
show details | |

|
#16
Needles Rd
Custar, OH 43511
|
1,954 sq. feet
|
1 baths 3 beds |
show details | |

|
#17
Columbus Ave
Fostoria, OH 44830
|
720 sq. feet
|
1 baths 2 beds |
show details | |

|
#18
Columbus Ave
Fostoria, OH 44830
|
1,820 sq. feet
|
1 baths 3 beds |
show details | |

|
#19
W Township Road 112
Fostoria, OH 44830
|
2,232 sq. feet
|
1 baths 1 beds |
show details | |

|
#20
Clinton St
Findlay, OH 45840
|
1,092 sq. feet
|
1 baths 2 beds |
show details |
| Photo | Address | Area | Beds / Baths | Price | Details |
|---|---|---|---|---|---|

|
#21
5th Ave
Fostoria, OH 44830
|
972 sq. feet
|
1 baths 3 beds |
show details | |

|
#22
Shinkle St
Findlay, OH 45840
|
1,118 sq. feet
|
1 baths 3 beds |
show details | |

|
#23
W Jackson St
Fostoria, OH 44830
|
1,484 sq. feet
|
1 baths 2 beds |
show details | |

|
#24
N Union St
Fostoria, OH 44830
|
1,740 sq. feet
|
1 baths 3 beds |
show details | |

|
#25
Stadium Dr
Findlay, OH 45840
|
1,204 sq. feet
|
1 baths 3 beds |
show details | |

|
#26
Bays Rd
Cygnet, OH 43413
|
2,137 sq. feet
|
2 baths 4 beds |
show details | |

|
#27
State Route 37
Findlay, OH 45840
|
1,446 sq. feet
|
1 baths 3 beds |
show details | |

|
#28
Portage Dr
Fostoria, OH 44830
|
1,272 sq. feet
|
1 baths 3 beds |
show details | |

|
#29
Berkshire Dr
Fostoria, OH 44830
|
1,056 sq. feet
|
1 baths 3 beds |
show details | |

|
#30
Logan Ave
Findlay, OH 45840
|
960 sq. feet
|
1 baths 3 beds |
show details |
| Photo | Address | Area | Beds / Baths | Price | Details |
|---|---|---|---|---|---|

|
#31
Graceland Ave
Findlay, OH 45840
|
1,632 sq. feet
|
1 baths 3 beds |
show details | |

|
#32
Kennedy Ln
Fostoria, OH 44830
|
2,128 sq. feet
|
2 baths 4 beds |
show details | |

|
#33
Leonard Street And 0 Leona
Fostoria, OH 44830
|
1,218 sq. feet
|
1 baths 3 beds |
show details | |

|
#34
Summit St
Findlay, OH 45840
|
588 sq. feet
|
1 baths 2 beds |
show details | |

|
#35
W North St
Fostoria, OH 44830
|
1,864 sq. feet
|
1 baths 4 beds |
show details | |

|
#36
S West St
Findlay, OH 45840
|
1,632 sq. feet
|
2 baths 3 beds |
show details | |

|
#37
N Union St
Fostoria, OH 44830
|
3,370 sq. feet
|
3 baths 5 beds |
show details | |

|
#38
Willowick Dr
Findlay, OH 45840
|
3,208 sq. feet
|
3 baths 3 beds |
show details | |

|
#39
S Stearns Ave
Deshler, OH 43516
|
1,596 sq. feet
|
1 baths 3 beds |
show details | |

|
#40
Hawthorne Rd
Fostoria, OH 44830
|
3,529 sq. feet
|
3 baths 5 beds |
show details |
| Photo | Address | Area | Beds / Baths | Price | Details |
|---|---|---|---|---|---|

|
#41
Franklin Ave
Findlay, OH 45840
|
1,324 sq. feet
|
1 baths 2 beds |
show details | |

|
#42
Tank Farm Rd
Cygnet, OH 43413
|
1,904 sq. feet
|
1 baths 4 beds |
show details | |

|
#43
Fostoria Ave
Findlay, OH 45840
|
2,527 sq. feet
|
2 baths 5 beds |
show details | |

|
#44
Hillshafer Dr
Findlay, OH 45840
|
1,625 sq. feet
|
1 baths 3 beds |
show details | |

|
#45
Township Highway 95
Carey, OH 43316
|
2,184 sq. feet
|
1 baths 3 beds |
show details | |

|
#46
Westmoor Rd
Findlay, OH 45840
|
2,516 sq. feet
|
2 baths 4 beds |
show details | |

|
#47
Northview St
Findlay, OH 45840
|
1,848 sq. feet
|
1 baths 3 beds |
show details | |

|
#48
Sheffield Dr
Findlay, OH 45840
|
2,016 sq. feet
|
2 baths 3 beds |
show details | |

|
#49
Capital Ln
Findlay, OH 45840
|
1,493 sq. feet
|
2 baths 4 beds |
show details | |

|
Check over 1 million property listings on Foreclosure.com!
|
browse all offers | |||


 | Most beautiful neighborhoods (4 replies) |
| what's the average utility bill in kettering apartments (3 replies) |
| Your experience with relocation to Findlay? (5 replies) |
| Dayton Development Thread (1673 replies) |
| A thought on the "city" versus the "suburbs" of Dayton (54 replies) |
| Columbus City and Suburban Development News (2793 replies) |
Household type by relationship:
Households: 579- Male householders: 113 (5 living alone), Female householders: 70 (11 living alone)
102 spouses (102 opposite-sex spouses), 14 unmarried partners, (14 opposite-sex unmarried partners), 222 children (218 natural, 0 adopted, 3 stepchildren), 5 grandchildren, 5 brothers or sisters, 0 parents, 0 foster children, 39 other relatives, 2 non-relatives
Size of family households: 56 2-persons, 18 3-persons, 79 4-persons, 8 5-persons, 3 6-persons.
Size of nonfamily households: 15 1-person, 8 2-persons.
129 married couples with children.
51 single-parent households (6 men, 45 women).
96.6% of residents of Van Buren speak English at home.
2.5% of residents speak Spanish at home (100% speak English very well).
| Here: | 7.7 |
| State: | 6.7 |
| Here: | -725925925.2 |
| State: | 4.4 |
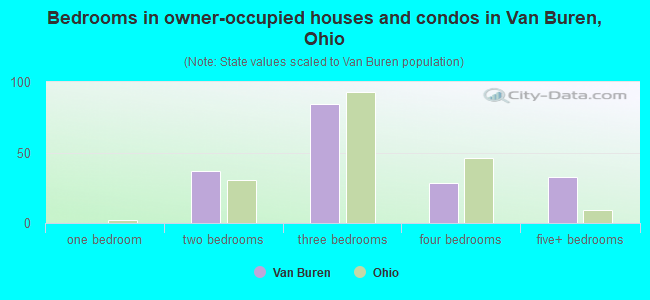
- Bedrooms in owner-occupied houses and condos in Van Buren, Ohio
- 0no bedroom
- 01 bedroom
- 372 bedrooms
- 843 bedrooms
- 294 bedrooms
- 335+ bedrooms
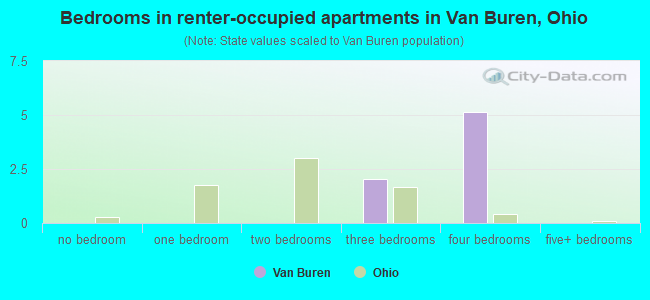
- Bedrooms in renter-occupied apartments in Van Buren, Ohio
- 0no bedroom
- 01 bedroom
- 02 bedrooms
- 23 bedrooms
- 54 bedrooms
- 05+ bedrooms
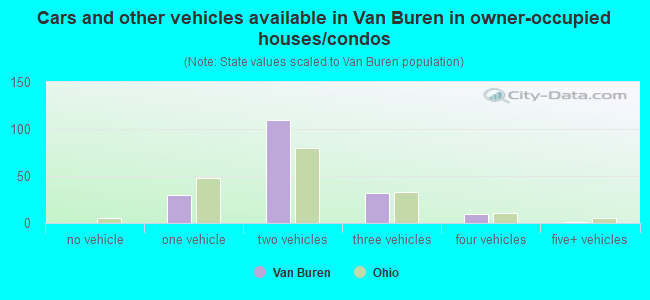
- Cars and other vehicles available in Van Buren in owner-occupied houses/condos
- 0no vehicle
- 301 vehicle
- 1102 vehicles
- 323 vehicles
- 104 vehicles
- 15+ vehicles
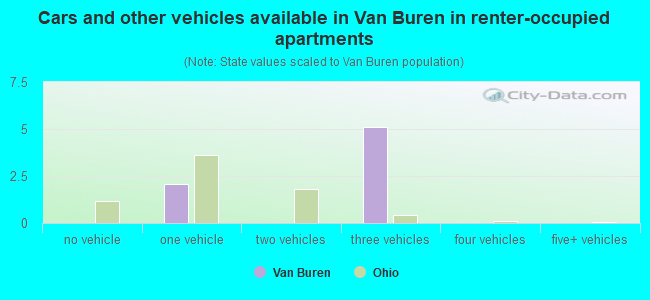
- Cars and other vehicles available in Van Buren in renter-occupied apartments
- 0no vehicle
- 21 vehicle
- 02 vehicles
- 53 vehicles
- 04 vehicles
- 05+ vehicles
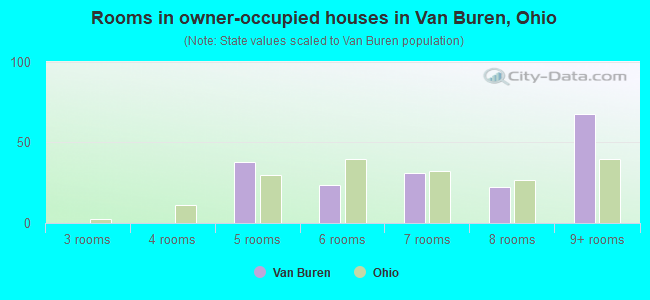
- Rooms in owner-occupied houses in Van Buren, Ohio
- 01 room
- 02 rooms
- 03 rooms
- 04 rooms
- 385 rooms
- 246 rooms
- 317 rooms
- 238 rooms
- 689+ rooms
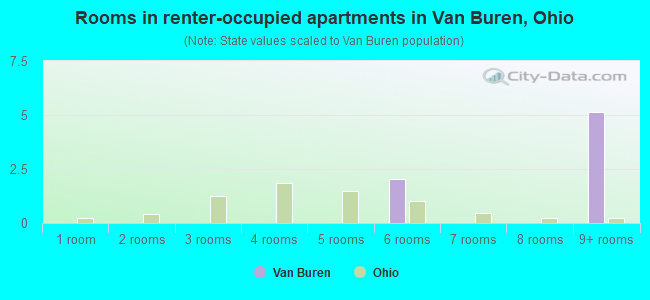
- Rooms in renter-occupied apartments in Van Buren, Ohio
- 01 room
- 02 rooms
- 03 rooms
- 04 rooms
- 05 rooms
- 26 rooms
- 07 rooms
- 08 rooms
- 59+ rooms
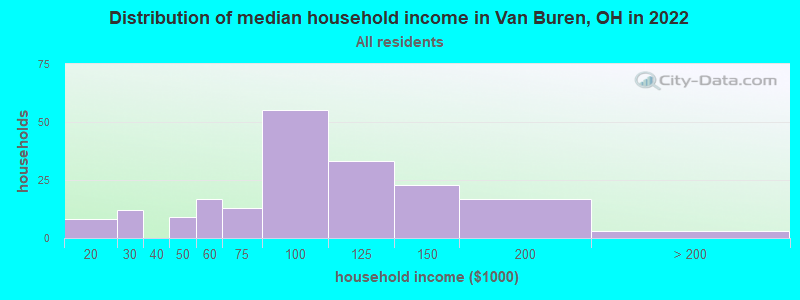
Van Buren, OH household income distribution

- 8$10,000 to $19,999
- 12$20,000 to $29,999
- 9$40,000 to $49,999
- 17$50,000 to $59,999
- 13$60,000 to $74,999
- 55$75,000 to $99,999
- 33$100,000 to $124,999
- 23$125,000 to $149,999
- 17$150,000 to $199,999
- 3$200,000 or more
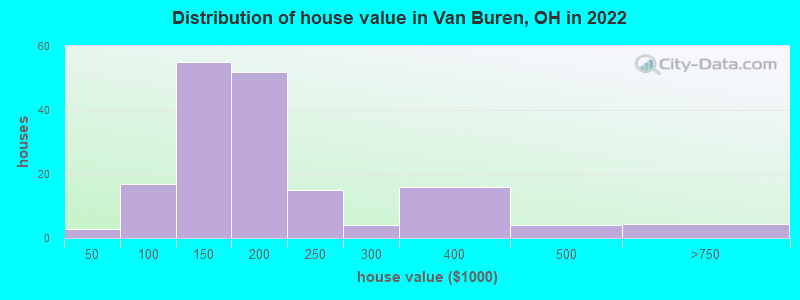
Home value of owner - occupied houses in 2022 in Van Buren, OH
-
- 2$10,000 to $14,999
- 8$80,000 to $89,999
- 8$90,000 to $99,999
- 43$100,000 to $124,999
- 11$125,000 to $149,999
- 18$150,000 to $174,999
- 33$175,000 to $199,999
- 15$200,000 to $249,999
- 4$250,000 to $299,999
- 15$300,000 to $399,999
- 3$400,000 to $499,999
- 4$500,000 to $749,999
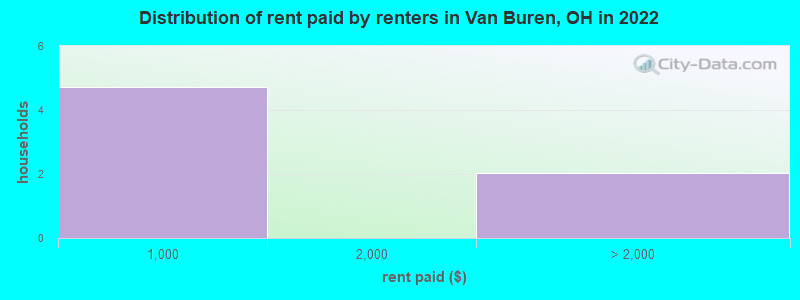
Rent paid by renters in 2022 in Van Buren, OH
-
- 4$900 to $999
- 2No cash rent
Percentage of workers working in this county: 89.9%
Number of people working at home: 18 (6.0% of all workers)
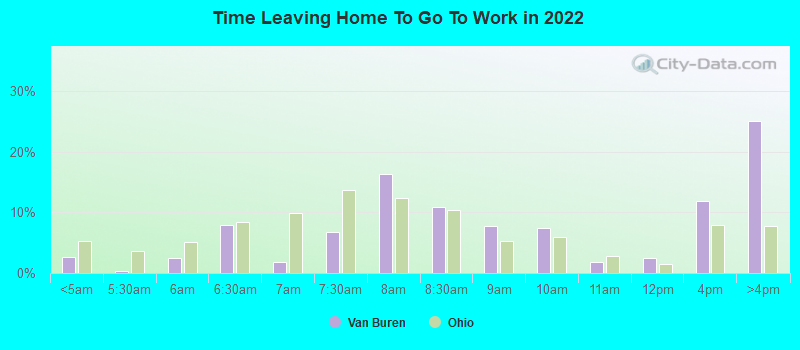
Travel time to work (commute)
- Less than 5 minutes: 16
- 5 to 9 minutes: 46
- 10 to 14 minutes: 110
- 15 to 19 minutes: 59
- 20 to 24 minutes: 46
- 25 to 29 minutes: 0
- 30 to 34 minutes: 3
- 35 to 39 minutes: 8
- 40 to 44 minutes: 0
- 45 to 59 minutes: 0
- 60 to 89 minutes: 7
- 90 or more minutes: 0
Means of transportation to work:
- Drove a car alone: 139 (86.9%)
- Carpooled: 13 (8.1%)
- Walked: 2 (1.2%)
- Worked at home: 6 (3.8%)
- Unemployment by race in 2022
- Unemployment rate for two or more race residents
- 28.4%Males
- 6.9%Females
- Unemployment rate for Hispanic or Latino residents
- 16.8%Females
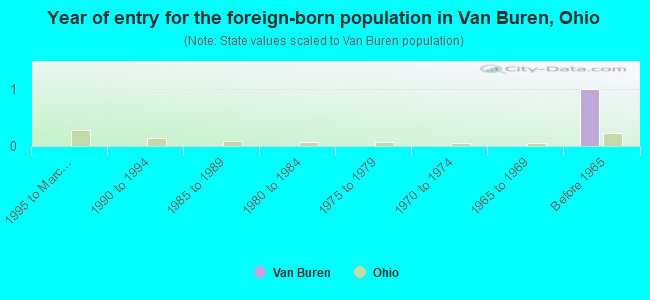
- Year of entry for the foreign-born population in Van Buren, Ohio
- 01995 to March 2000
- 01990 to 1994
- 01985 to 1989
- 01980 to 1984
- 01975 to 1979
- 01970 to 1974
- 01965 to 1969
- 1Before 1965
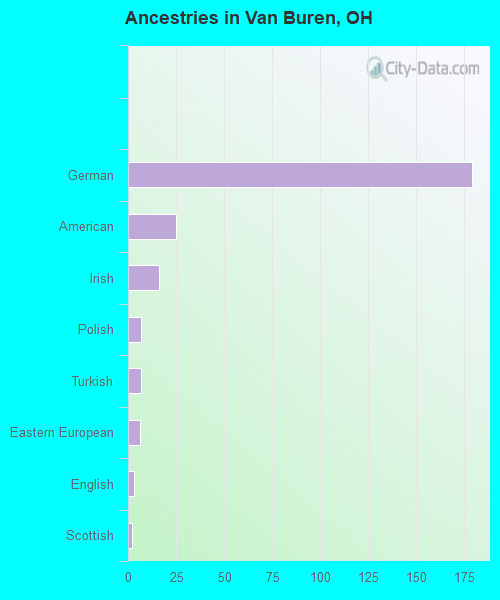
First ancestries reported:
- German: 179 (65.0%)
- American: 25 (9.1%)
- Irish: 16 (5.8%)
- Polish: 7 (2.5%)
- Turkish: 7 (2.5%)
- Eastern European: 6 (2.2%)
- English: 3 (1.1%)
- Scottish: 2 (0.7%)
Place of birth for U.S.-born residents:
- This state: 542
- Other state: 50
- Northeast: 7
- Midwest: 18
- South: 22
- West: 2
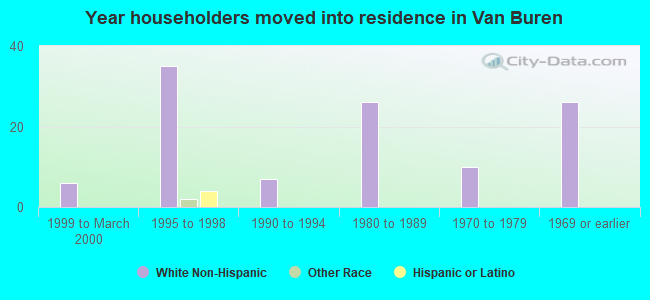
97.1% of Van Buren residents lived in the same house 1 years ago.
Out of people who lived in different houses, 23.1% lived in this county.
Out of people who lived in different counties, 6.7% lived in Ohio.
| Van Buren: | 97.1% |
| State average: | 87.8% |
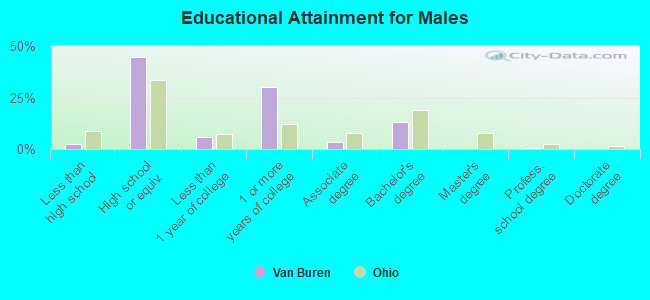
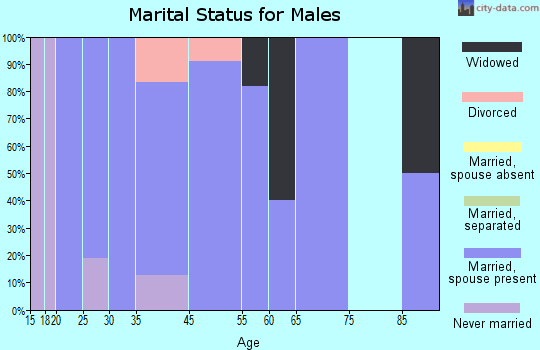
Education attainment for males 25 years and older:
- No schooling: 0
- Nursery to 4th grade: 0
- 5th and 6th grade: 0
- 7th and 8th grade: 0
- 9th grade: 0
- 10th grade: 0
- 11th grade: 0
- 12th grade, no diploma: 4
- High school graduate (or equivalency): 68
- Less than 1 year of college: 9
- Some college more than 1 year, no degree: 46
- Associate degree: 5
- Bachelor's degree: 20
- Master's degree: 0
- Professional school degree: 1
- Doctorate degree: 0
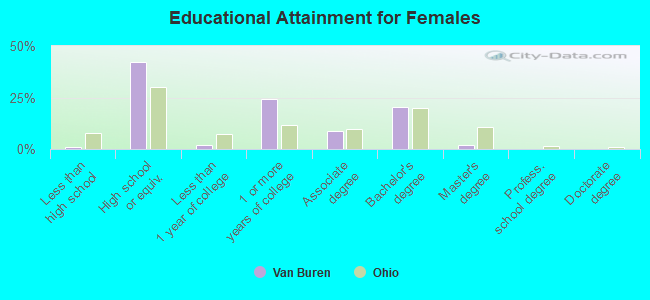
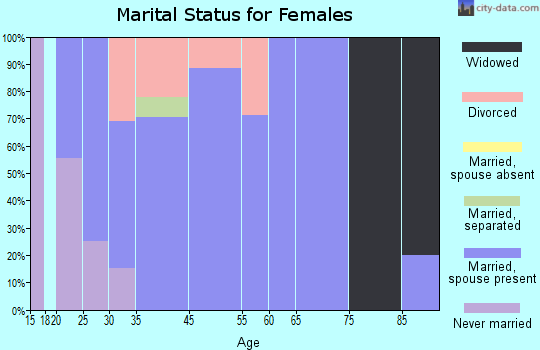
Education attainment for females 25 years and older:
- No schooling: 0
- Nursery to 4th grade: 0
- 5th and 6th grade: 0
- 7th and 8th grade: 0
- 9th grade: 1
- 10th grade: 1
- 11th grade: 0
- 12th grade, no diploma: 0
- High school graduate (or equivalency): 73
- Less than 1 year of college: 3
- Some college more than 1 year, no degree: 42
- Associate degree: 15
- Bachelor's degree: 35
- Master's degree: 3
- Professional school degree: 0
- Doctorate degree: 0
Housing units in structures:
- One, detached: 186
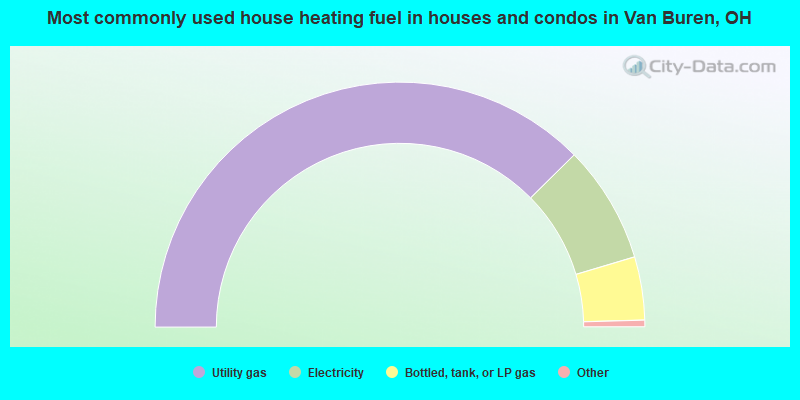
- 75.8%Utility gas
- 15.7%Electricity
- 8.4%Bottled, tank, or LP gas
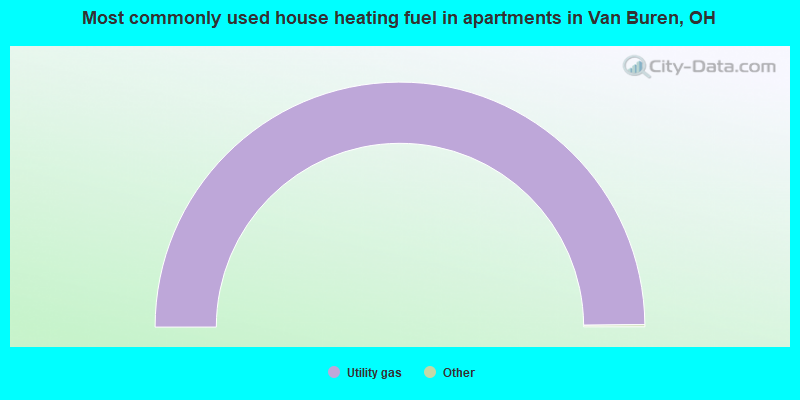
- 100.0%Utility gas
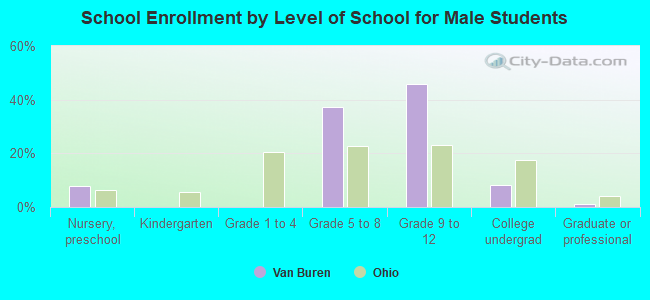
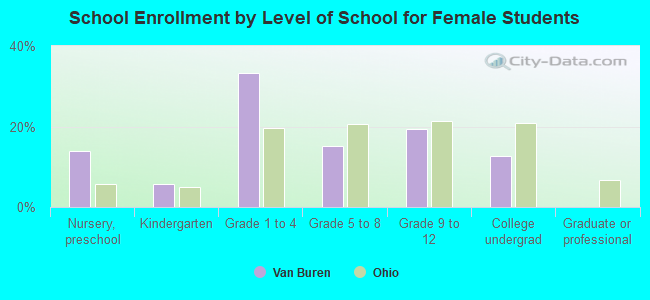
Private vs. public school enrollment:
| Here: | 1.2% |
| Ohio: | 16.0% |
| Here: | 1.5% |
| Ohio: | 13.1% |
| Here: | 5.6% |
| Ohio: | 22.3% |