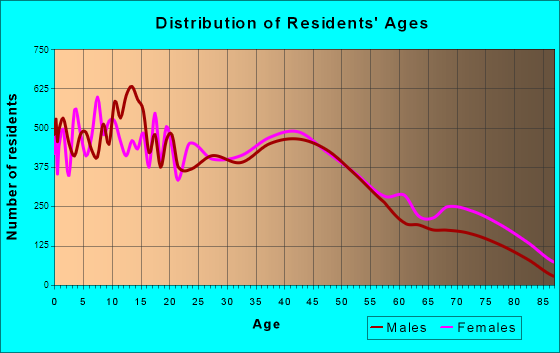
Victoria, TX (Texas) Houses and Residents
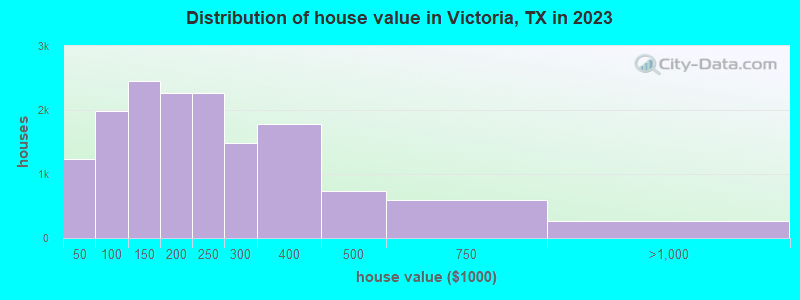
Estimated median house or condo value in 2022: $191,500 (it was $69,400 in 2000 )
Victoria:
$191,500Texas:
$275,400
Lower value quartile - upper value quartile: $85,500 - $267,100Mean price in 2022: Detached houses: $243,972 Here:
$243,972State:
$369,058
Townhouses or other attached units: $173,171 Here:
$173,171State:
$327,631
In 2-unit structures: $136,657 Here:
$136,657State:
$374,947
Mobile homes: $56,794 Here:
$56,794State:
$124,413
Occupied boats, RVs, vans, etc.: $4,862 Total population: 66,094 (Urban population: 59,572, Rural population: 891 (all nonfarm) )
Houses: 29,817 (25,593 occupied: 14,236 owner occupied, 11,357 renter occupied )
% of renters here:
44%State:
38%
Housing density: 904 houses/condos per square mile
Median price asked for vacant for-sale houses and condos in 2022: $206,748.
Median contract rent in 2022: $965 (lower quartile is $769, upper quartile is $1,172)
Median rent asked for vacant for-rent units in 2022: $953
Median gross rent in Victoria, TX in 2022: $1,141
Housing units in Victoria with a mortgage: 8,087 (168 second mortgage, 4 home equity loan, 67 both second mortgage and home equity loan )Houses without a mortgage: 180
Median household income for houses/condos with a mortgage: $88,239
Median household income for apartments without a mortgage: $71,103
Median monthly housing costs: $1,000
Data:
Median house or condo value ($)
Median house or condo value ($ change since 2000)
Median house or condo value ($) - White
Median house or condo value ($) - Black or African American
Median house or condo value ($) - Asian
Median house or condo value ($) - Hispanic or Latino
Median house or condo value ($) - American Indian and Alaska Native
Median house or condo value ($) - Multirace
Median house or condo value ($) - Other Race
Median price asked for mobile homes ($)
Household density (households per square mile)
Mean house or condo value by units in structure - 1, detached ($)
Mean house or condo value by units in structure - 1, attached ($)
Mean house or condo value by units in structure - 2 ($)
Mean house or condo value by units in structure by units in structure - 3 or 4 ($)
Mean house or condo value by units in structure - 5 or more ($)
Mean house or condo value by units in structure - Boat, RV, van, etc. ($)
Mean house or condo value by units in structure - Mobile home ($)
Median contract rent ($)
Median contract rent - Lower quartile ($)
Median contract rent - Upper quartile ($)
Median gross rent ($)
Urban houses (%)
Rural houses (%)
Houses occupied (%)
Houses occupied (% change since 2000)
Houses owner occupied (%)
Houses owner occupied (% change since 2000)
Houses renter occupied (%)
Houses renter occupied (% change since 2000)
Vacant housing units - For rent (%)
Vacant housing units - For rent (% change since 2000)
Vacant housing units - For sale only (%)
Vacant housing units - For sale only (% change since 2000)
Vacant housing units - Rented or sold, not occupied (%)
Vacant housing units - Rented or sold, not occupied (% change since 2000)
Vacant housing units - For seasonal, recreational, or occasional use (%)
Vacant housing units - For seasonal, recreational, or occasional use (% change since 2000)
Vacant housing units - For migrant workers (%)
Vacant housing units - For migrant workers (% change since 2000)
Vacant housing units - Other vacant (%)
Vacant housing units - Other vacant (% change since 2000)
Median monthly housing costs ($)
Median household income for houses/condos with a mortgage ($)
Median household income for houses/condos without a mortgage ($)
Median household income ($)
Median household income ($) - White
Median household income ($) - Black or African American
Median household income ($) - Asian
Median household income ($) - Hispanic or Latino
Median household income ($) - American Indian and Alaska Native
Median household income ($) - Multirace
Median household income ($) - Other Race
Mortgage status - with mortgage (%)
Mortgage status - with second mortgage (%)
Mortgage status - with home equity loan (%)
Mortgage status - with both second mortgage and home equity loan (%)
Mortgage status - without a mortgage (%)
Median year house/condo built
Median year apartment built
Household type by relationship - Male householder living alone (%)
Household type by relationship - Male householder not living alone (%)
Household type by relationship - Female householder living alone (%)
Household type by relationship - Female householder not living alone (%)
Household type by relationship - Opposite-Sex spouse (%)
Household type by relationship - Same-Sex spouse (%)
Household type by relationship - Opposite-Sex unmarried partner (%)
Household type by relationship - Same-Sex unmarried partner (%)
Household type by relationship - In group quarters (%)
Size of family households - 2-person household (%)
Size of family households - 3-person household (%)
Size of family households - 4-person household (%)
Size of family households - 5-person household (%)
Size of family households - 6-person household (%)
Size of family households - 7-or-more-person household (%)
Size of nonfamily households - 1-person household (%)
Size of nonfamily households - 2-person household (%)
Size of nonfamily households - 3-person household (%)
Size of nonfamily households - 4-person household (%)
Size of nonfamily households - 5-person household (%)
Size of nonfamily households - 6-person household (%)
Size of nonfamily households - 7-or-moreperson household (%)
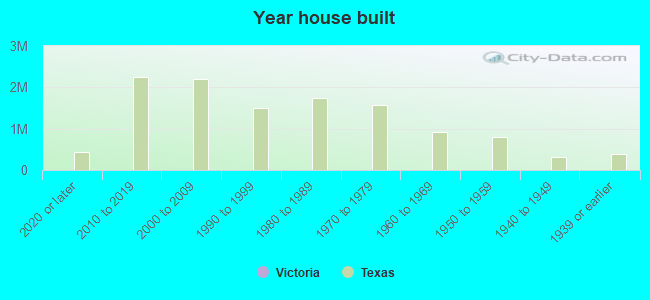
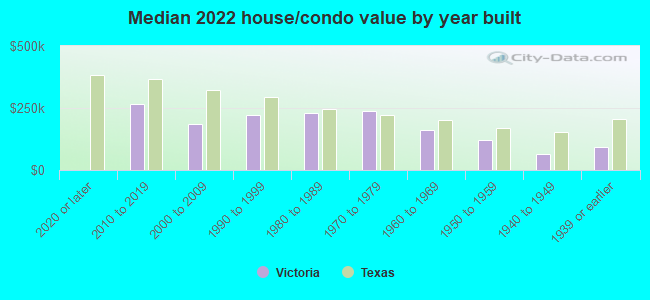
Year house built - Built 2010 or later (%)
Year house built - Built 2000 to 2009 (%)
Year house built - Built 1990 to 1999 (%)
Year house built - Built 1980 to 1989 (%)
Year house built - Built 1970 to 1979 (%)
Year house built - Built 1960 to 1969 (%)
Year house built - Built 1950 to 1959 (%)
Year house built - Built 1940 to 1949 (%)
Year house built - Built 1939 or earlier (%)
Median number of rooms in houses and condos
Median number of rooms in apartments
Median number of bedrooms in owner occupied houses
Mean number of bedrooms in owner occupied houses
Median number of bedrooms in renter occupied houses
Mean number of bedrooms in renter occupied houses
Median number of vehichles in owner occupied houses
Mean number of vehichles in owner occupied houses
Median number of vehichles in renter occupied houses
Mean number of vehichles in renter occupied houses
Rooms in owner-occupied houses - 1 room (%)
Rooms in owner-occupied houses - 2 rooms (%)
Rooms in owner-occupied houses - 3 rooms (%)
Rooms in owner-occupied houses - 4 rooms (%)
Rooms in owner-occupied houses - 5 rooms (%)
Rooms in owner-occupied houses - 6 rooms (%)
Rooms in owner-occupied houses - 7 rooms (%)
Rooms in owner-occupied houses - 8 rooms (%)
Rooms in owner-occupied houses - 9+ rooms (%)
Rooms in renter-occupied houses - 1 room (%)
Rooms in renter-occupied houses - 2 rooms (%)
Rooms in renter-occupied houses - 3 rooms (%)
Rooms in renter-occupied houses - 4 rooms (%)
Rooms in renter-occupied houses - 5 rooms (%)
Rooms in renter-occupied houses - 6 rooms (%)
Rooms in renter-occupied houses - 7 rooms (%)
Rooms in renter-occupied houses - 8 rooms (%)
Rooms in renter-occupied houses - 9+ rooms (%)
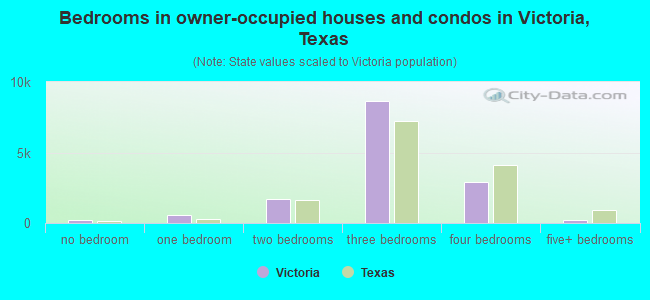
Bedrooms in owner-occupied houses - no bedrooms (%)
Bedrooms in owner-occupied houses - 1 bedroom (%)
Bedrooms in owner-occupied houses - 2 bedrooms (%)
Bedrooms in owner-occupied houses - 3 bedrooms (%)
Bedrooms in owner-occupied houses - 4 bedrooms (%)
Bedrooms in owner-occupied houses - 5+ bedrooms (%)
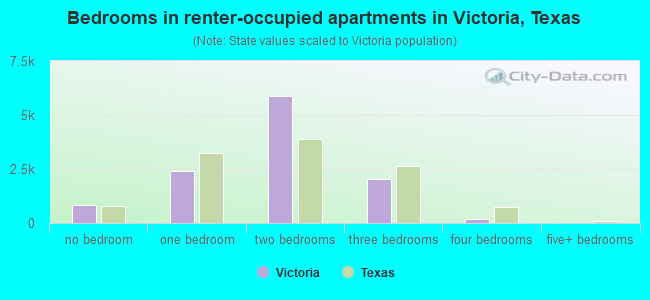
Bedrooms in renter-occupied houses - no bedrooms (%)
Bedrooms in renter-occupied houses - 1 bedroom (%)
Bedrooms in renter-occupied houses - 2 bedrooms (%)
Bedrooms in renter-occupied houses - 3 bedrooms (%)
Bedrooms in renter-occupied houses - 4 bedrooms (%)
Bedrooms in renter-occupied houses - 5+ bedrooms (%)
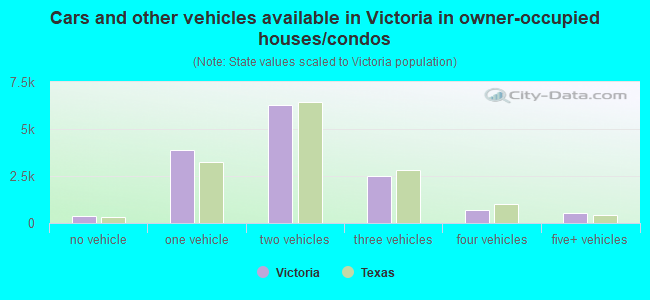
Vehicles available in owner-occupied houses - no vehicle available (%)
Vehicles available in owner-occupied houses - 1 vehicle available(%)
Vehicles available in owner-occupied houses - 2 Vehicles available (%)
Vehicles available in owner-occupied houses - 3 Vehicles available (%)
Vehicles available in owner-occupied houses - 4 Vehicles available (%)
Vehicles available in owner-occupied houses - 5+ Vehicles available (%)
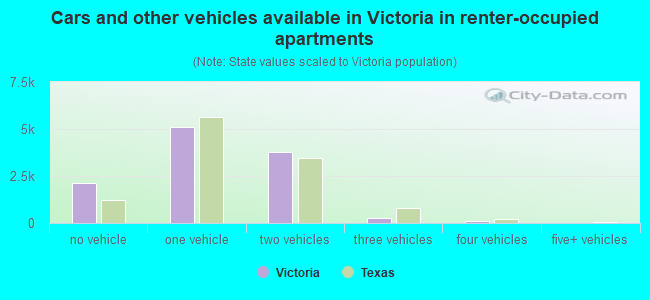
Vehicles available in renter-occupied houses - no vehicle available (%)
Vehicles available in renter-occupied houses - 1 vehicle available (%)
Vehicles available in renter-occupied houses - 2 Vehicles available (%)
Vehicles available in renter-occupied houses - 3 Vehicles available (%)
Vehicles available in renter-occupied houses - 4 Vehicles available (%)
Vehicles available in renter-occupied houses - 5+ Vehicles available (%)
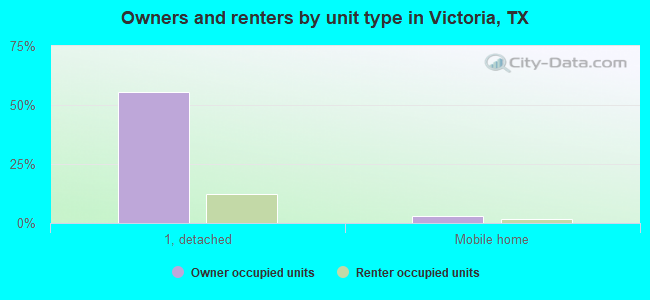
Housing units in structures - 1, detached (%)
Housing units in structures - 1, attached (%)
Housing units in structures - 2 (%)
Housing units in structures - 3 or 4 (%)
Housing units in structures - 5 to 9 (%)
Housing units in structures - 10 to 19 (%)
Housing units in structures - 20 to 49 (%)
Housing units in structures - 50 or more (%)
Housing units in structures - Mobile home (%)
Housing units in structures - Boat, RV, van, etc. (%)
Housing units in structures - Owners - 1, detached (%)
Housing units in structures - Owners - 1, attached (%)
Housing units in structures - Owners - 2 (%)
Housing units in structures - Owners - 3 or 4 (%)
Housing units in structures - Owners - 5 to 9 (%)
Housing units in structures - Owners - 10 to 19 (%)
Housing units in structures - Owners - 20 to 49 (%)
Housing units in structures - Owners - 50 or more (%)
Housing units in structures - Owners - Mobile home (%)
Housing units in structures - Owners - Boat, RV, van, etc. (%)
Housing units in structures - Renters - 1, detached (%)
Housing units in structures - Renters - 1, attached (%)
Housing units in structures - Renters - 2 (%)
Housing units in structures - Renters - 3 or 4 (%)
Housing units in structures - Renters - 5 to 9 (%)
Housing units in structures - Renters - 10 to 19 (%)
Housing units in structures - Renters - 20 to 49 (%)
Housing units in structures - Renters - 50 or more (%)
Housing units in structures - Renters - Mobile home (%)
Housing units in structures - Renters - Boat, RV, van, etc. (%)
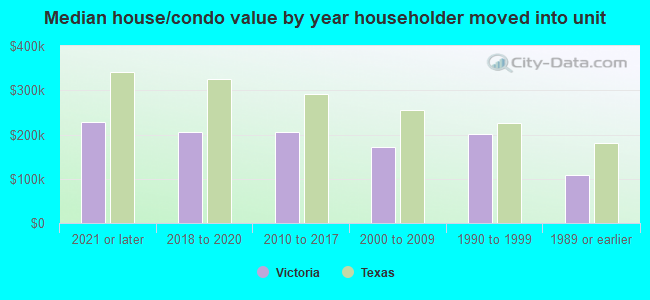
House/condo owner moved in on average (years ago)
Renter moved in on average (years ago)
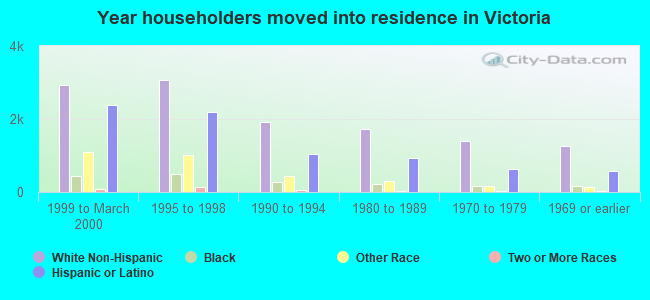
Year householder moved into unit - Moved in 1999 to March 2000 (%)
Year householder moved into unit - Moved in 1999 to March 2000 (%) - White
Year householder moved into unit - Moved in 1999 to March 2000 (%) - Black or African American
Year householder moved into unit - Moved in 1999 to March 2000 (%) - Asian
Year householder moved into unit - Moved in 1999 to March 2000 (%) - Hispanic or Latino
Year householder moved into unit - Moved in 1999 to March 2000 (%) - American Indian and Alaska Native
Year householder moved into unit - Moved in 1999 to March 2000 (%) - Multirace
Year householder moved into unit - Moved in 1999 to March 2000 (%) - Other Race
Year householder moved into unit - Moved in 1995 to 1998 (%)
Year householder moved into unit - Moved in 1995 to 1998 (%) - White
Year householder moved into unit - Moved in 1995 to 1998 (%) - Black or African American
Year householder moved into unit - Moved in 1995 to 1998 (%) - Asian
Year householder moved into unit - Moved in 1995 to 1998 (%) - Hispanic or Latino
Year householder moved into unit - Moved in 1995 to 1998 (%) - American Indian and Alaska Native
Year householder moved into unit - Moved in 1995 to 1998 (%) - Multirace
Year householder moved into unit - Moved in 1995 to 1998 (%) - Other Race
Year householder moved into unit - Moved in 1990 to 1994 (%)
Year householder moved into unit - Moved in 1990 to 1994 (%) - White
Year householder moved into unit - Moved in 1990 to 1994 (%) - Black or African American
Year householder moved into unit - Moved in 1990 to 1994 (%) - Asian
Year householder moved into unit - Moved in 1990 to 1994 (%) - Hispanic or Latino
Year householder moved into unit - Moved in 1990 to 1994 (%) - American Indian and Alaska Native
Year householder moved into unit - Moved in 1990 to 1994 (%) - Multirace
Year householder moved into unit - Moved in 1990 to 1994 (%) - Other Race
Year householder moved into unit - Moved in 1980 to 1989 (%)
Year householder moved into unit - Moved in 1980 to 1989 (%) - White
Year householder moved into unit - Moved in 1980 to 1989 (%) - Black or African American
Year householder moved into unit - Moved in 1980 to 1989 (%) - Asian
Year householder moved into unit - Moved in 1980 to 1989 (%) - Hispanic or Latino
Year householder moved into unit - Moved in 1980 to 1989 (%) - American Indian and Alaska Native
Year householder moved into unit - Moved in 1980 to 1989 (%) - Multirace
Year householder moved into unit - Moved in 1980 to 1989 (%) - Other Race
Year householder moved into unit - Moved in 1970 to 1979 (%)
Year householder moved into unit - Moved in 1970 to 1979 (%) - White
Year householder moved into unit - Moved in 1970 to 1979 (%) - Black or African American
Year householder moved into unit - Moved in 1970 to 1979 (%) - Asian
Year householder moved into unit - Moved in 1970 to 1979 (%) - Hispanic or Latino
Year householder moved into unit - Moved in 1970 to 1979 (%) - American Indian and Alaska Native
Year householder moved into unit - Moved in 1970 to 1979 (%) - Multirace
Year householder moved into unit - Moved in 1970 to 1979 (%) - Other Race
Year householder moved into unit - Moved in 1969 or earlier (%)
Year householder moved into unit - Moved in 1969 or earlier (%) - White
Year householder moved into unit - Moved in 1969 or earlier (%) - Black or African American
Year householder moved into unit - Moved in 1969 or earlier (%) - Asian
Year householder moved into unit - Moved in 1969 or earlier (%) - Hispanic or Latino
Year householder moved into unit - Moved in 1969 or earlier (%) - American Indian and Alaska Native
Year householder moved into unit - Moved in 1969 or earlier (%) - Multirace
Year householder moved into unit - Moved in 1969 or earlier (%) - Other Race
Housing units lacking complete plumbing facilities (%)
Housing units lacking complete kitchen facilities (%)
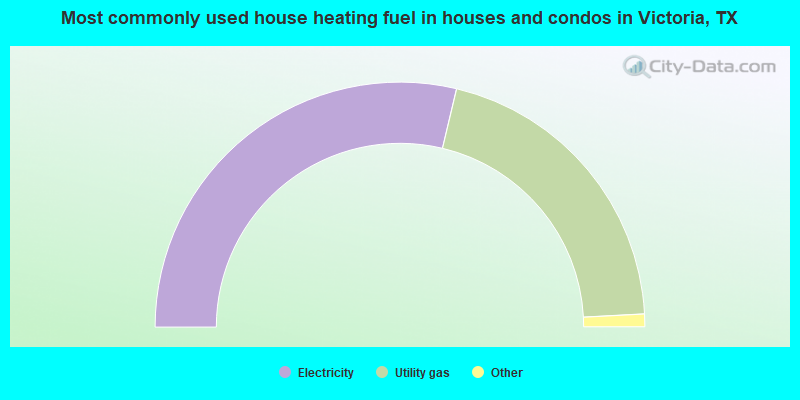
House heating fuel used in houses and condos - Utility gas (%)
House heating fuel used in houses and condos - Bottled, tank, or LP gas (%)
House heating fuel used in houses and condos - Electricity (%)
House heating fuel used in houses and condos - Fuel oil, kerosene, etc. (%)
House heating fuel used in houses and condos - Coal or coke (%)
House heating fuel used in houses and condos - Wood (%)
House heating fuel used in houses and condos - Solar energy (%)
House heating fuel used in houses and condos - Other fuel (%)
House heating fuel used in houses and condos - No fuel used (%)
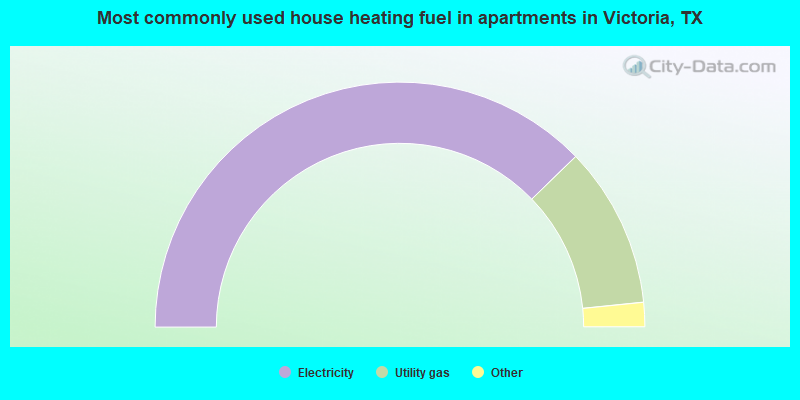
House heating fuel used in apartments - Utility gas (%)
House heating fuel used in apartments - Bottled, tank, or LP gas (%)
House heating fuel used in apartments - Electricity (%)
House heating fuel used in apartments - Fuel oil, kerosene, etc. (%)
House heating fuel used in apartments - Coal or coke (%)
House heating fuel used in apartments - Wood (%)
House heating fuel used in apartments - Solar energy (%)
House heating fuel used in apartments - Other fuel (%)
House heating fuel used in apartments - No fuel used (%)
Latest news about housing in Victoria, TX collected exclusively by city-data.com from local newspapers, TV, and radio stations
Median year house/condo built: 1978Median year apartment built: 1982Household type by relationship:
Households: 65,372
Male householders: 13,169 (3,752 living alone ), Female householders: 12,424 (3,360 living alone )10,857 spouses (10,824 opposite-sex spouses ), 2,963 unmarried partners , (2,486 opposite-sex unmarried partners ), 19,410 children (18,020 natural , 358 adopted , 1,032 stepchildren ), 1,813 grandchildren , 366 brothers or sisters , 676 parents , 0 foster children , 831 other relatives , 1,836 non-relatives In group quarters: 1,027
Size of family households: 6,649 2-persons , 4,385 3-persons , 2,451 4-persons , 1,069 5-persons , 762 6-persons , 345 7-or-more-persons .
Size of nonfamily households: 7,112 1-person , 2,678 2-persons , 142 4-persons .
9,189 married couples with children. single-parent households (1,675 men , 2,393 women ).
71.8% of residents of Victoria speak English at home. of residents speak Spanish at home (78% speak English very well , 10% speak English well , 8% speak English not well , 4% don't speak English at all ).of residents speak other Indo-European language at home (84% speak English very well , 16% speak English well ).of residents speak Asian or Pacific Island language at home (51% speak English very well , 30% speak English well , 14% speak English not well , 5% don't speak English at all ).of residents speak other language at home (75% speak English very well , 25% speak English well ).
Foreign born population: 5,391 (8.2%)of them are naturalized citizens )
Median number of rooms in houses and condos:
Median number of rooms in apartments
Owner-occupied Renter-occupied
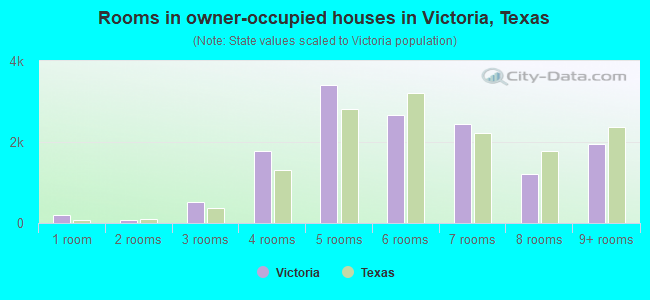
Rooms in owner-occupied houses in Victoria, Texas
202 1 room 65 2 rooms 518 3 rooms 1,785 4 rooms 3,397 5 rooms 2,677 6 rooms 2,434 7 rooms 1,215 8 rooms 1,943 9+ rooms
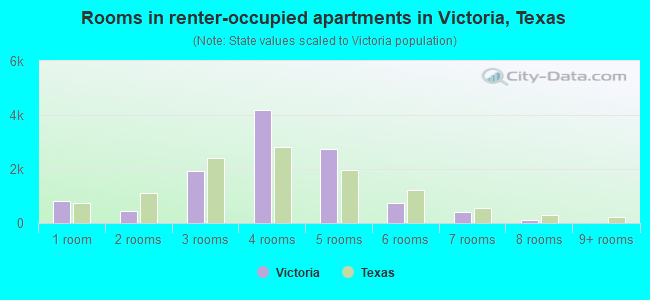
Rooms in renter-occupied apartments in Victoria, Texas
820 1 room 433 2 rooms 1,940 3 rooms 4,174 4 rooms 2,730 5 rooms 726 6 rooms 407 7 rooms 127 8 rooms 0 9+ rooms
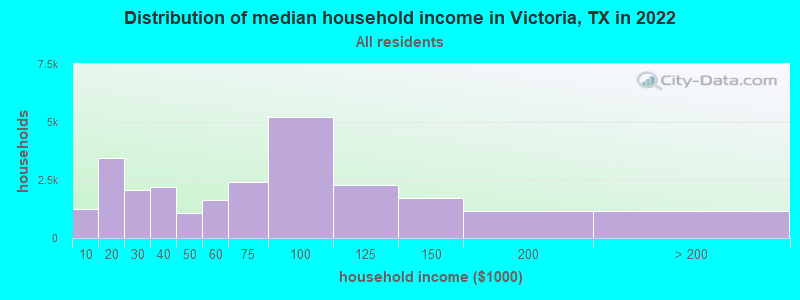
Victoria, TX household income distribution 1,236 Less than $10,0003,436 $10,000 to $19,9992,081 $20,000 to $29,9992,188 $30,000 to $39,9991,064 $40,000 to $49,9991,625 $50,000 to $59,9992,424 $60,000 to $74,9995,206 $75,000 to $99,9992,276 $100,000 to $124,9991,727 $125,000 to $149,9991,145 $150,000 to $199,9991,185 $200,000 or more
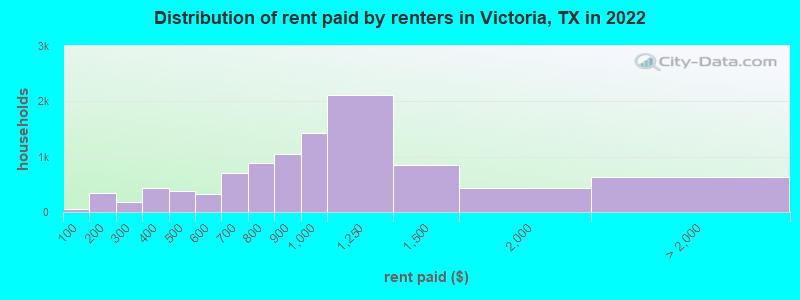
Home value of owner - occupied houses in 2022 in Victoria, TX 297 Less than $10,000102 $10,000 to $14,999174 $15,000 to $19,999202 $20,000 to $24,999293 $25,000 to $29,999114 $30,000 to $34,999631 $40,000 to $49,999525 $50,000 to $59,999642 $60,000 to $69,999354 $70,000 to $79,999410 $80,000 to $89,999555 $90,000 to $99,999640 $100,000 to $124,999621 $125,000 to $149,999652 $150,000 to $174,9991,375 $175,000 to $199,9992,573 $200,000 to $249,9991,516 $250,000 to $299,9991,717 $300,000 to $399,999662 $400,000 to $499,999181 $500,000 to $749,999Rent paid by renters in 2022 in Victoria, TX 61 Less than $100207 $100 to $149135 $150 to $199112 $200 to $24962 $250 to $299271 $300 to $349153 $350 to $399224 $400 to $449156 $450 to $499117 $500 to $549207 $550 to $599363 $600 to $649332 $650 to $699516 $700 to $749362 $750 to $7991,057 $800 to $8991,430 $900 to $9992,108 $1,000 to $1,249848 $1,250 to $1,499441 $1,500 to $1,99960 $2,000 to $2,49927 $2,500 to $2,99949 $3,500 or more494 No cash rent
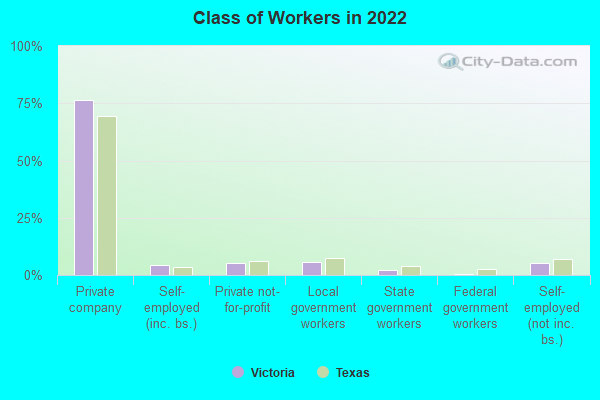
Percentage of workers working in this county: 75.8%Number of people working at home: 2,465 (7.8% of all workers )
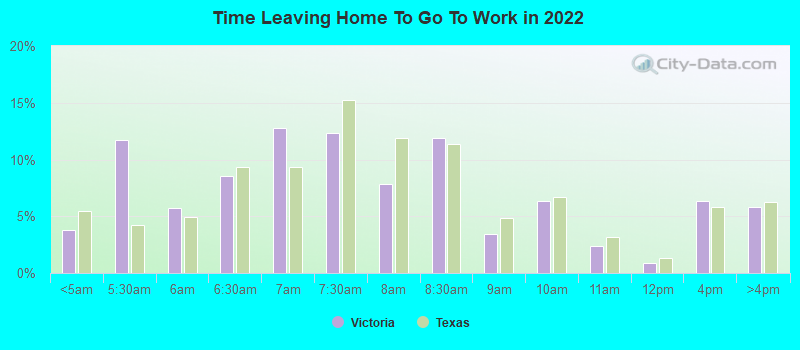
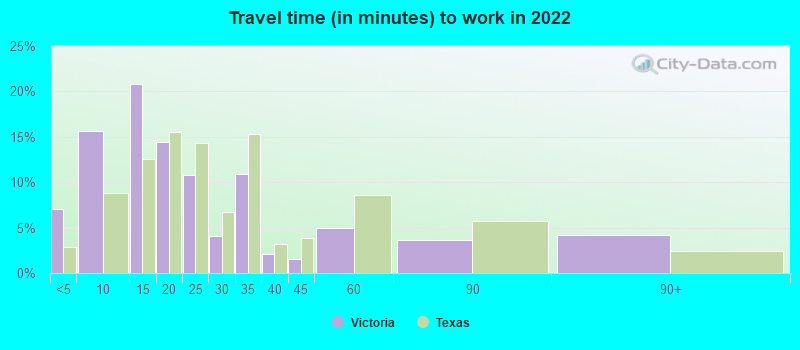
Travel time to work (commute)
Less than 5 minutes: 1,2785 to 9 minutes: 5,49410 to 14 minutes: 6,60815 to 19 minutes: 3,97420 to 24 minutes: 2,09825 to 29 minutes: 91030 to 34 minutes: 1,72835 to 39 minutes: 4740 to 44 minutes: 1,03345 to 59 minutes: 3,97860 to 89 minutes: 51990 or more minutes: 709
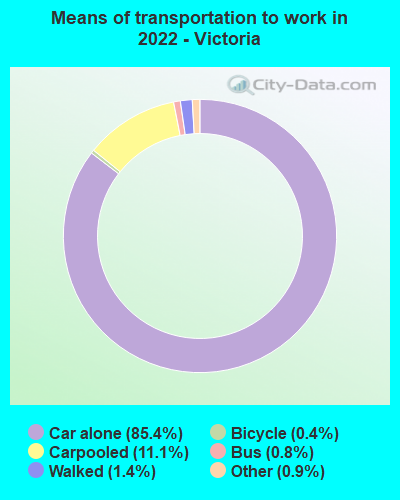
Means of transportation to work:
Drove a car alone: 26,848 (76.6%)Carpooled: 3,809 (10.9%)Bus : 228 (0.7%)Taxi: 352 (1.0%)Bicycle: 116 (0.3%)Walked: 459 (1.3%)Worked at home: 2,465 (7.0%)
Unemployment by race in 2022
Unemployment rate for White non-Hispanic residents 5.6% Males1.4% FemalesUnemployment rate for Black residents 6.2% Males8.4% FemalesUnemployment rate for American Indian and Alaska Native residents 38.7% MalesUnemployment rate for Asian residents 3.9% MalesUnemployment rate for other race residents 1.7% Males8.7% FemalesUnemployment rate for two or more race residents 8.4% Males3.0% FemalesUnemployment rate for Hispanic or Latino residents 3.1% Males2.3% Females
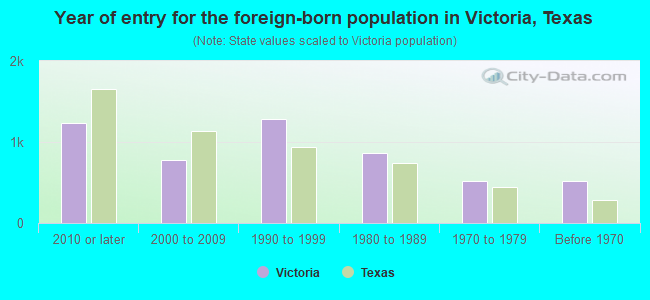
Year of entry for the foreign-born population in Victoria, Texas
1,233 2010 or later 774 2000 to 2009 1,286 1990 to 1999 860 1980 to 1989 513 1970 to 1979 523 Before 1970
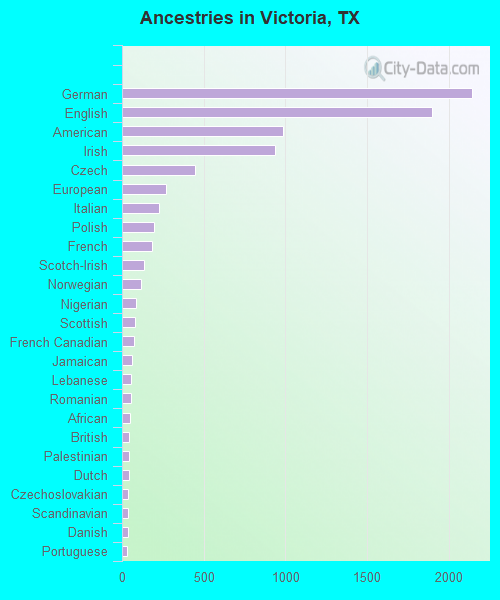
First ancestries reported:
German: 2,140 (5.4%)
English: 1,896 (4.7%)
American: 985 (2.5%)
Irish: 937 (2.3%)
Czech: 450 (1.1%)
European: 270 (0.7%)
Italian: 226 (0.6%)
Polish: 193 (0.5%)
French: 185 (0.5%)
Scotch-Irish: 135 (0.3%)
Norwegian: 114 (0.3%)
Nigerian: 87 (0.2%)
Scottish: 82 (0.2%)
French Canadian: 71 (0.2%)
Jamaican: 60 (0.2%)
Lebanese: 55 (0.1%)
Romanian: 53 (0.1%)
African: 49 (0.1%)
British: 45 (0.1%)
Palestinian: 43 (0.1%)
Dutch: 40 (0.1%)
Czechoslovakian: 37 (0.09%)
Scandinavian: 36 (0.09%)
Danish: 35 (0.09%)
Portuguese: 33 (0.08%)
Greek: 31 (0.08%)
Syrian: 30 (0.08%)
Slovak: 27 (0.07%)
Turkish: 24 (0.06%)
Ukrainian: 24 (0.06%)
Slovene: 19 (0.05%)
Iranian: 17 (0.04%)
Hungarian: 14 (0.04%)
Belgian: 12 (0.03%)
Swiss: 11 (0.03%)
Eastern European: 10 (0.03%)
Welsh: 9 (0.02%)
Sudanese: 6 (0.02%)
Northern European: 5 (0.01%)
Swedish: 5 (0.01%) Most common places of birth for foreign-born residents (%): Mexico Victoria:
60.6% (3,069)Texas:
48.4% (2,411,723)
El Salvador Victoria:
7.0% (353)Texas:
4.5% (224,455)
Vietnam Victoria:
4.1% (209)Texas:
3.7% (184,770)
Philippines Victoria:
3.5% (175)Texas:
2.1% (103,148)
Honduras Victoria:
3.0% (151)Texas:
3.0% (147,182)
Taiwan Victoria:
2.4% (122)Texas:
0.6% (27,844)
India Victoria:
2.0% (103)Texas:
6.1% (306,347)
China, excluding Hong Kong and Taiwan Victoria:
1.7% (84)Texas:
2.3% (115,558)
Colombia Victoria:
1.5% (76)Texas:
1.2% (61,555)
Place of birth for U.S.-born residents:
This state: 51,339Other state: 8,444Northeast: 2,255Midwest: 1,960South: 2,287West: 1,942 82.3% of Victoria residents lived in the same house 1 years ago.
Out of people who lived in different houses, 37.8% lived in this county.
Out of people who lived in different counties, 81.2% lived in Texas.
Victoria:
82.3%State average:
85.7%
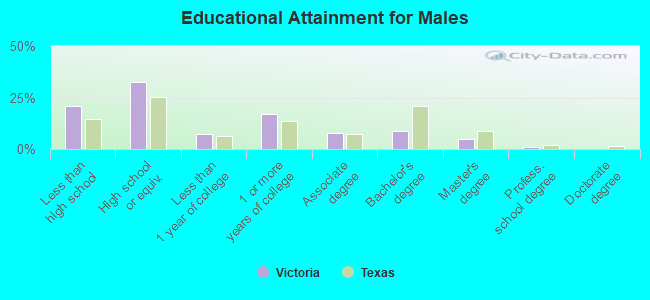
Education attainment for males 25 years and older:
No schooling: 449Nursery to 4th grade: 4025th and 6th grade: 1437th and 8th grade: 2469th grade: 1,00710th grade: 94111th grade: 1,17612th grade, no diploma: 61High school graduate (or equivalency): 6,906Less than 1 year of college: 1,562Some college more than 1 year, no degree: 3,621Associate degree: 1,630Bachelor's degree: 1,889Master's degree: 1,042Professional school degree: 228Doctorate degree: 31
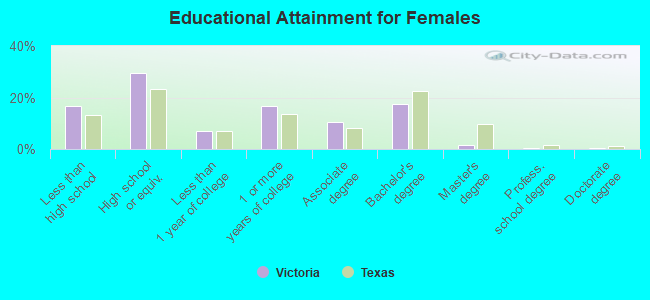
Education attainment for females 25 years and older:
No schooling: 506Nursery to 4th grade: 2995th and 6th grade: 577th and 8th grade: 5929th grade: 73710th grade: 62711th grade: 34112th grade, no diploma: 283High school graduate (or equivalency): 6,093Less than 1 year of college: 1,413Some college more than 1 year, no degree: 3,487Associate degree: 2,160Bachelor's degree: 3,599Master's degree: 317Professional school degree: 95Doctorate degree: 113
Housing units in structures:
One, detached: 17,335One, attached: 793Two: 1,4983 or 4: 2,9135 to 9: 1,88410 to 19: 1,55920 to 49: 72250 or more: 1,292Mobile homes: 1,821Median worth of mobile homes: $25,800
Housing units lacking complete plumbing facilities in 2022: 2.2%Housing units lacking complete kitchen facilities in 2022: 8.5%House/condo owner moved in on average 11 years ago
Renter moved in on average 2 years ago
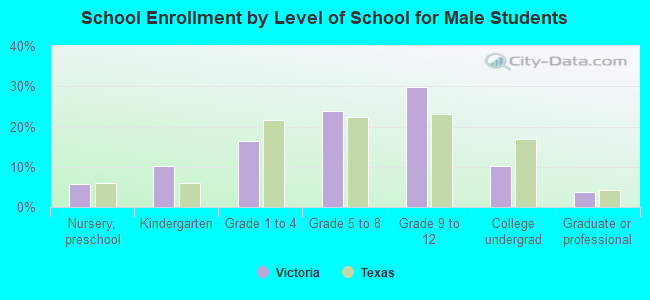
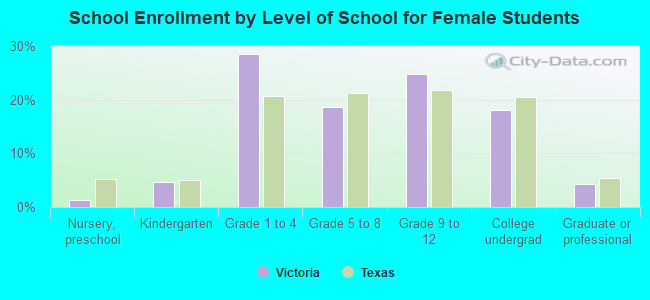
Private vs. public school enrollment:
Students in private schools in grades 1 to 8 (elementary and middle school): 1,543 Students in private schools in grades 9 to 12 (high school): 475 Students in private undergraduate colleges: 508