Vineland, NJ (New Jersey) Houses and Residents
Estimated median house or condo value in 2022: $215,514 (it was $94,000 in 2000 )
Vineland:
$215,514New Jersey:
$428,900
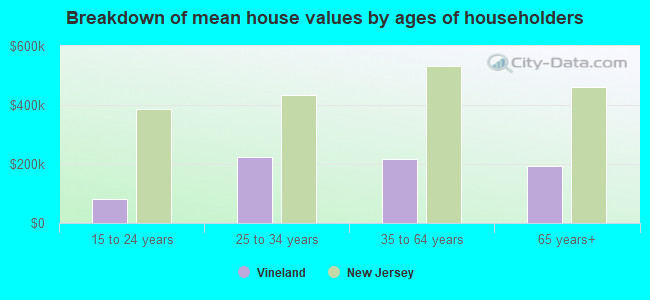
Lower value quartile - upper value quartile: $151,396 - $282,485Mean price in 2022: Detached houses: $241,730 Here:
$241,730State:
$537,591
Townhouses or other attached units: $245,844 Here:
$245,844State:
$381,113
In 2-unit structures: $142,959 Here:
$142,959State:
$444,476
In 3-to-4-unit structures: $175,614 Here:
$175,614State:
$457,463
In 5-or-more-unit structures: $120,025 Here:
$120,025State:
$368,745
Mobile homes: $42,974 Here:
$42,974State:
$119,788
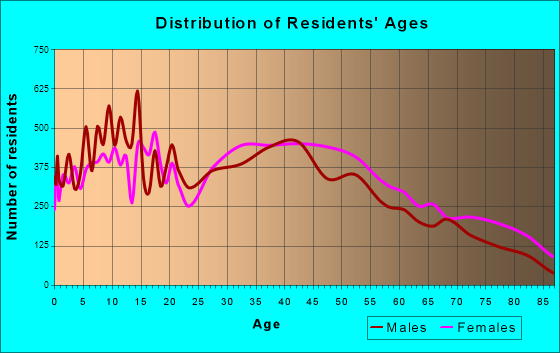
Total population: 61,171 (Urban population: 53,331, Rural population: 2,940 (96 farm, 2,844 nonfarm ))
Houses: 22,865 (21,613 occupied: 15,516 owner occupied, 7,031 renter occupied )
% of renters here:
31%State:
35%
Housing density: 333 houses/condos per square mile
Median price asked for vacant for-sale houses and condos in 2022: $451,056.
Median contract rent in 2022: $973 (lower quartile is $822, upper quartile is $1,174)
Median rent asked for vacant for-rent units in 2022: $486
Median gross rent in Vineland, NJ in 2022: $1,095
Housing units in Vineland with a mortgage: 9,841 (728 second mortgage, 66 home equity loan, 375 both second mortgage and home equity loan )Houses without a mortgage: 324
Median household income for houses/condos with a mortgage: $93,896
Median household income for apartments without a mortgage: $61,337
Median monthly housing costs: $1,227
Data:
Median house or condo value ($)
Median house or condo value ($ change since 2000)
Median house or condo value ($) - White
Median house or condo value ($) - Black or African American
Median house or condo value ($) - Asian
Median house or condo value ($) - Hispanic or Latino
Median house or condo value ($) - American Indian and Alaska Native
Median house or condo value ($) - Multirace
Median house or condo value ($) - Other Race
Median price asked for mobile homes ($)
Household density (households per square mile)
Mean house or condo value by units in structure - 1, detached ($)
Mean house or condo value by units in structure - 1, attached ($)
Mean house or condo value by units in structure - 2 ($)
Mean house or condo value by units in structure by units in structure - 3 or 4 ($)
Mean house or condo value by units in structure - 5 or more ($)
Mean house or condo value by units in structure - Boat, RV, van, etc. ($)
Mean house or condo value by units in structure - Mobile home ($)
Median contract rent ($)
Median contract rent - Lower quartile ($)
Median contract rent - Upper quartile ($)
Median gross rent ($)
Urban houses (%)
Rural houses (%)
Houses occupied (%)
Houses occupied (% change since 2000)
Houses owner occupied (%)
Houses owner occupied (% change since 2000)
Houses renter occupied (%)
Houses renter occupied (% change since 2000)
Vacant housing units - For rent (%)
Vacant housing units - For rent (% change since 2000)
Vacant housing units - For sale only (%)
Vacant housing units - For sale only (% change since 2000)
Vacant housing units - Rented or sold, not occupied (%)
Vacant housing units - Rented or sold, not occupied (% change since 2000)
Vacant housing units - For seasonal, recreational, or occasional use (%)
Vacant housing units - For seasonal, recreational, or occasional use (% change since 2000)
Vacant housing units - For migrant workers (%)
Vacant housing units - For migrant workers (% change since 2000)
Vacant housing units - Other vacant (%)
Vacant housing units - Other vacant (% change since 2000)
Median monthly housing costs ($)
Median household income for houses/condos with a mortgage ($)
Median household income for houses/condos without a mortgage ($)
Median household income ($)
Median household income ($) - White
Median household income ($) - Black or African American
Median household income ($) - Asian
Median household income ($) - Hispanic or Latino
Median household income ($) - American Indian and Alaska Native
Median household income ($) - Multirace
Median household income ($) - Other Race
Mortgage status - with mortgage (%)
Mortgage status - with second mortgage (%)
Mortgage status - with home equity loan (%)
Mortgage status - with both second mortgage and home equity loan (%)
Mortgage status - without a mortgage (%)
Median year house/condo built
Median year apartment built
Household type by relationship - Male householder living alone (%)
Household type by relationship - Male householder not living alone (%)
Household type by relationship - Female householder living alone (%)
Household type by relationship - Female householder not living alone (%)
Household type by relationship - Opposite-Sex spouse (%)
Household type by relationship - Same-Sex spouse (%)
Household type by relationship - Opposite-Sex unmarried partner (%)
Household type by relationship - Same-Sex unmarried partner (%)
Household type by relationship - In group quarters (%)
Size of family households - 2-person household (%)
Size of family households - 3-person household (%)
Size of family households - 4-person household (%)
Size of family households - 5-person household (%)
Size of family households - 6-person household (%)
Size of family households - 7-or-more-person household (%)
Size of nonfamily households - 1-person household (%)
Size of nonfamily households - 2-person household (%)
Size of nonfamily households - 3-person household (%)
Size of nonfamily households - 4-person household (%)
Size of nonfamily households - 5-person household (%)
Size of nonfamily households - 6-person household (%)
Size of nonfamily households - 7-or-moreperson household (%)
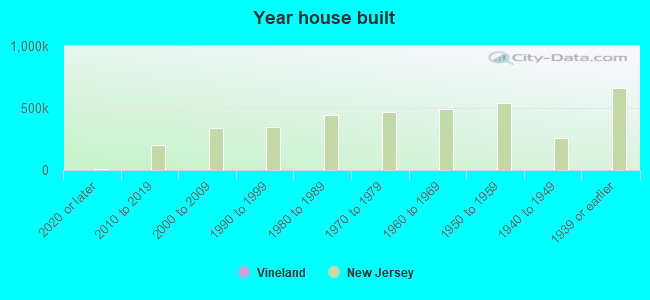
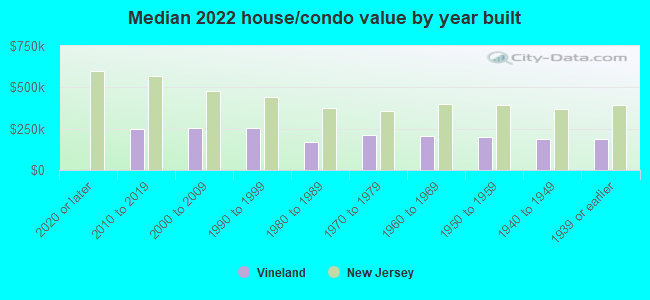
Year house built - Built 2010 or later (%)
Year house built - Built 2000 to 2009 (%)
Year house built - Built 1990 to 1999 (%)
Year house built - Built 1980 to 1989 (%)
Year house built - Built 1970 to 1979 (%)
Year house built - Built 1960 to 1969 (%)
Year house built - Built 1950 to 1959 (%)
Year house built - Built 1940 to 1949 (%)
Year house built - Built 1939 or earlier (%)
Median number of rooms in houses and condos
Median number of rooms in apartments
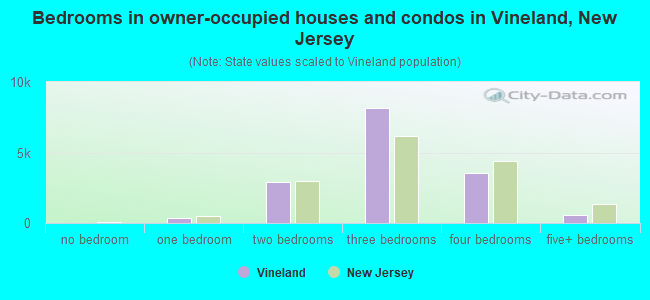
Median number of bedrooms in owner occupied houses
Mean number of bedrooms in owner occupied houses
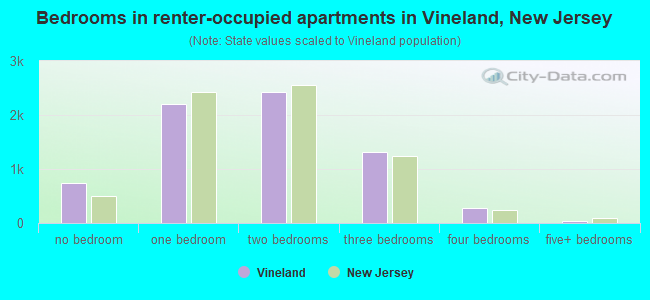
Median number of bedrooms in renter occupied houses
Mean number of bedrooms in renter occupied houses
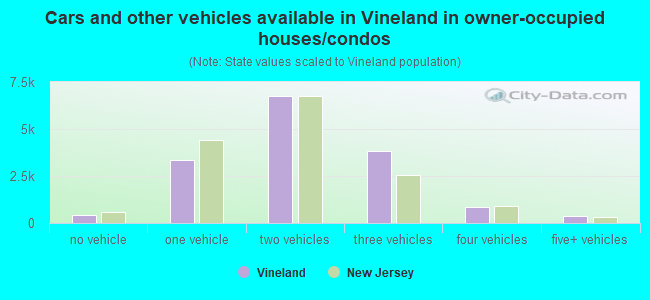
Median number of vehichles in owner occupied houses
Mean number of vehichles in owner occupied houses
Median number of vehichles in renter occupied houses
Mean number of vehichles in renter occupied houses
Rooms in owner-occupied houses - 1 room (%)
Rooms in owner-occupied houses - 2 rooms (%)
Rooms in owner-occupied houses - 3 rooms (%)
Rooms in owner-occupied houses - 4 rooms (%)
Rooms in owner-occupied houses - 5 rooms (%)
Rooms in owner-occupied houses - 6 rooms (%)
Rooms in owner-occupied houses - 7 rooms (%)
Rooms in owner-occupied houses - 8 rooms (%)
Rooms in owner-occupied houses - 9+ rooms (%)
Rooms in renter-occupied houses - 1 room (%)
Rooms in renter-occupied houses - 2 rooms (%)
Rooms in renter-occupied houses - 3 rooms (%)
Rooms in renter-occupied houses - 4 rooms (%)
Rooms in renter-occupied houses - 5 rooms (%)
Rooms in renter-occupied houses - 6 rooms (%)
Rooms in renter-occupied houses - 7 rooms (%)
Rooms in renter-occupied houses - 8 rooms (%)
Rooms in renter-occupied houses - 9+ rooms (%)
Bedrooms in owner-occupied houses - no bedrooms (%)
Bedrooms in owner-occupied houses - 1 bedroom (%)
Bedrooms in owner-occupied houses - 2 bedrooms (%)
Bedrooms in owner-occupied houses - 3 bedrooms (%)
Bedrooms in owner-occupied houses - 4 bedrooms (%)
Bedrooms in owner-occupied houses - 5+ bedrooms (%)
Bedrooms in renter-occupied houses - no bedrooms (%)
Bedrooms in renter-occupied houses - 1 bedroom (%)
Bedrooms in renter-occupied houses - 2 bedrooms (%)
Bedrooms in renter-occupied houses - 3 bedrooms (%)
Bedrooms in renter-occupied houses - 4 bedrooms (%)
Bedrooms in renter-occupied houses - 5+ bedrooms (%)
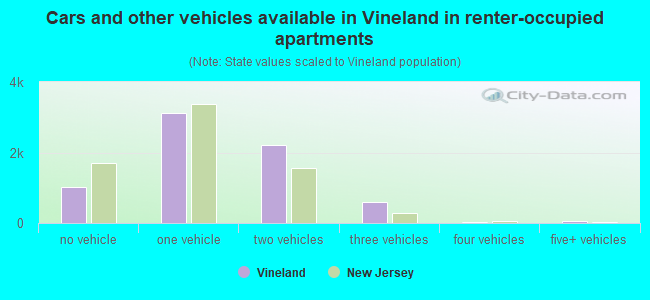
Vehicles available in owner-occupied houses - no vehicle available (%)
Vehicles available in owner-occupied houses - 1 vehicle available(%)
Vehicles available in owner-occupied houses - 2 Vehicles available (%)
Vehicles available in owner-occupied houses - 3 Vehicles available (%)
Vehicles available in owner-occupied houses - 4 Vehicles available (%)
Vehicles available in owner-occupied houses - 5+ Vehicles available (%)
Vehicles available in renter-occupied houses - no vehicle available (%)
Vehicles available in renter-occupied houses - 1 vehicle available (%)
Vehicles available in renter-occupied houses - 2 Vehicles available (%)
Vehicles available in renter-occupied houses - 3 Vehicles available (%)
Vehicles available in renter-occupied houses - 4 Vehicles available (%)
Vehicles available in renter-occupied houses - 5+ Vehicles available (%)
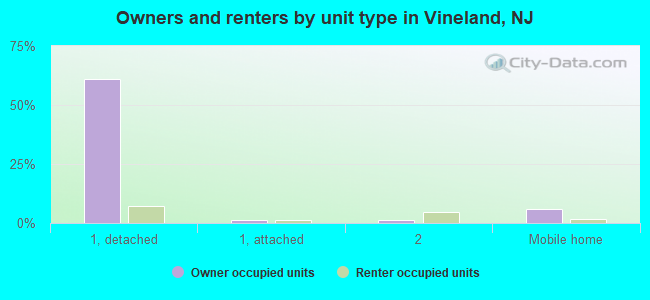
Housing units in structures - 1, detached (%)
Housing units in structures - 1, attached (%)
Housing units in structures - 2 (%)
Housing units in structures - 3 or 4 (%)
Housing units in structures - 5 to 9 (%)
Housing units in structures - 10 to 19 (%)
Housing units in structures - 20 to 49 (%)
Housing units in structures - 50 or more (%)
Housing units in structures - Mobile home (%)
Housing units in structures - Boat, RV, van, etc. (%)
Housing units in structures - Owners - 1, detached (%)
Housing units in structures - Owners - 1, attached (%)
Housing units in structures - Owners - 2 (%)
Housing units in structures - Owners - 3 or 4 (%)
Housing units in structures - Owners - 5 to 9 (%)
Housing units in structures - Owners - 10 to 19 (%)
Housing units in structures - Owners - 20 to 49 (%)
Housing units in structures - Owners - 50 or more (%)
Housing units in structures - Owners - Mobile home (%)
Housing units in structures - Owners - Boat, RV, van, etc. (%)
Housing units in structures - Renters - 1, detached (%)
Housing units in structures - Renters - 1, attached (%)
Housing units in structures - Renters - 2 (%)
Housing units in structures - Renters - 3 or 4 (%)
Housing units in structures - Renters - 5 to 9 (%)
Housing units in structures - Renters - 10 to 19 (%)
Housing units in structures - Renters - 20 to 49 (%)
Housing units in structures - Renters - 50 or more (%)
Housing units in structures - Renters - Mobile home (%)
Housing units in structures - Renters - Boat, RV, van, etc. (%)
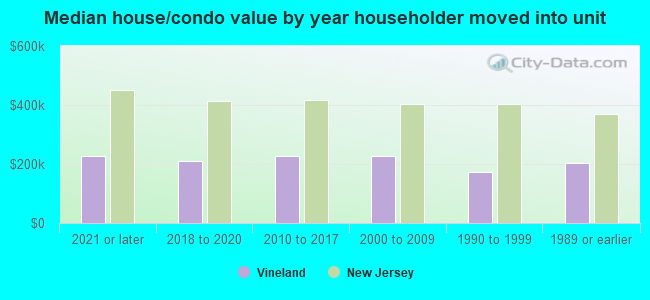
House/condo owner moved in on average (years ago)
Renter moved in on average (years ago)
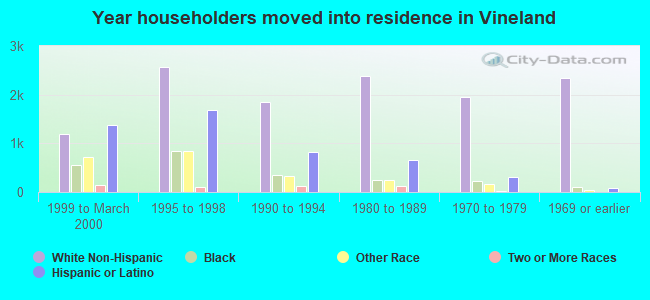
Year householder moved into unit - Moved in 1999 to March 2000 (%)
Year householder moved into unit - Moved in 1999 to March 2000 (%) - White
Year householder moved into unit - Moved in 1999 to March 2000 (%) - Black or African American
Year householder moved into unit - Moved in 1999 to March 2000 (%) - Asian
Year householder moved into unit - Moved in 1999 to March 2000 (%) - Hispanic or Latino
Year householder moved into unit - Moved in 1999 to March 2000 (%) - American Indian and Alaska Native
Year householder moved into unit - Moved in 1999 to March 2000 (%) - Multirace
Year householder moved into unit - Moved in 1999 to March 2000 (%) - Other Race
Year householder moved into unit - Moved in 1995 to 1998 (%)
Year householder moved into unit - Moved in 1995 to 1998 (%) - White
Year householder moved into unit - Moved in 1995 to 1998 (%) - Black or African American
Year householder moved into unit - Moved in 1995 to 1998 (%) - Asian
Year householder moved into unit - Moved in 1995 to 1998 (%) - Hispanic or Latino
Year householder moved into unit - Moved in 1995 to 1998 (%) - American Indian and Alaska Native
Year householder moved into unit - Moved in 1995 to 1998 (%) - Multirace
Year householder moved into unit - Moved in 1995 to 1998 (%) - Other Race
Year householder moved into unit - Moved in 1990 to 1994 (%)
Year householder moved into unit - Moved in 1990 to 1994 (%) - White
Year householder moved into unit - Moved in 1990 to 1994 (%) - Black or African American
Year householder moved into unit - Moved in 1990 to 1994 (%) - Asian
Year householder moved into unit - Moved in 1990 to 1994 (%) - Hispanic or Latino
Year householder moved into unit - Moved in 1990 to 1994 (%) - American Indian and Alaska Native
Year householder moved into unit - Moved in 1990 to 1994 (%) - Multirace
Year householder moved into unit - Moved in 1990 to 1994 (%) - Other Race
Year householder moved into unit - Moved in 1980 to 1989 (%)
Year householder moved into unit - Moved in 1980 to 1989 (%) - White
Year householder moved into unit - Moved in 1980 to 1989 (%) - Black or African American
Year householder moved into unit - Moved in 1980 to 1989 (%) - Asian
Year householder moved into unit - Moved in 1980 to 1989 (%) - Hispanic or Latino
Year householder moved into unit - Moved in 1980 to 1989 (%) - American Indian and Alaska Native
Year householder moved into unit - Moved in 1980 to 1989 (%) - Multirace
Year householder moved into unit - Moved in 1980 to 1989 (%) - Other Race
Year householder moved into unit - Moved in 1970 to 1979 (%)
Year householder moved into unit - Moved in 1970 to 1979 (%) - White
Year householder moved into unit - Moved in 1970 to 1979 (%) - Black or African American
Year householder moved into unit - Moved in 1970 to 1979 (%) - Asian
Year householder moved into unit - Moved in 1970 to 1979 (%) - Hispanic or Latino
Year householder moved into unit - Moved in 1970 to 1979 (%) - American Indian and Alaska Native
Year householder moved into unit - Moved in 1970 to 1979 (%) - Multirace
Year householder moved into unit - Moved in 1970 to 1979 (%) - Other Race
Year householder moved into unit - Moved in 1969 or earlier (%)
Year householder moved into unit - Moved in 1969 or earlier (%) - White
Year householder moved into unit - Moved in 1969 or earlier (%) - Black or African American
Year householder moved into unit - Moved in 1969 or earlier (%) - Asian
Year householder moved into unit - Moved in 1969 or earlier (%) - Hispanic or Latino
Year householder moved into unit - Moved in 1969 or earlier (%) - American Indian and Alaska Native
Year householder moved into unit - Moved in 1969 or earlier (%) - Multirace
Year householder moved into unit - Moved in 1969 or earlier (%) - Other Race
Housing units lacking complete plumbing facilities (%)
Housing units lacking complete kitchen facilities (%)
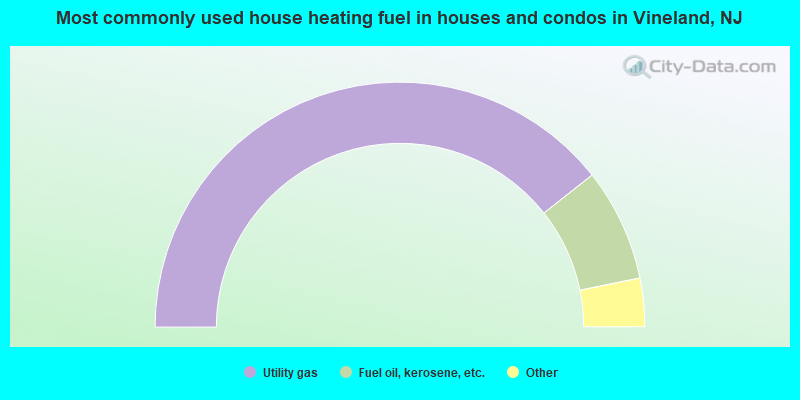
House heating fuel used in houses and condos - Utility gas (%)
House heating fuel used in houses and condos - Bottled, tank, or LP gas (%)
House heating fuel used in houses and condos - Electricity (%)
House heating fuel used in houses and condos - Fuel oil, kerosene, etc. (%)
House heating fuel used in houses and condos - Coal or coke (%)
House heating fuel used in houses and condos - Wood (%)
House heating fuel used in houses and condos - Solar energy (%)
House heating fuel used in houses and condos - Other fuel (%)
House heating fuel used in houses and condos - No fuel used (%)
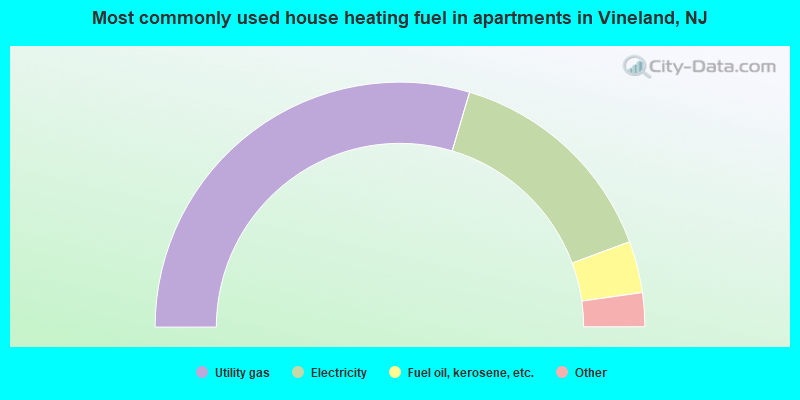
House heating fuel used in apartments - Utility gas (%)
House heating fuel used in apartments - Bottled, tank, or LP gas (%)
House heating fuel used in apartments - Electricity (%)
House heating fuel used in apartments - Fuel oil, kerosene, etc. (%)
House heating fuel used in apartments - Coal or coke (%)
House heating fuel used in apartments - Wood (%)
House heating fuel used in apartments - Solar energy (%)
House heating fuel used in apartments - Other fuel (%)
House heating fuel used in apartments - No fuel used (%)
Latest news about housing in Vineland, NJ collected exclusively by city-data.com from local newspapers, TV, and radio stations
Median year house/condo built: 1972Median year apartment built: 1975Household type by relationship:
Households: 59,912
Male householders: 9,489 (2,092 living alone ), Female householders: 11,769 (2,818 living alone )9,862 spouses (9,764 opposite-sex spouses ), 2,148 unmarried partners , (2,111 opposite-sex unmarried partners ), 18,483 children (17,134 natural , 178 adopted , 1,170 stepchildren ), 2,312 grandchildren , 758 brothers or sisters , 967 parents , 0 foster children , 1,767 other relatives , 705 non-relatives In group quarters: 1,646
Size of family households: 6,073 2-persons , 3,588 3-persons , 3,880 4-persons , 1,398 5-persons , 520 6-persons , 568 7-or-more-persons .
Size of nonfamily households: 4,961 1-person , 1,632 2-persons , 45 3-persons .
8,016 married couples with children. single-parent households (1,426 men , 2,134 women ).
63.6% of residents of Vineland speak English at home. of residents speak Spanish at home (54% speak English very well , 19% speak English well , 18% speak English not well , 8% don't speak English at all ).of residents speak other Indo-European language at home (63% speak English very well , 25% speak English well , 12% speak English not well ).of residents speak Asian or Pacific Island language at home (15% speak English very well , 73% speak English well , 12% speak English not well ).of residents speak other language at home (63% speak English very well , 19% speak English well , 13% speak English not well , 5% don't speak English at all ).
Foreign born population: 7,534 (12.6%)of them are naturalized citizens )
Median number of rooms in houses and condos:
Median number of rooms in apartments
Owner-occupied Renter-occupied
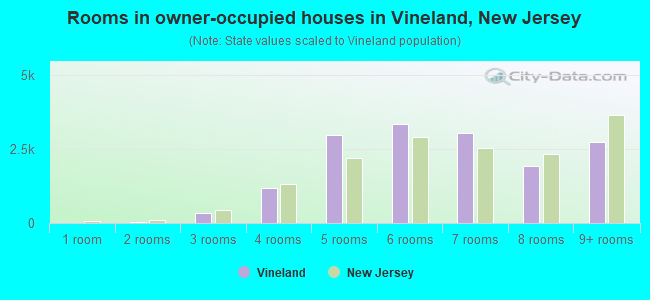
Rooms in owner-occupied houses in Vineland, New Jersey
0 1 room 33 2 rooms 348 3 rooms 1,166 4 rooms 2,963 5 rooms 3,336 6 rooms 3,032 7 rooms 1,918 8 rooms 2,719 9+ rooms
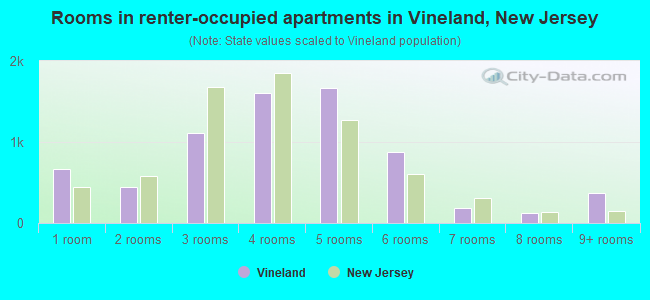
Rooms in renter-occupied apartments in Vineland, New Jersey
665 1 room 445 2 rooms 1,109 3 rooms 1,600 4 rooms 1,663 5 rooms 878 6 rooms 181 7 rooms 120 8 rooms 370 9+ rooms
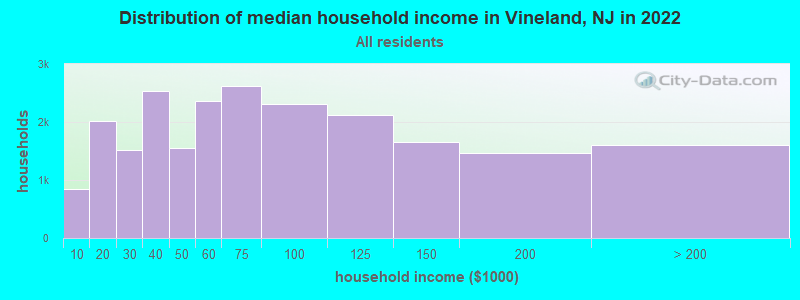
Vineland, NJ household income distribution 847 Less than $10,0002,014 $10,000 to $19,9991,512 $20,000 to $29,9992,532 $30,000 to $39,9991,556 $40,000 to $49,9992,359 $50,000 to $59,9992,629 $60,000 to $74,9992,311 $75,000 to $99,9992,119 $100,000 to $124,9991,648 $125,000 to $149,9991,469 $150,000 to $199,9991,604 $200,000 or more
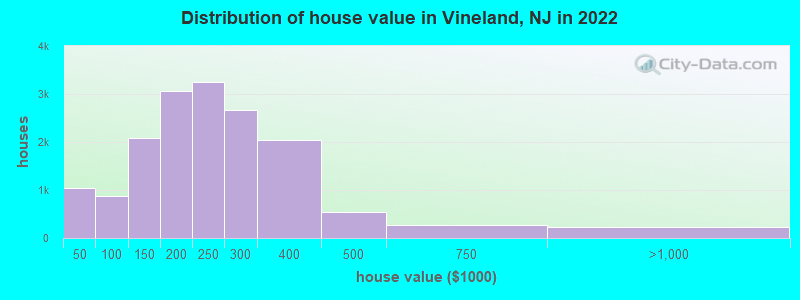
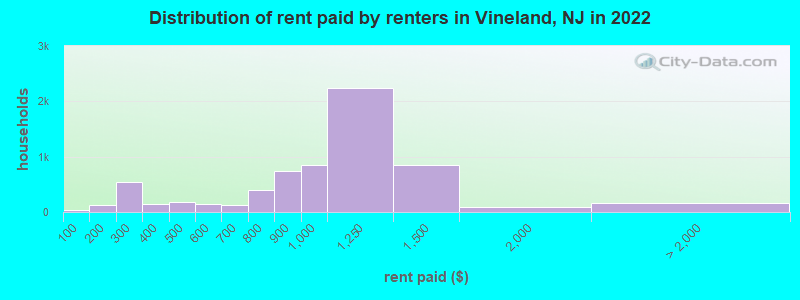
Home value of owner - occupied houses in 2022 in Vineland, NJ 186 Less than $10,000192 $10,000 to $14,99936 $15,000 to $19,999118 $20,000 to $24,999253 $25,000 to $29,99967 $30,000 to $34,99987 $35,000 to $39,99998 $40,000 to $49,99928 $50,000 to $59,99983 $60,000 to $69,999143 $70,000 to $79,999129 $80,000 to $89,999385 $90,000 to $99,999855 $100,000 to $124,9991,235 $125,000 to $149,9992,096 $150,000 to $174,999956 $175,000 to $199,9993,242 $200,000 to $249,9992,658 $250,000 to $299,9992,034 $300,000 to $399,999550 $400,000 to $499,999263 $500,000 to $749,999180 $750,000 to $999,99911 $1,000,000 to $1,499,99936 $2,000,000 or moreRent paid by renters in 2022 in Vineland, NJ 33 Less than $1007 $100 to $149114 $150 to $199155 $200 to $249381 $250 to $29966 $300 to $34986 $350 to $399140 $400 to $44936 $450 to $499107 $500 to $54939 $550 to $59989 $600 to $64935 $650 to $699212 $700 to $749191 $750 to $799741 $800 to $899842 $900 to $9992,245 $1,000 to $1,249851 $1,250 to $1,49997 $1,500 to $1,99923 $2,000 to $2,499144 No cash rent
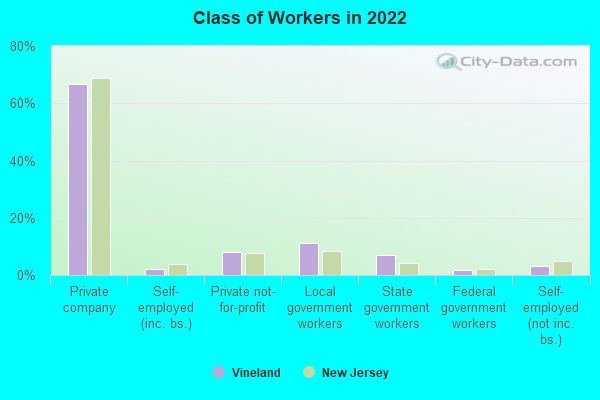
Percentage of workers working in this county: 68.7%Number of people working at home: 1,528 (5.9% of all workers )
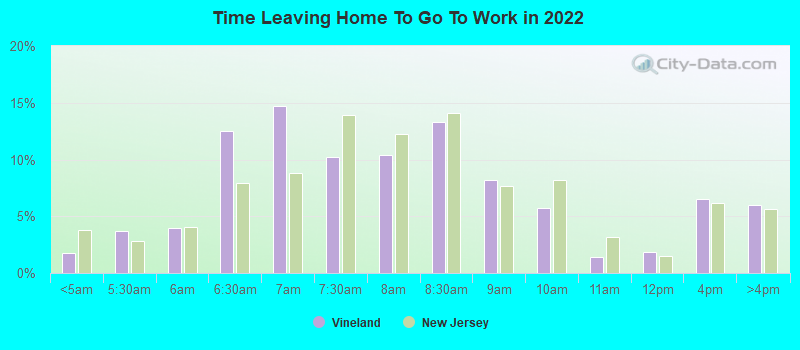
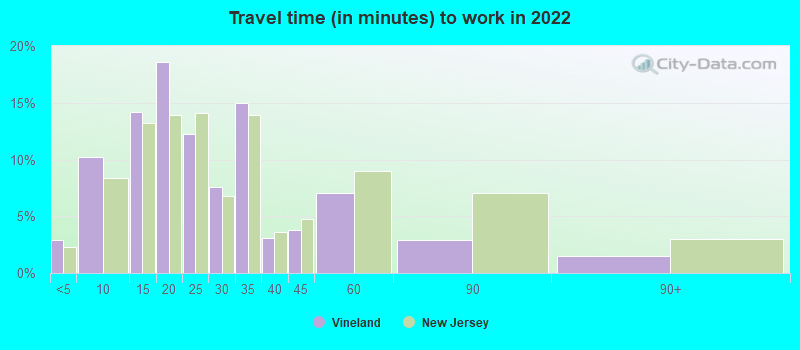
Travel time to work (commute)
Less than 5 minutes: 1,1245 to 9 minutes: 2,89710 to 14 minutes: 3,52115 to 19 minutes: 5,02720 to 24 minutes: 2,15225 to 29 minutes: 1,40430 to 34 minutes: 3,23535 to 39 minutes: 72840 to 44 minutes: 29645 to 59 minutes: 1,59060 to 89 minutes: 1,34090 or more minutes: 584
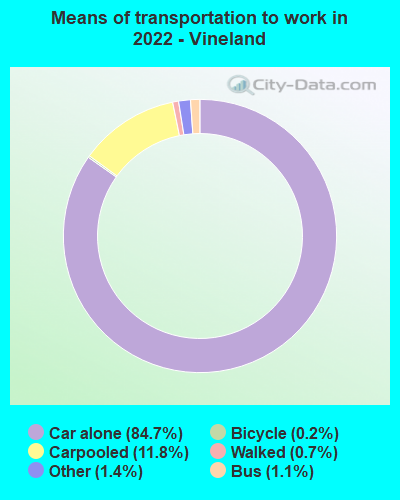
Means of transportation to work:
Drove a car alone: 24,295 (76.2%)Carpooled: 3,898 (12.2%)Bus : 314 (1.0%)Long-distance train or commuter rail : 16 (0.1%)Ferryboat: 29 (0.1%)Taxi: 454 (1.4%)Bicycle: 56 (0.2%)Walked: 234 (0.7%)Worked at home: 1,528 (4.8%)
Unemployment by race in 2022
Unemployment rate for White non-Hispanic residents 7.9% Males5.0% FemalesUnemployment rate for Black residents 2.5% Males10.4% FemalesUnemployment rate for Asian residents 3.7% FemalesUnemployment rate for other race residents 0.9% Males7.6% FemalesUnemployment rate for two or more race residents 25.6% Males13.3% FemalesUnemployment rate for Hispanic or Latino residents 8.7% Males10.6% Females
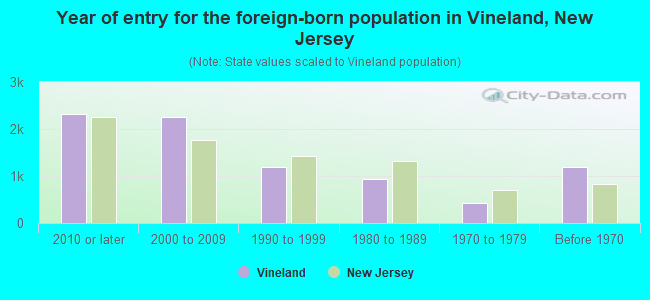
Year of entry for the foreign-born population in Vineland, New Jersey
2,314 2010 or later 2,249 2000 to 2009 1,201 1990 to 1999 928 1980 to 1989 425 1970 to 1979 1,192 Before 1970
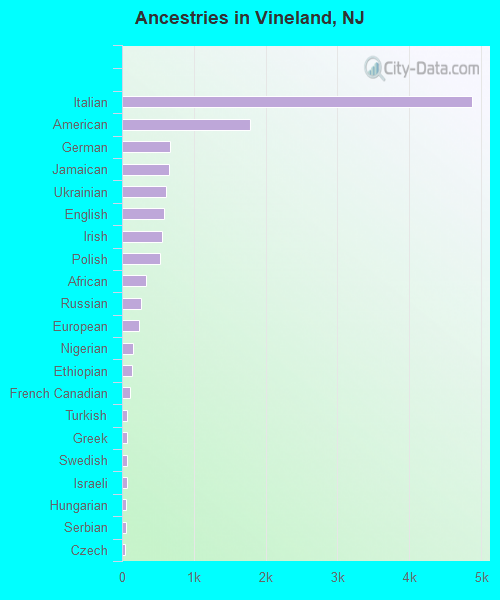
First ancestries reported:
Italian: 4,867 (14.6%)
American: 1,779 (5.3%)
German: 663 (2.0%)
Jamaican: 655 (2.0%)
Ukrainian: 608 (1.8%)
English: 586 (1.8%)
Irish: 559 (1.7%)
Polish: 527 (1.6%)
African: 335 (1.0%)
Russian: 268 (0.8%)
European: 236 (0.7%)
Nigerian: 154 (0.5%)
Ethiopian: 139 (0.4%)
French Canadian: 117 (0.4%)
Turkish: 72 (0.2%)
Greek: 69 (0.2%)
Swedish: 68 (0.2%)
Israeli: 65 (0.2%)
Hungarian: 53 (0.2%)
Serbian: 51 (0.2%)
Czech: 45 (0.1%)
French: 43 (0.1%)
Bermudan: 43 (0.1%)
Welsh: 42 (0.1%)
Scotch-Irish: 41 (0.1%)
Trinidadian and Tobagonian: 41 (0.1%)
British: 35 (0.1%)
Arab: 25 (0.07%)
Brazilian: 22 (0.07%)
Danish: 19 (0.06%)
Northern European: 18 (0.05%)
Lithuanian: 17 (0.05%)
Austrian: 16 (0.05%)
Norwegian: 13 (0.04%)
Eastern European: 10 (0.03%)
Scottish: 9 (0.03%)
Pennsylvania German: 8 (0.02%)
Iranian: 8 (0.02%)
Latvian: 5 (0.01%) Most common places of birth for foreign-born residents (%): Mexico Vineland:
31.5% (2,269)New Jersey:
4.8% (102,527)
Ukraine Vineland:
7.9% (566)New Jersey:
1.1% (22,760)
Dominican Republic Vineland:
7.2% (517)New Jersey:
9.7% (209,055)
Jamaica Vineland:
6.8% (486)New Jersey:
2.2% (47,365)
El Salvador Vineland:
5.2% (374)New Jersey:
2.3% (48,885)
Ecuador Vineland:
4.5% (327)New Jersey:
4.4% (95,275)
India Vineland:
4.3% (308)New Jersey:
12.8% (274,609)
Russia Vineland:
3.9% (279)New Jersey:
0.9% (20,371)
Germany Vineland:
3.5% (249)New Jersey:
0.8% (17,217)
Philippines Vineland:
2.5% (182)New Jersey:
4.0% (85,934)
Nigeria Vineland:
2.4% (176)New Jersey:
1.2% (25,213)
Colombia Vineland:
2.4% (171)New Jersey:
4.2% (90,817)
Poland Vineland:
2.1% (151)New Jersey:
2.3% (48,811)
Guatemala Vineland:
1.6% (112)New Jersey:
2.2% (46,813)
Place of birth for U.S.-born residents:
This state: 36,809Other state: 8,702Northeast: 5,806Midwest: 239South: 1,741West: 1,046 89.8% of Vineland residents lived in the same house 1 years ago.
Out of people who lived in different houses, 34.7% lived in this county.
Out of people who lived in different counties, 68.0% lived in New Jersey.
Vineland:
89.8%State average:
90.4%
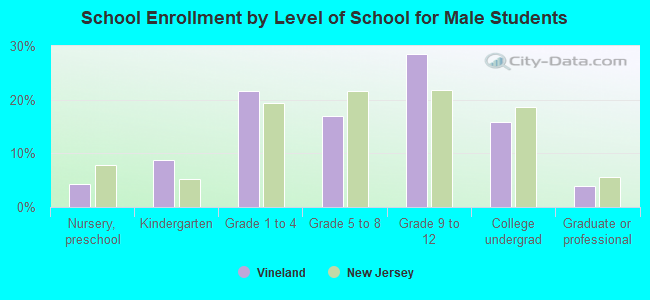
Education attainment for males 25 years and older:
No schooling: 1,116Nursery to 4th grade: 4695th and 6th grade: 4037th and 8th grade: 5119th grade: 13310th grade: 42411th grade: 35212th grade, no diploma: 609High school graduate (or equivalency): 6,448Less than 1 year of college: 1,032Some college more than 1 year, no degree: 1,936Associate degree: 2,287Bachelor's degree: 2,591Master's degree: 661Professional school degree: 287Doctorate degree: 221
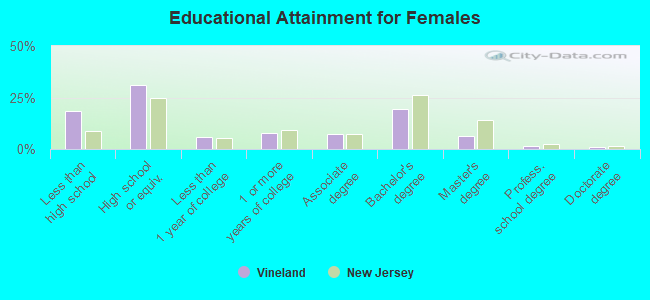
Education attainment for females 25 years and older:
No schooling: 925Nursery to 4th grade: 2815th and 6th grade: 7587th and 8th grade: 5529th grade: 18810th grade: 51011th grade: 33312th grade, no diploma: 517High school graduate (or equivalency): 6,808Less than 1 year of college: 1,317Some college more than 1 year, no degree: 1,738Associate degree: 1,616Bachelor's degree: 4,276Master's degree: 1,406Professional school degree: 362Doctorate degree: 232
Housing units in structures:
One, detached: 15,284One, attached: 965Two: 1,2553 or 4: 9875 to 9: 65310 to 19: 48620 to 49: 48050 or more: 1,273Mobile homes: 1,476Median worth of mobile homes: $53,263
Housing units lacking complete plumbing facilities in 2022: 0.8%Housing units lacking complete kitchen facilities in 2022: 1.6%House/condo owner moved in on average 10 years ago
Renter moved in on average 8 years ago
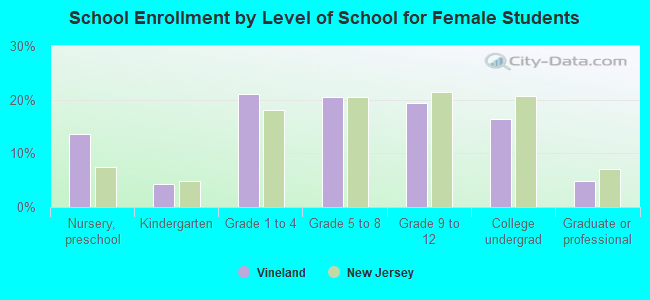
Private vs. public school enrollment:
Students in private schools in grades 1 to 8 (elementary and middle school): 763 Here:
11.8%New Jersey:
12.3%
Students in private schools in grades 9 to 12 (high school): 394 Here:
11.1%New Jersey:
13.1%
Students in private undergraduate colleges: 873 Here:
32.8%New Jersey:
33.2%