Waimalu, HI (Hawaii) Houses and Residents
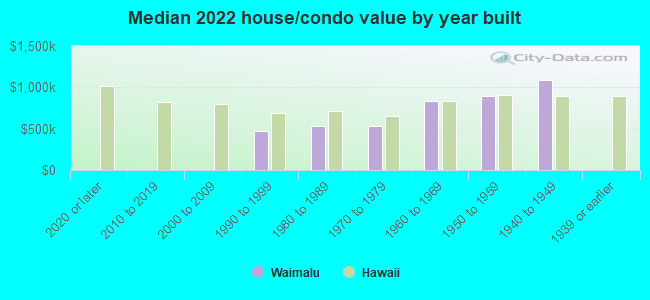
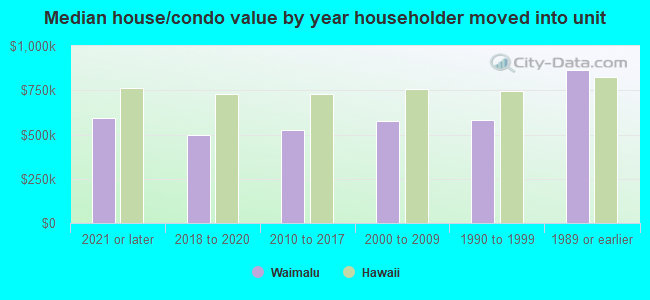
| Waimalu: | $581,003 |
| Hawaii: | $820,100 |
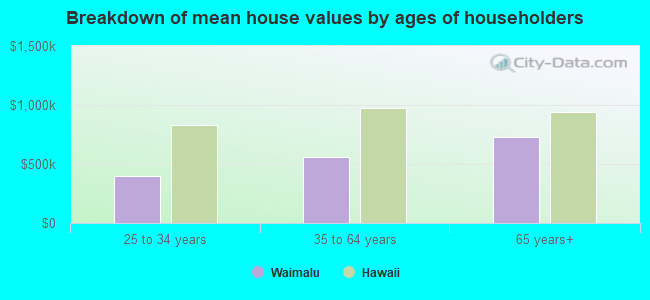
Mean price in 2022:
Detached houses: $1,148,381
Here: $1,148,381 State: $1,035,348 Townhouses or other attached units: $628,287
Here: $628,287 State: $976,474 In 2-unit structures: $582,732
Here: $582,732 State: $928,739 In 3-to-4-unit structures: $848,150
Here: $848,150 State: $758,960 In 5-or-more-unit structures: $436,196
Here: $436,196 State: $584,974
Total population: 13,730 (All urban)
Houses: 6,161 (5,828 occupied: 3,716 owner occupied, 2,130 renter occupied)
| % of renters here: | 36% |
| State: | 37% |
Housing density: 1,043 houses/condos per square mile
Median price asked for vacant for-sale houses and condos in 2022: $787,825.
Median contract rent in 2022: $1,652 (lower quartile is $1,343, upper quartile is over $2,000)
Median rent asked for vacant for-rent units in 2022: $1,510
Median gross rent in Waimalu, HI in 2022: $1,795
Housing units in Waimalu with a mortgage: 2,301 (411 second mortgage, 56 home equity loan, 319 both second mortgage and home equity loan)
Houses without a mortgage: 118
Median household income for houses/condos with a mortgage: $105,232
Median household income for apartments without a mortgage: $72,629
Median monthly housing costs: $1,790
Compare current foreclosures near Waimalu, HI:
| Photo | Address | Area | Beds / Baths | Price | Details |
|---|---|---|---|---|---|

|
#1
Alexander St Apt 503
Honolulu, HI 96826
|
625 sq. feet
|
1 baths 1 beds |
$249,900
|
show details |

|
#2
Richard Ln Apt B613
Honolulu, HI 96819
|
643 sq. feet
|
1 baths 2 beds |
$365,000
|
show details |

|
#3
Victoria St Apt 1002
Honolulu, HI 96822
|
930 sq. feet
|
1 baths 2 beds |
$145,000
|
show details |

|
#4
Palolo Avenue
Honolulu, HI 96816
|
1,162 sq. feet
|
1 baths 3 beds |
$799,000
|
show details |

|
#5
-133 Pupupuhi St Unit
Waipahu, HI 96797
|
1,176 sq. feet
|
3 baths 3 beds |
$515,000
|
show details |

|
#6
343 Ho Owalea Place
Ewa Beach, HI 96706
|
- sq. feet
|
3 baths 4 beds |
$904,800
|
show details |

|
#7
889 Puamaeole St Unit 8a
Ewa Beach, HI 96706
|
- sq. feet
|
2 baths 2 beds |
$468,000
|
show details |

|
#8
S Kukui St Apt D-1003
Honolulu, HI 96813
|
615 sq. feet
|
1 baths 1 beds |
show details | |

|
#9
-140 Kupuohi Pl
Waipahu, HI 96797
|
1,128 sq. feet
|
2 baths 3 beds |
show details | |

|
#10
Pohakupili Pl
Ewa Beach, HI 96706
|
1,468 sq. feet
|
2 baths 3 beds |
show details |
| Photo | Address | Area | Beds / Baths | Price | Details |
|---|---|---|---|---|---|

|
#11
Honomu St
Hauula, HI 96717
|
1,008 sq. feet
|
1 baths 3 beds |
show details | |

|
#12
Queen St Apt 3405
Honolulu, HI 96814
|
1,157 sq. feet
|
2 baths 2 beds |
show details | |

|
#13
Pahu St Apt 44
Waipahu, HI 96797
|
968 sq. feet
|
1 baths 3 beds |
show details | |

|
#14
Kahili St
Kailua, HI 96734
|
1,707 sq. feet
|
2 baths 3 beds |
show details | |

|
#15
Hui Iwa St Apt 2
Kaneohe, HI 96744
|
1,290 sq. feet
|
3 baths 3 beds |
show details | |

|
#16
-720 Puluniu Loop
Aiea, HI 96701
|
- sq. feet
|
3 baths 3 beds |
show details | |

|
#17
Lai Rd
Honolulu, HI 96816
|
2,634 sq. feet
|
3 baths 5 beds |
show details | |

|
#18
Ipulei Pl
Honolulu, HI 96816
|
912 sq. feet
|
1 baths 3 beds |
show details | |

|
#19
Palolo Ave
Honolulu, HI 96816
|
3,916 sq. feet
|
6 baths 10 beds |
show details | |

|
#20
Mahaoo Pl
Honolulu, HI 96819
|
3,453 sq. feet
|
5 baths 8 beds |
show details |
| Photo | Address | Area | Beds / Baths | Price | Details |
|---|---|---|---|---|---|

|
#21
Palolo Ave
Honolulu, HI 96816
|
1,020 sq. feet
|
1 baths 3 beds |
show details | |

|
#22
5th Ave
Honolulu, HI 96816
|
2,260 sq. feet
|
3 baths 5 beds |
show details | |

|
#23
Ala Napuaa Pl Apt 1019
Honolulu, HI 96818
|
587 sq. feet
|
1 baths 1 beds |
show details | |

|
#24
Nihi St
Honolulu, HI 96819
|
964 sq. feet
|
1 baths 4 beds |
show details | |

|
#25
Ehoeho Ave
Wahiawa, HI 96786
|
1,202 sq. feet
|
3 baths 3 beds |
show details | |

|
#26
Pahoa Ave
Honolulu, HI 96816
|
1,812 sq. feet
|
3 baths 4 beds |
show details | |

|
#27
Armstrong St
Honolulu, HI 96822
|
3,390 sq. feet
|
4 baths 6 beds |
show details | |

|
#28
Ala Makahala Pl Apt 903
Honolulu, HI 96818
|
552 sq. feet
|
1 baths 1 beds |
show details | |

|
#29
Ala Lilikoi St
Honolulu, HI 96818
|
4,192 sq. feet
|
4 baths 8 beds |
show details | |

|
#30
Hualani St
Kailua, HI 96734
|
768 sq. feet
|
1 baths 2 beds |
show details |
| Photo | Address | Area | Beds / Baths | Price | Details |
|---|---|---|---|---|---|

|
#31
Ward Ave Apt 407
Honolulu, HI 96822
|
466 sq. feet
|
1 baths 1 beds |
show details | |

|
#32
Sunset Ave
Honolulu, HI 96816
|
2,520 sq. feet
|
3 baths 4 beds |
show details | |

|
#33
Hala Dr
Honolulu, HI 96817
|
1,664 sq. feet
|
4 baths 10 beds |
show details | |

|
#34
Prospect St Apt 2
Honolulu, HI 96822
|
1,799 sq. feet
|
3 baths 3 beds |
show details | |

|
#35
Sierra Dr
Honolulu, HI 96816
|
288 sq. feet
|
3 baths 6 beds |
show details | |

|
#36
11th Ave Apt A
Honolulu, HI 96816
|
2,400 sq. feet
|
3 baths 6 beds |
show details | |

|
#37
Ward Ave Apt 504
Honolulu, HI 96822
|
814 sq. feet
|
1 baths 2 beds |
show details | |

|
#38
Ala Nioi Pl Apt 105
Honolulu, HI 96818
|
904 sq. feet
|
2 baths 3 beds |
show details | |

|
#39
Ulumalu St
Kailua, HI 96734
|
1,024 sq. feet
|
2 baths 3 beds |
show details | |

|
#40
Kama Ln
Honolulu, HI 96817
|
720 sq. feet
|
1 baths 3 beds |
show details |
| Photo | Address | Area | Beds / Baths | Price | Details |
|---|---|---|---|---|---|

|
#41
Alohea Ave
Honolulu, HI 96816
|
836 sq. feet
|
1 baths 2 beds |
show details | |

|
#42
Esther St
Honolulu, HI 96815
|
1,048 sq. feet
|
2 baths 3 beds |
show details | |

|
#43
Ala Ilima St Apt 211
Honolulu, HI 96818
|
704 sq. feet
|
1 baths 2 beds |
show details | |

|
#44
Liliuokalani Ave Apt 503
Honolulu, HI 96815
|
888 sq. feet
|
2 baths 2 beds |
show details | |

|
#45
Moani St
Honolulu, HI 96819
|
2,588 sq. feet
|
3 baths 3 beds |
show details | |

|
#46
Kanekopa Pl
Honolulu, HI 96816
|
1,710 sq. feet
|
3 baths 3 beds |
show details | |

|
#47
Mcneill St Apt 317
Honolulu, HI 96817
|
585 sq. feet
|
1 baths 2 beds |
show details | |

|
#48
Date St Apt 7c
Honolulu, HI 96816
|
704 sq. feet
|
2 baths 2 beds |
show details | |

|
#49
Piikoi St Apt 1307
Honolulu, HI 96814
|
1,018 sq. feet
|
2 baths 2 beds |
show details | |

|
Check over 1 million property listings on Foreclosure.com!
|
browse all offers | |||

Latest news about housing in Waimalu, HI collected exclusively by city-data.com from local newspapers, TV, and radio stations

 | Looking into buying my first apartment. Asking for advice (28 replies) |
| A Serious Horn Honking Question (30 replies) |
| Moving to Aiea, HI (15 replies) |

Median year apartment built: 1975
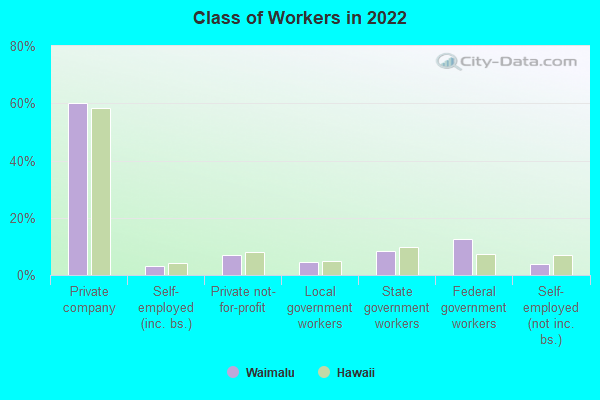
Household type by relationship:
Households: 13,732- Male householders: 3,066 (1,189 living alone), Female householders: 2,616 (797 living alone)
2,475 spouses (2,444 opposite-sex spouses), 300 unmarried partners, (251 opposite-sex unmarried partners), 3,157 children (3,148 natural, 0 adopted, 8 stepchildren), 446 grandchildren, 173 brothers or sisters, 273 parents, 0 foster children, 488 other relatives, 716 non-relatives
- In group quarters: 18
Size of family households: 1,893 2-persons, 493 3-persons, 580 4-persons, 300 5-persons, 114 6-persons, 88 7-or-more-persons.
Size of nonfamily households: 2,104 1-person, 232 2-persons, 46 3-persons, 29 4-persons.
1,313 married couples with children.
357 single-parent households (55 men, 302 women).
75.5% of residents of Waimalu speak English at home.
2.1% of residents speak Spanish at home (77% speak English very well, 21% speak English well, 2% speak English not well).
1.2% of residents speak other Indo-European language at home (71% speak English very well, 7% speak English well, 22% speak English not well).
21.0% of residents speak Asian or Pacific Island language at home (49% speak English very well, 36% speak English well, 14% speak English not well, 1% don't speak English at all).
Foreign born population: 2,567 (18.7%)
(63.7% of them are naturalized citizens)
| Here: | 4.4 |
| State: | 5.5 |
| Here: | 3.5 |
| State: | 3.9 |
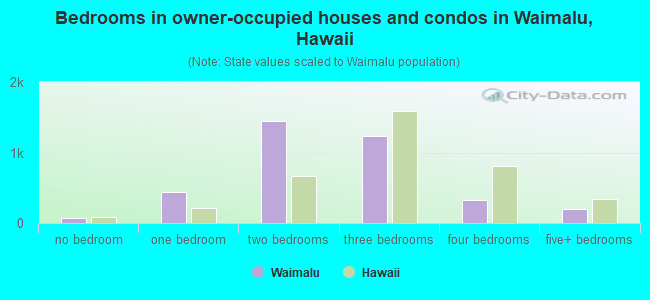
- Bedrooms in owner-occupied houses and condos in Waimalu, Hawaii
- 73no bedroom
- 4421 bedroom
- 1,4402 bedrooms
- 1,2403 bedrooms
- 3284 bedrooms
- 1935+ bedrooms
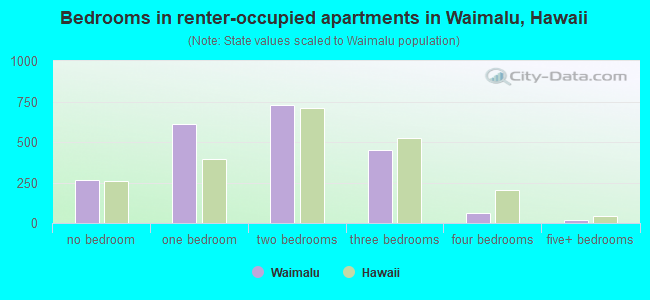
- Bedrooms in renter-occupied apartments in Waimalu, Hawaii
- 268no bedroom
- 6091 bedroom
- 7272 bedrooms
- 4493 bedrooms
- 604 bedrooms
- 185+ bedrooms
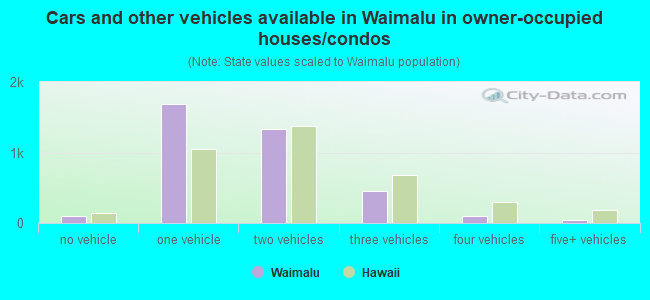
- Cars and other vehicles available in Waimalu in owner-occupied houses/condos
- 106no vehicle
- 1,6901 vehicle
- 1,3342 vehicles
- 4493 vehicles
- 934 vehicles
- 445+ vehicles
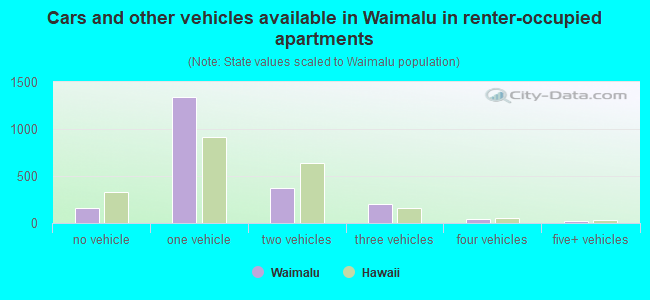
- Cars and other vehicles available in Waimalu in renter-occupied apartments
- 157no vehicle
- 1,3401 vehicle
- 3702 vehicles
- 1973 vehicles
- 464 vehicles
- 215+ vehicles
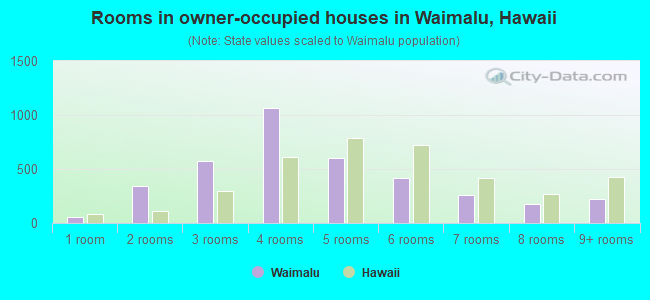
- Rooms in owner-occupied houses in Waimalu, Hawaii
- 581 room
- 3432 rooms
- 5713 rooms
- 1,0654 rooms
- 6025 rooms
- 4156 rooms
- 2637 rooms
- 1758 rooms
- 2249+ rooms
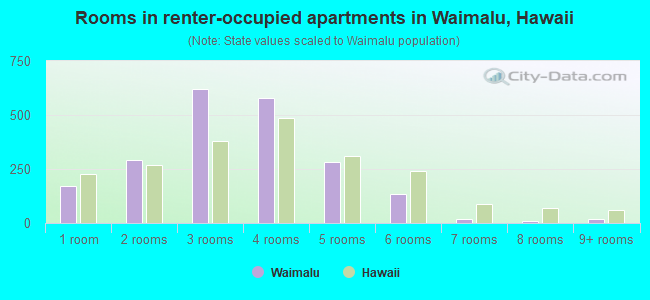
- Rooms in renter-occupied apartments in Waimalu, Hawaii
- 1731 room
- 2902 rooms
- 6223 rooms
- 5814 rooms
- 2815 rooms
- 1356 rooms
- 197 rooms
- 118 rooms
- 189+ rooms
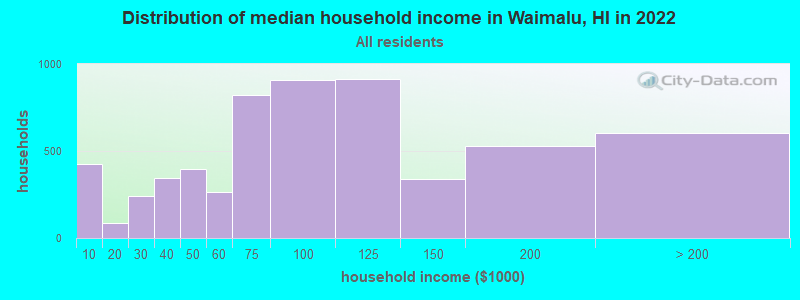
Waimalu, HI household income distribution

- 427Less than $10,000
- 84$10,000 to $19,999
- 243$20,000 to $29,999
- 345$30,000 to $39,999
- 398$40,000 to $49,999
- 265$50,000 to $59,999
- 824$60,000 to $74,999
- 909$75,000 to $99,999
- 916$100,000 to $124,999
- 341$125,000 to $149,999
- 526$150,000 to $199,999
- 606$200,000 or more
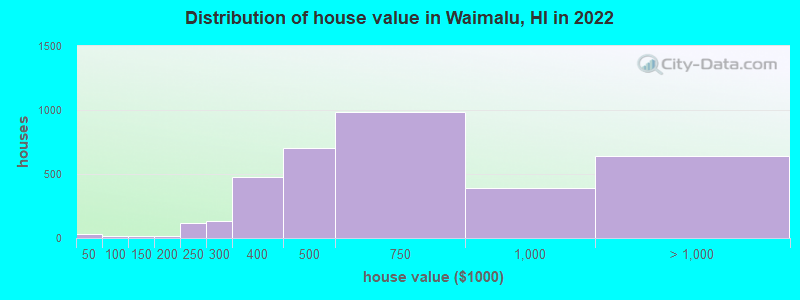
Home value of owner - occupied houses in 2022 in Waimalu, HI
-
- 16$20,000 to $24,999
- 12$40,000 to $49,999
- 11$100,000 to $124,999
- 5$125,000 to $149,999
- 17$150,000 to $174,999
- 120$200,000 to $249,999
- 133$250,000 to $299,999
- 476$300,000 to $399,999
- 702$400,000 to $499,999
- 982$500,000 to $749,999
- 389$750,000 to $999,999
- 561$1,000,000 to $1,499,999
- 23$1,500,000 to $1,999,999
- 51$2,000,000 or more
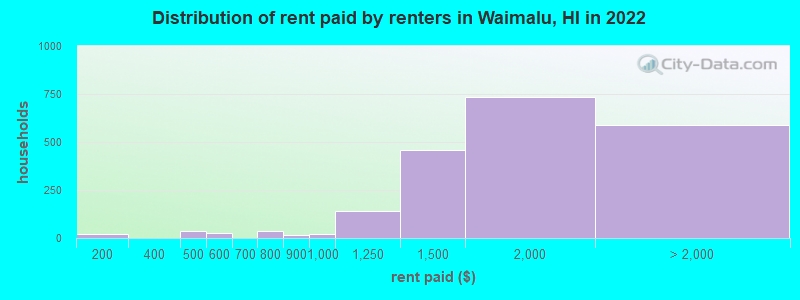
Rent paid by renters in 2022 in Waimalu, HI
-
- 21$150 to $199
- 9$400 to $449
- 25$450 to $499
- 26$500 to $549
- 15$700 to $749
- 23$750 to $799
- 16$800 to $899
- 23$900 to $999
- 140$1,000 to $1,249
- 457$1,250 to $1,499
- 733$1,500 to $1,999
- 437$2,000 to $2,499
- 76$2,500 to $2,999
- 25$3,000 to $3,499
- 40$3,500 or more
- 9No cash rent
Percentage of workers working in this county: 98.7%
Number of people working at home: 617 (8.3% of all workers)
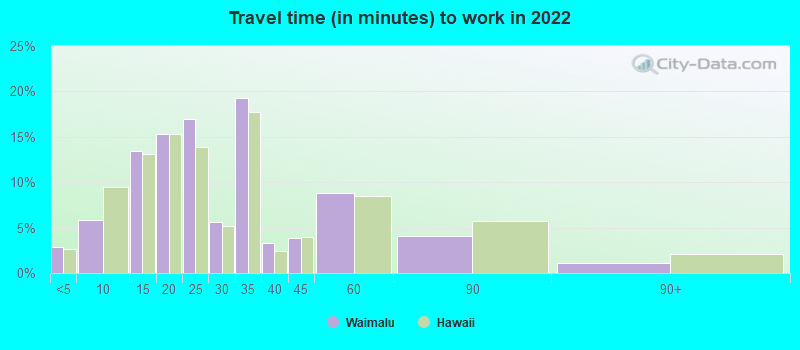
Travel time to work (commute)
- Less than 5 minutes: 185
- 5 to 9 minutes: 207
- 10 to 14 minutes: 1,018
- 15 to 19 minutes: 900
- 20 to 24 minutes: 1,370
- 25 to 29 minutes: 655
- 30 to 34 minutes: 1,342
- 35 to 39 minutes: 79
- 40 to 44 minutes: 267
- 45 to 59 minutes: 515
- 60 to 89 minutes: 215
- 90 or more minutes: 57
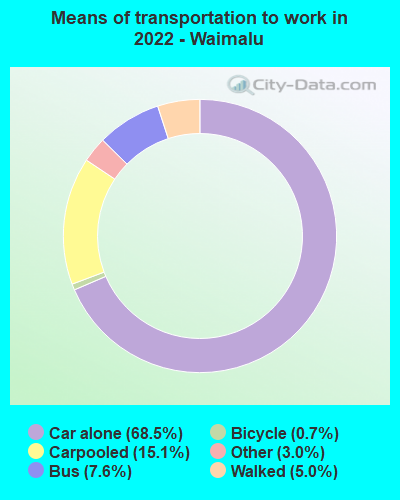
Means of transportation to work:
- Drove a car alone: 4,189 (60.9%)
- Carpooled: 1,059 (15.4%)
- Bus: 399 (5.8%)
- Taxi: 196 (2.8%)
- Bicycle: 52 (0.8%)
- Walked: 344 (5.0%)
- Worked at home: 617 (9.0%)
- Unemployment by race in 2022
- Unemployment rate for White non-Hispanic residents
- 9.9%Females
- Unemployment rate for Asian residents
- 3.1%Males
- 11.2%Females
- Unemployment rate for two or more race residents
- 5.6%Males
- Unemployment rate for Hispanic or Latino residents
- 2.8%Males
- 1.7%Females
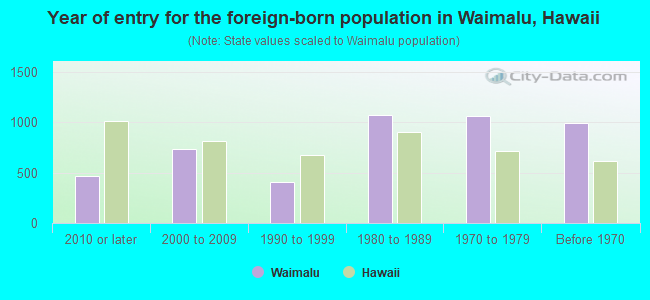
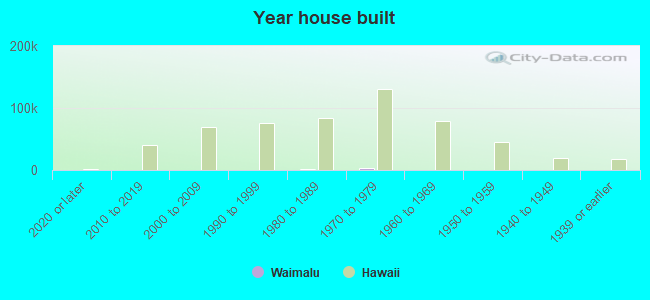
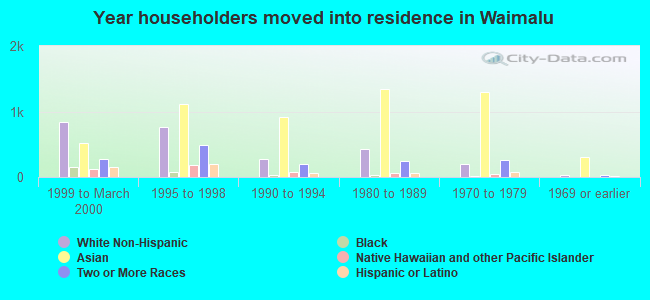
- Year of entry for the foreign-born population in Waimalu, Hawaii
- 4692010 or later
- 7352000 to 2009
- 4111990 to 1999
- 1,0741980 to 1989
- 1,0691970 to 1979
- 999Before 1970
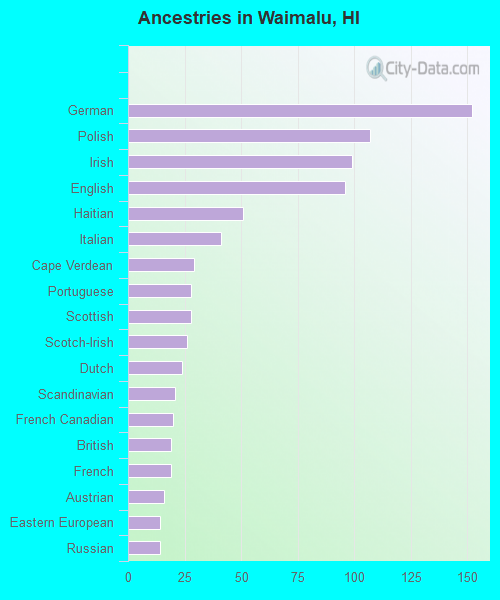
First ancestries reported:
- German: 152 (2.1%)
- Polish: 107 (1.5%)
- Irish: 99 (1.4%)
- English: 96 (1.4%)
- Haitian: 51 (0.7%)
- Italian: 41 (0.6%)
- Cape Verdean: 29 (0.4%)
- Portuguese: 28 (0.4%)
- Scottish: 28 (0.4%)
- Scotch-Irish: 26 (0.4%)
- Dutch: 24 (0.3%)
- Scandinavian: 21 (0.3%)
- French Canadian: 20 (0.3%)
- British: 19 (0.3%)
- French: 19 (0.3%)
- Austrian: 16 (0.2%)
- Eastern European: 14 (0.2%)
- Russian: 14 (0.2%)
Most common places of birth for foreign-born residents (%):
| Waimalu: | 38.2% (1,043) |
| Hawaii: | 44.3% (115,679) |
| Waimalu: | 13.8% (376) |
| Hawaii: | 8.5% (22,321) |
| Waimalu: | 11.1% (304) |
| Hawaii: | 5.9% (15,525) |
| Waimalu: | 6.1% (167) |
| Hawaii: | 7.6% (19,835) |
| Waimalu: | 4.2% (115) |
| Hawaii: | 3.7% (9,622) |
| Waimalu: | 4.1% (112) |
| Hawaii: | 0.4% (1,164) |
| Waimalu: | 3.4% (94) |
| Hawaii: | 3.6% (9,389) |
| Waimalu: | 2.9% (78) |
| Hawaii: | 1.1% (2,843) |
| Waimalu: | 2.4% (66) |
| Hawaii: | 1.0% (2,701) |
| Waimalu: | 2.2% (60) |
| Hawaii: | 1.3% (3,276) |
| Waimalu: | 1.5% (42) |
| Hawaii: | 0.2% (608) |
Place of birth for U.S.-born residents:
- This state: 7,841
- Other state: 2,761
- Northeast: 565
- Midwest: 263
- South: 796
- West: 1,163
85.9% of Waimalu residents lived in the same house 1 years ago.
Out of people who lived in different houses, 38.9% lived in this county.
Out of people who lived in different counties, 6.1% lived in Hawaii.
| Waimalu: | 85.9% |
| State average: | 87.8% |
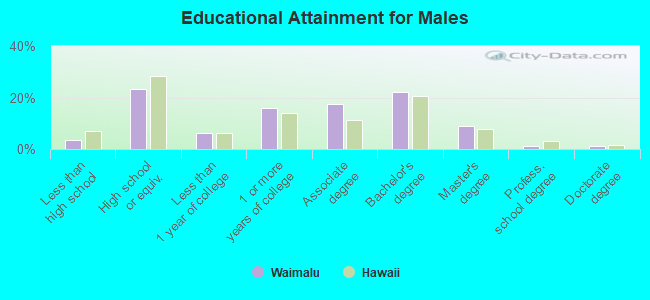
Education attainment for males 25 years and older:
- No schooling: 64
- Nursery to 4th grade: 24
- 5th and 6th grade: 6
- 7th and 8th grade: 12
- 9th grade: 0
- 10th grade: 0
- 11th grade: 0
- 12th grade, no diploma: 84
- High school graduate (or equivalency): 1,217
- Less than 1 year of college: 331
- Some college more than 1 year, no degree: 827
- Associate degree: 910
- Bachelor's degree: 1,151
- Master's degree: 455
- Professional school degree: 67
- Doctorate degree: 55
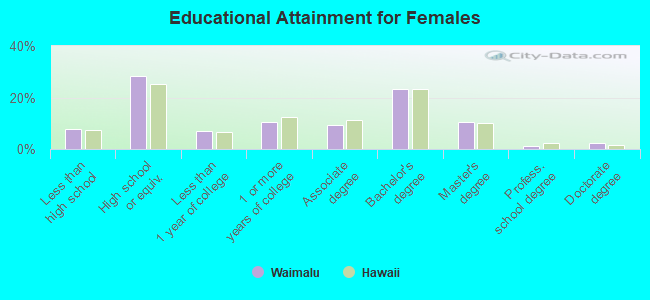
Education attainment for females 25 years and older:
- No schooling: 43
- Nursery to 4th grade: 0
- 5th and 6th grade: 17
- 7th and 8th grade: 21
- 9th grade: 31
- 10th grade: 44
- 11th grade: 79
- 12th grade, no diploma: 164
- High school graduate (or equivalency): 1,444
- Less than 1 year of college: 355
- Some college more than 1 year, no degree: 530
- Associate degree: 466
- Bachelor's degree: 1,189
- Master's degree: 534
- Professional school degree: 64
- Doctorate degree: 117


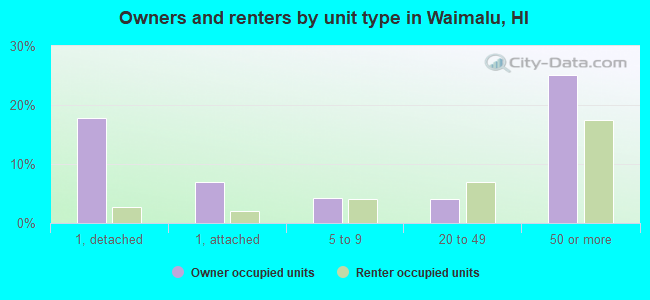
Housing units in structures:
- One, detached: 1,284
- One, attached: 513
- Two: 127
- 3 or 4: 329
- 5 to 9: 499
- 10 to 19: 155
- 20 to 49: 650
- 50 or more: 2,601
House/condo owner moved in on average 13 years ago
Renter moved in on average 1 years ago
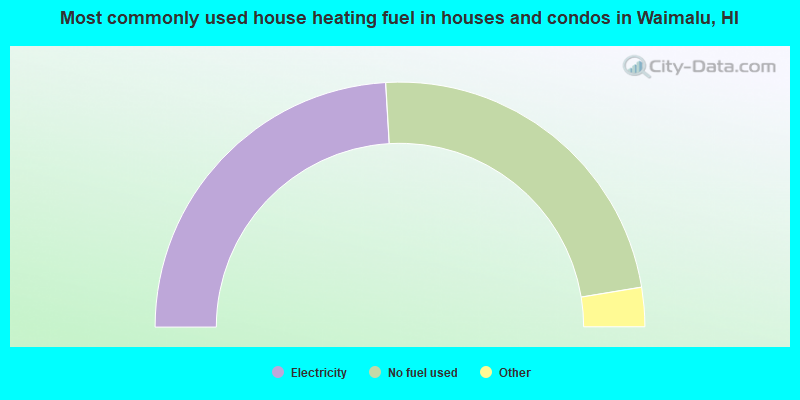
- 48.2%Electricity
- 46.7%No fuel used
- 2.6%Solar energy
- 2.1%Utility gas
- 0.4%Wood
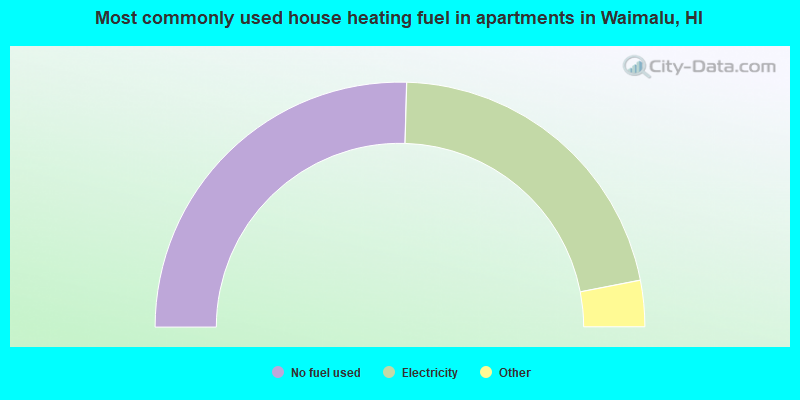
- 50.9%No fuel used
- 43.0%Electricity
- 3.7%Utility gas
- 1.5%Bottled, tank, or LP gas
- 0.7%Other fuel
- 0.2%Solar energy
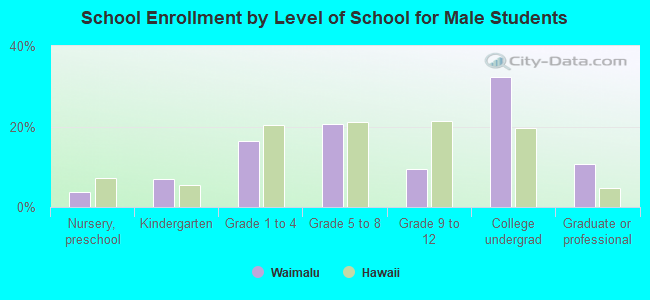
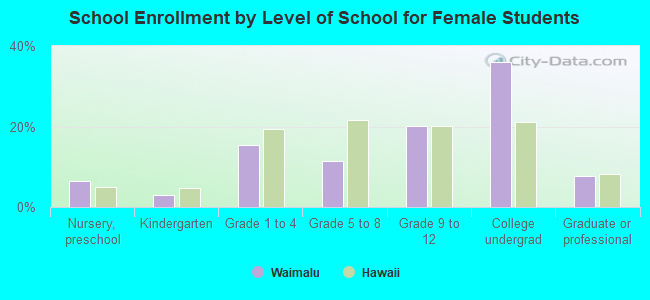
Private vs. public school enrollment:
| Here: | 14.2% |
| Hawaii: | 21.6% |
| Here: | 13.8% |
| Hawaii: | 21.5% |
| Here: | 11.9% |
| Hawaii: | 23.3% |