Median price asked for vacant for-sale houses and condos in 2022 in this county: $180,198.
Median contract rent in 2022: $1,148 (lower quartile is $871, upper quartile is $1,397)
Median rent asked for vacant for-rent units in 2022: $1,257
Median gross rent in Warren, VT in 2022: $1,285
Housing units in Warren with a mortgage: 230 (16 second mortgage, 30 home equity loan, 0 both second mortgage and home equity loan) Houses without a mortgage: 92
In family households: 44,925 (10,236 male householders, 5,174 female householders)
11,786 spouses, 14,562 children (13,477 natural, 504 adopted, 581 stepchildren), 526 grandchildren, 264 brothers or sisters, 303 parents, foster children, 273 other relatives, 1,568 non-relatives
In nonfamily households: 12,199 (4,472 male householders (3,272 living alone)), 5,145 female householders (4,165 living alone)), 2,582 nonrelatives
In group quarters: 2,410 (437 institutionalized population)
9,632 married couples with children.
3,248 single-parent households (829 men, 2,419 women).
94.8% of residents of Warren speak English at home.
3.0% of residents speak Spanish at home (75% speak English very well, 25% speak English well).
1.7% of residents speak other Indo-European language at home (81% speak English very well, 4% speak English well, 15% speak English not well).
0.2% of residents speak Asian or Pacific Island language at home (33% speak English well, 67% speak English not well).
0.3% of residents speak other language at home (60% speak English very well, 40% speak English well).
Foreign born population: 102 (5.5%)
(66.7% of them are naturalized citizens)
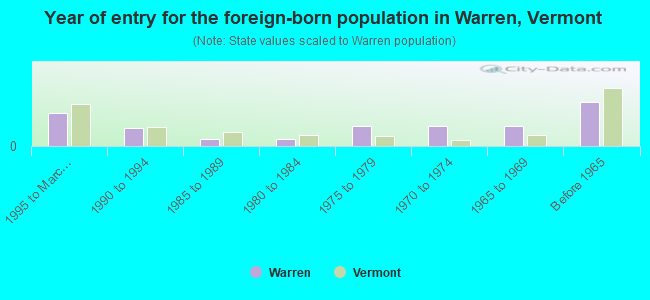
Year of entry for the foreign-born population in Warren, Vermont
181995 to March 2000
101990 to 1994
41985 to 1989
41980 to 1984
111975 to 1979
111970 to 1974
111965 to 1969
24Before 1965
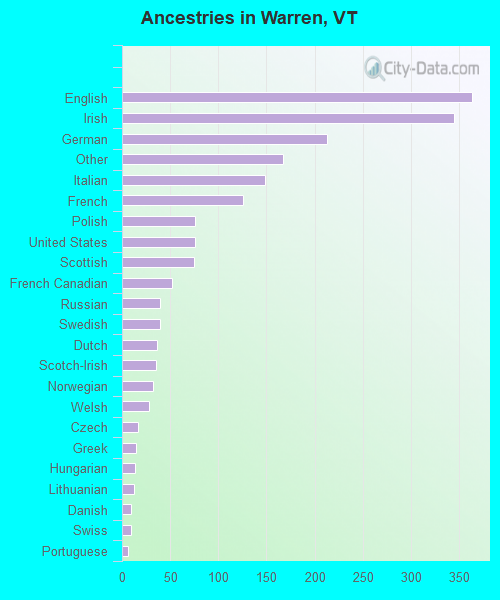
First ancestries reported:
English: 363 (18.7%)
Irish: 345 (17.8%)
German: 213 (11.0%)
Other: 167 (8.6%)
Italian: 148 (7.6%)
French: 126 (6.5%)
Polish: 76 (3.9%)
United States: 76 (3.9%)
Scottish: 75 (3.9%)
French Canadian: 52 (2.7%)
Russian: 39 (2.0%)
Swedish: 39 (2.0%)
Dutch: 36 (1.9%)
Scotch-Irish: 35 (1.8%)
Norwegian: 32 (1.7%)
Welsh: 28 (1.4%)
Czech: 17 (0.9%)
Greek: 15 (0.8%)
Hungarian: 13 (0.7%)
Lithuanian: 12 (0.6%)
Danish: 9 (0.5%)
Swiss: 9 (0.5%)
Portuguese: 6 (0.3%)
Subsaharan African: 3 (0.2%)
West Indian: 3 (0.2%)
Most common places of birth for foreign-born residents (%):
United Kingdom
Warren:
36.6% (34)
Vermont:
7.5% (1,744)
Canada
Warren:
11.8% (11)
Vermont:
34.0% (7,912)
Germany
Warren:
7.5% (7)
Vermont:
7.2% (1,669)
Russia
Warren:
6.5% (6)
Vermont:
1.1% (263)
Other Eastern Europe
Warren:
4.3% (4)
Vermont:
1.6% (372)
Other Northern Europe
Warren:
3.2% (3)
Vermont:
1.2% (268)
Austria
Warren:
3.2% (3)
Vermont:
0.8% (191)
Greece
Warren:
3.2% (3)
Vermont:
0.6% (144)
Other Eastern Africa
Warren:
3.2% (3)
Vermont:
0.5% (106)
Australia
Warren:
3.2% (3)
Vermont:
0.5% (111)
Other Australian and New Zealand Subregion
Warren:
3.2% (3)
Vermont:
0.2% (40)
Other Western Europe
Warren:
2.2% (2)
Vermont:
1.2% (273)
Italy
Warren:
2.2% (2)
Vermont:
1.4% (322)
India
Warren:
2.2% (2)
Vermont:
2.5% (585)
El Salvador
Warren:
2.2% (2)
Vermont:
0.2% (41)
Nicaragua
Warren:
2.2% (2)
Vermont:
0.1% (18)
Argentina
Warren:
2.2% (2)
Vermont:
0.6% (131)
Place of birth for U.S.-born residents:
This state: 511
Other state: 1,061
Northeast: 797
Midwest: 95
South: 109
West: 60
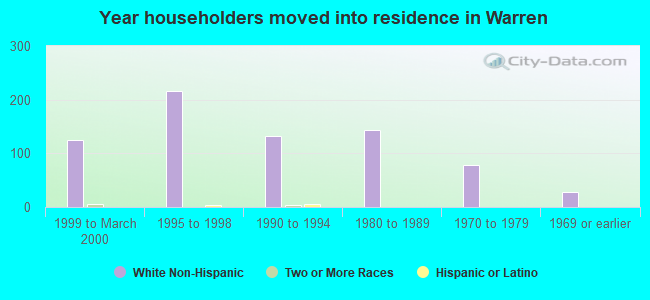
58% of Warren residents lived in the same house 5 years ago. Out of people who lived in different houses, 48% lived in this county. Out of people who lived in different counties, 24% lived in Vermont.
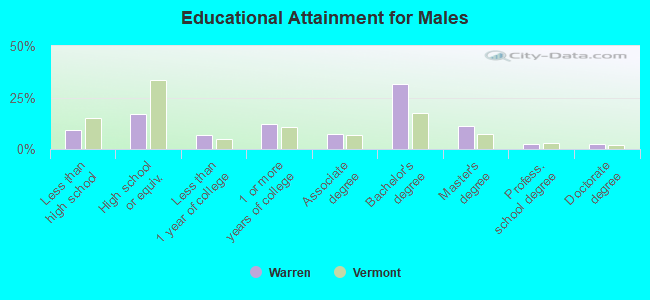
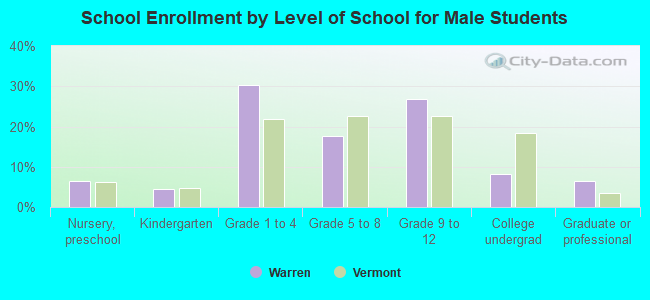
Education attainment for males 25 years and older:
No schooling: 4
Nursery to 4th grade: 0
5th and 6th grade: 0
7th and 8th grade: 8
9th grade: 14
10th grade: 9
11th grade: 13
12th grade, no diploma: 10
High school graduate (or equivalency): 107
Less than 1 year of college: 42
Some college more than 1 year, no degree: 75
Associate degree: 45
Bachelor's degree: 199
Master's degree: 71
Professional school degree: 15
Doctorate degree: 14
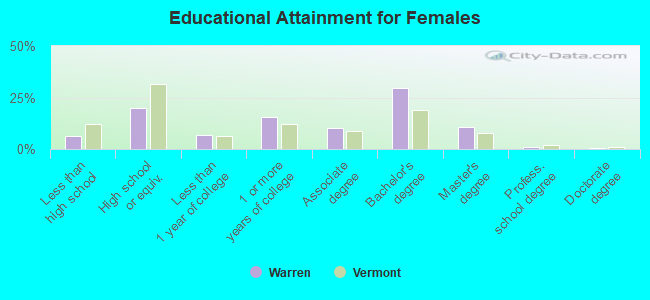
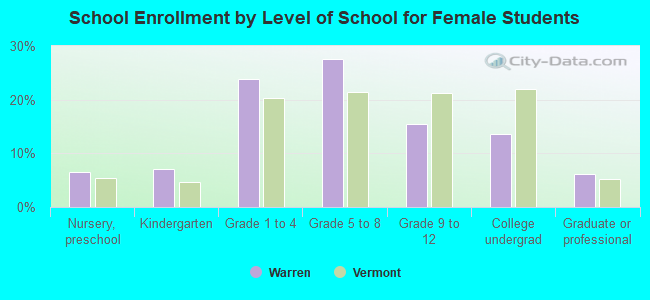
Education attainment for females 25 years and older:
No schooling: 0
Nursery to 4th grade: 2
5th and 6th grade: 0
7th and 8th grade: 5
9th grade: 2
10th grade: 7
11th grade: 9
12th grade, no diploma: 11
High school graduate (or equivalency): 114
Less than 1 year of college: 38
Some college more than 1 year, no degree: 90
Associate degree: 58
Bachelor's degree: 171
Master's degree: 62
Professional school degree: 6
Doctorate degree: 2
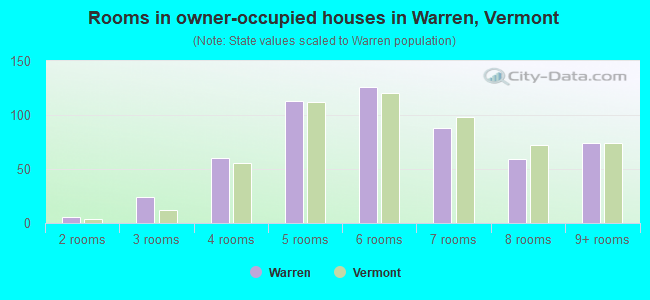
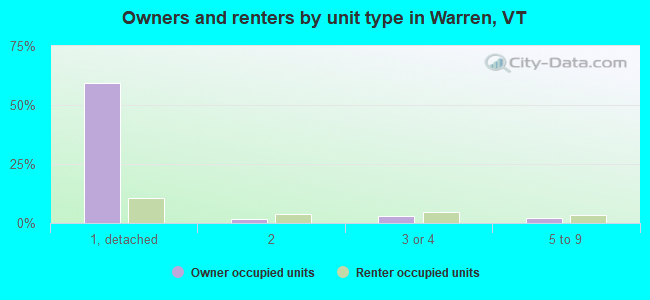
Housing units in structures:
One, detached: 909
One, attached: 182
Two: 60
3 or 4: 98
5 to 9: 173
10 to 19: 175
20 to 49: 163
50 or more: 251
Mobile homes: 63
Boats, RVs, vans, etc.: 4
Median worth of mobile homes: $176,780
Housing units lacking complete plumbing facilities: 1.8%
Housing units lacking complete kitchen facilities: 1.3%