Warrenton, VA (Virginia) Houses and Residents
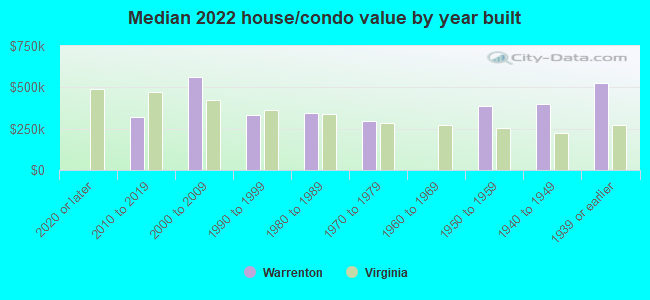
Estimated median house or condo value in 2022: $462,579 (it was $141,900 in 2000 )
Warrenton:
$462,579Virginia:
$365,700
Lower value quartile - upper value quartile: $317,828 - $603,520Total population: 9,907 (Urban population: 6,354 (all inside urban clusters), Rural population: 182 (all nonfarm) )
Houses: 4,157 (3,985 occupied: 2,612 owner occupied, 1,427 renter occupied )
% of renters here:
35%State:
33%
Housing density: 981 houses/condos per square mile
Median price asked for vacant for-sale houses and condos in 2022: $630,941.
Median contract rent in 2022: $1,218 (lower quartile is $894, upper quartile is $1,752)
Median rent asked for vacant for-rent units in 2022: $10,703
Median gross rent in Warrenton, VA in 2022: $1,547
Housing units in Warrenton with a mortgage: 2,106 (290 second mortgage, 0 home equity loan, 210 both second mortgage and home equity loan )Houses without a mortgage: 0
Median household income for houses/condos with a mortgage: $116,341
Median household income for apartments without a mortgage: $72,942
Median monthly housing costs: $1,566
Data:
Median house or condo value ($)
Median house or condo value ($ change since 2000)
Median house or condo value ($) - White
Median house or condo value ($) - Black or African American
Median house or condo value ($) - Asian
Median house or condo value ($) - Hispanic or Latino
Median house or condo value ($) - American Indian and Alaska Native
Median house or condo value ($) - Multirace
Median house or condo value ($) - Other Race
Median price asked for mobile homes ($)
Household density (households per square mile)
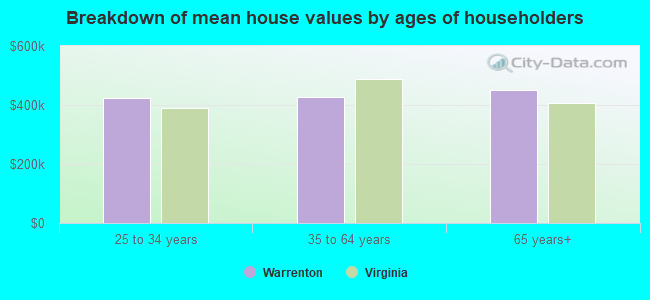
Mean house or condo value by units in structure - 1, detached ($)
Mean house or condo value by units in structure - 1, attached ($)
Mean house or condo value by units in structure - 2 ($)
Mean house or condo value by units in structure by units in structure - 3 or 4 ($)
Mean house or condo value by units in structure - 5 or more ($)
Mean house or condo value by units in structure - Boat, RV, van, etc. ($)
Mean house or condo value by units in structure - Mobile home ($)
Median contract rent ($)
Median contract rent - Lower quartile ($)
Median contract rent - Upper quartile ($)
Median gross rent ($)
Urban houses (%)
Rural houses (%)
Houses occupied (%)
Houses occupied (% change since 2000)
Houses owner occupied (%)
Houses owner occupied (% change since 2000)
Houses renter occupied (%)
Houses renter occupied (% change since 2000)
Vacant housing units - For rent (%)
Vacant housing units - For rent (% change since 2000)
Vacant housing units - For sale only (%)
Vacant housing units - For sale only (% change since 2000)
Vacant housing units - Rented or sold, not occupied (%)
Vacant housing units - Rented or sold, not occupied (% change since 2000)
Vacant housing units - For seasonal, recreational, or occasional use (%)
Vacant housing units - For seasonal, recreational, or occasional use (% change since 2000)
Vacant housing units - For migrant workers (%)
Vacant housing units - For migrant workers (% change since 2000)
Vacant housing units - Other vacant (%)
Vacant housing units - Other vacant (% change since 2000)
Median monthly housing costs ($)
Median household income for houses/condos with a mortgage ($)
Median household income for houses/condos without a mortgage ($)
Median household income ($)
Median household income ($) - White
Median household income ($) - Black or African American
Median household income ($) - Asian
Median household income ($) - Hispanic or Latino
Median household income ($) - American Indian and Alaska Native
Median household income ($) - Multirace
Median household income ($) - Other Race
Mortgage status - with mortgage (%)
Mortgage status - with second mortgage (%)
Mortgage status - with home equity loan (%)
Mortgage status - with both second mortgage and home equity loan (%)
Mortgage status - without a mortgage (%)
Median year house/condo built
Median year apartment built
Household type by relationship - Male householder living alone (%)
Household type by relationship - Male householder not living alone (%)
Household type by relationship - Female householder living alone (%)
Household type by relationship - Female householder not living alone (%)
Household type by relationship - Opposite-Sex spouse (%)
Household type by relationship - Same-Sex spouse (%)
Household type by relationship - Opposite-Sex unmarried partner (%)
Household type by relationship - Same-Sex unmarried partner (%)
Household type by relationship - In group quarters (%)
Size of family households - 2-person household (%)
Size of family households - 3-person household (%)
Size of family households - 4-person household (%)
Size of family households - 5-person household (%)
Size of family households - 6-person household (%)
Size of family households - 7-or-more-person household (%)
Size of nonfamily households - 1-person household (%)
Size of nonfamily households - 2-person household (%)
Size of nonfamily households - 3-person household (%)
Size of nonfamily households - 4-person household (%)
Size of nonfamily households - 5-person household (%)
Size of nonfamily households - 6-person household (%)
Size of nonfamily households - 7-or-moreperson household (%)
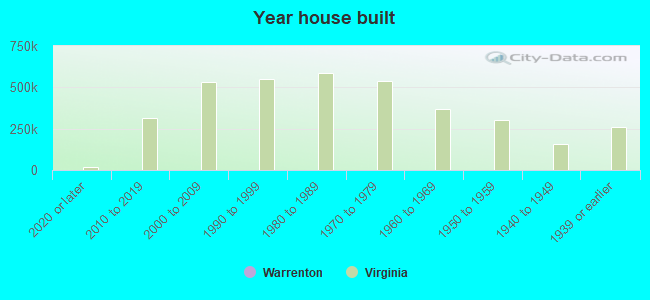
Year house built - Built 2010 or later (%)
Year house built - Built 2000 to 2009 (%)
Year house built - Built 1990 to 1999 (%)
Year house built - Built 1980 to 1989 (%)
Year house built - Built 1970 to 1979 (%)
Year house built - Built 1960 to 1969 (%)
Year house built - Built 1950 to 1959 (%)
Year house built - Built 1940 to 1949 (%)
Year house built - Built 1939 or earlier (%)
Median number of rooms in houses and condos
Median number of rooms in apartments
Median number of bedrooms in owner occupied houses
Mean number of bedrooms in owner occupied houses
Median number of bedrooms in renter occupied houses
Mean number of bedrooms in renter occupied houses
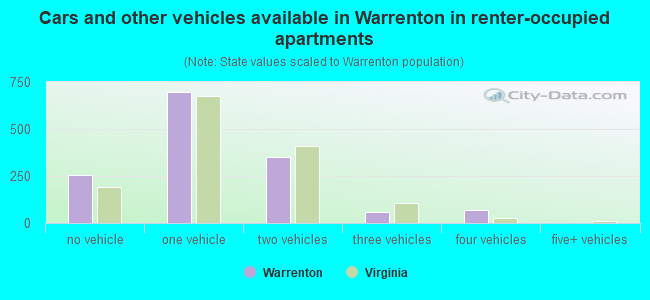
Median number of vehichles in owner occupied houses
Mean number of vehichles in owner occupied houses
Median number of vehichles in renter occupied houses
Mean number of vehichles in renter occupied houses
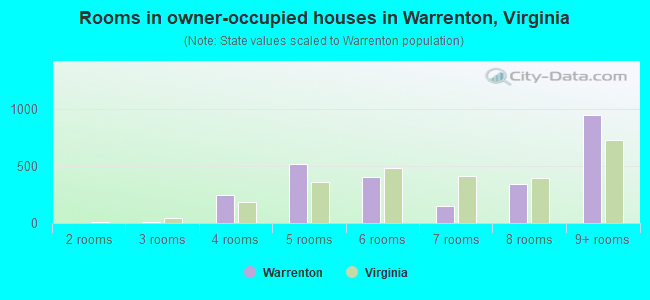
Rooms in owner-occupied houses - 1 room (%)
Rooms in owner-occupied houses - 2 rooms (%)
Rooms in owner-occupied houses - 3 rooms (%)
Rooms in owner-occupied houses - 4 rooms (%)
Rooms in owner-occupied houses - 5 rooms (%)
Rooms in owner-occupied houses - 6 rooms (%)
Rooms in owner-occupied houses - 7 rooms (%)
Rooms in owner-occupied houses - 8 rooms (%)
Rooms in owner-occupied houses - 9+ rooms (%)
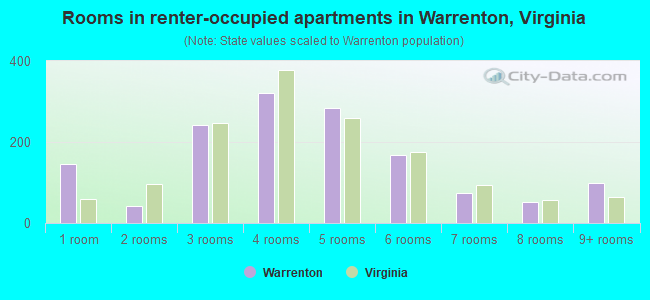
Rooms in renter-occupied houses - 1 room (%)
Rooms in renter-occupied houses - 2 rooms (%)
Rooms in renter-occupied houses - 3 rooms (%)
Rooms in renter-occupied houses - 4 rooms (%)
Rooms in renter-occupied houses - 5 rooms (%)
Rooms in renter-occupied houses - 6 rooms (%)
Rooms in renter-occupied houses - 7 rooms (%)
Rooms in renter-occupied houses - 8 rooms (%)
Rooms in renter-occupied houses - 9+ rooms (%)
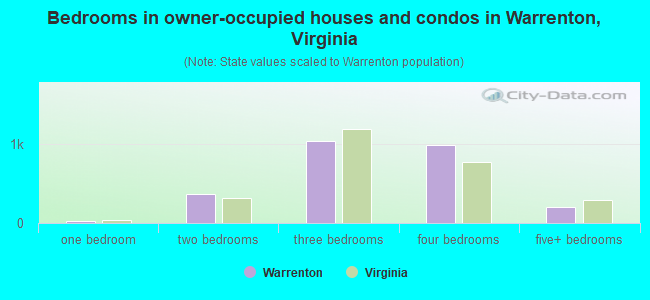
Bedrooms in owner-occupied houses - no bedrooms (%)
Bedrooms in owner-occupied houses - 1 bedroom (%)
Bedrooms in owner-occupied houses - 2 bedrooms (%)
Bedrooms in owner-occupied houses - 3 bedrooms (%)
Bedrooms in owner-occupied houses - 4 bedrooms (%)
Bedrooms in owner-occupied houses - 5+ bedrooms (%)
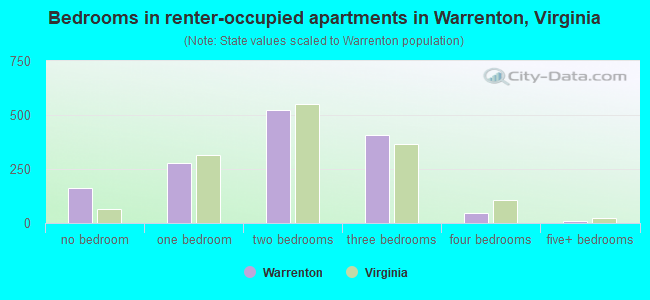
Bedrooms in renter-occupied houses - no bedrooms (%)
Bedrooms in renter-occupied houses - 1 bedroom (%)
Bedrooms in renter-occupied houses - 2 bedrooms (%)
Bedrooms in renter-occupied houses - 3 bedrooms (%)
Bedrooms in renter-occupied houses - 4 bedrooms (%)
Bedrooms in renter-occupied houses - 5+ bedrooms (%)
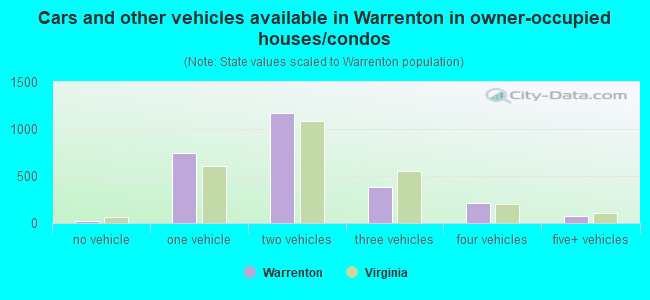
Vehicles available in owner-occupied houses - no vehicle available (%)
Vehicles available in owner-occupied houses - 1 vehicle available(%)
Vehicles available in owner-occupied houses - 2 Vehicles available (%)
Vehicles available in owner-occupied houses - 3 Vehicles available (%)
Vehicles available in owner-occupied houses - 4 Vehicles available (%)
Vehicles available in owner-occupied houses - 5+ Vehicles available (%)
Vehicles available in renter-occupied houses - no vehicle available (%)
Vehicles available in renter-occupied houses - 1 vehicle available (%)
Vehicles available in renter-occupied houses - 2 Vehicles available (%)
Vehicles available in renter-occupied houses - 3 Vehicles available (%)
Vehicles available in renter-occupied houses - 4 Vehicles available (%)
Vehicles available in renter-occupied houses - 5+ Vehicles available (%)
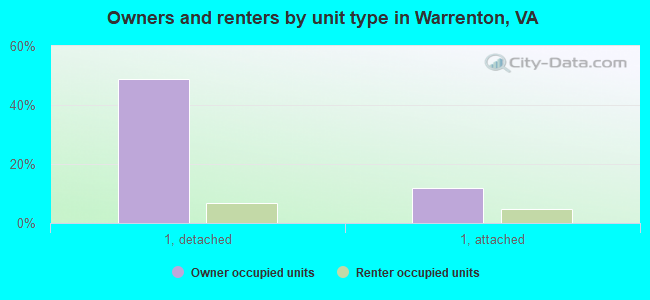
Housing units in structures - 1, detached (%)
Housing units in structures - 1, attached (%)
Housing units in structures - 2 (%)
Housing units in structures - 3 or 4 (%)
Housing units in structures - 5 to 9 (%)
Housing units in structures - 10 to 19 (%)
Housing units in structures - 20 to 49 (%)
Housing units in structures - 50 or more (%)
Housing units in structures - Mobile home (%)
Housing units in structures - Boat, RV, van, etc. (%)
Housing units in structures - Owners - 1, detached (%)
Housing units in structures - Owners - 1, attached (%)
Housing units in structures - Owners - 2 (%)
Housing units in structures - Owners - 3 or 4 (%)
Housing units in structures - Owners - 5 to 9 (%)
Housing units in structures - Owners - 10 to 19 (%)
Housing units in structures - Owners - 20 to 49 (%)
Housing units in structures - Owners - 50 or more (%)
Housing units in structures - Owners - Mobile home (%)
Housing units in structures - Owners - Boat, RV, van, etc. (%)
Housing units in structures - Renters - 1, detached (%)
Housing units in structures - Renters - 1, attached (%)
Housing units in structures - Renters - 2 (%)
Housing units in structures - Renters - 3 or 4 (%)
Housing units in structures - Renters - 5 to 9 (%)
Housing units in structures - Renters - 10 to 19 (%)
Housing units in structures - Renters - 20 to 49 (%)
Housing units in structures - Renters - 50 or more (%)
Housing units in structures - Renters - Mobile home (%)
Housing units in structures - Renters - Boat, RV, van, etc. (%)
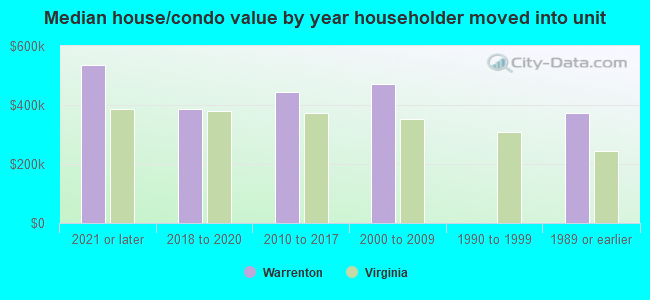
House/condo owner moved in on average (years ago)
Renter moved in on average (years ago)
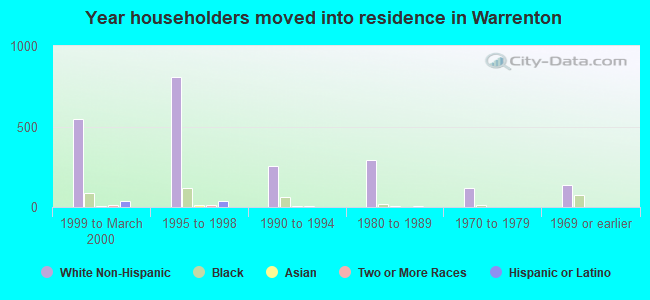
Year householder moved into unit - Moved in 1999 to March 2000 (%)
Year householder moved into unit - Moved in 1999 to March 2000 (%) - White
Year householder moved into unit - Moved in 1999 to March 2000 (%) - Black or African American
Year householder moved into unit - Moved in 1999 to March 2000 (%) - Asian
Year householder moved into unit - Moved in 1999 to March 2000 (%) - Hispanic or Latino
Year householder moved into unit - Moved in 1999 to March 2000 (%) - American Indian and Alaska Native
Year householder moved into unit - Moved in 1999 to March 2000 (%) - Multirace
Year householder moved into unit - Moved in 1999 to March 2000 (%) - Other Race
Year householder moved into unit - Moved in 1995 to 1998 (%)
Year householder moved into unit - Moved in 1995 to 1998 (%) - White
Year householder moved into unit - Moved in 1995 to 1998 (%) - Black or African American
Year householder moved into unit - Moved in 1995 to 1998 (%) - Asian
Year householder moved into unit - Moved in 1995 to 1998 (%) - Hispanic or Latino
Year householder moved into unit - Moved in 1995 to 1998 (%) - American Indian and Alaska Native
Year householder moved into unit - Moved in 1995 to 1998 (%) - Multirace
Year householder moved into unit - Moved in 1995 to 1998 (%) - Other Race
Year householder moved into unit - Moved in 1990 to 1994 (%)
Year householder moved into unit - Moved in 1990 to 1994 (%) - White
Year householder moved into unit - Moved in 1990 to 1994 (%) - Black or African American
Year householder moved into unit - Moved in 1990 to 1994 (%) - Asian
Year householder moved into unit - Moved in 1990 to 1994 (%) - Hispanic or Latino
Year householder moved into unit - Moved in 1990 to 1994 (%) - American Indian and Alaska Native
Year householder moved into unit - Moved in 1990 to 1994 (%) - Multirace
Year householder moved into unit - Moved in 1990 to 1994 (%) - Other Race
Year householder moved into unit - Moved in 1980 to 1989 (%)
Year householder moved into unit - Moved in 1980 to 1989 (%) - White
Year householder moved into unit - Moved in 1980 to 1989 (%) - Black or African American
Year householder moved into unit - Moved in 1980 to 1989 (%) - Asian
Year householder moved into unit - Moved in 1980 to 1989 (%) - Hispanic or Latino
Year householder moved into unit - Moved in 1980 to 1989 (%) - American Indian and Alaska Native
Year householder moved into unit - Moved in 1980 to 1989 (%) - Multirace
Year householder moved into unit - Moved in 1980 to 1989 (%) - Other Race
Year householder moved into unit - Moved in 1970 to 1979 (%)
Year householder moved into unit - Moved in 1970 to 1979 (%) - White
Year householder moved into unit - Moved in 1970 to 1979 (%) - Black or African American
Year householder moved into unit - Moved in 1970 to 1979 (%) - Asian
Year householder moved into unit - Moved in 1970 to 1979 (%) - Hispanic or Latino
Year householder moved into unit - Moved in 1970 to 1979 (%) - American Indian and Alaska Native
Year householder moved into unit - Moved in 1970 to 1979 (%) - Multirace
Year householder moved into unit - Moved in 1970 to 1979 (%) - Other Race
Year householder moved into unit - Moved in 1969 or earlier (%)
Year householder moved into unit - Moved in 1969 or earlier (%) - White
Year householder moved into unit - Moved in 1969 or earlier (%) - Black or African American
Year householder moved into unit - Moved in 1969 or earlier (%) - Asian
Year householder moved into unit - Moved in 1969 or earlier (%) - Hispanic or Latino
Year householder moved into unit - Moved in 1969 or earlier (%) - American Indian and Alaska Native
Year householder moved into unit - Moved in 1969 or earlier (%) - Multirace
Year householder moved into unit - Moved in 1969 or earlier (%) - Other Race
Housing units lacking complete plumbing facilities (%)
Housing units lacking complete kitchen facilities (%)
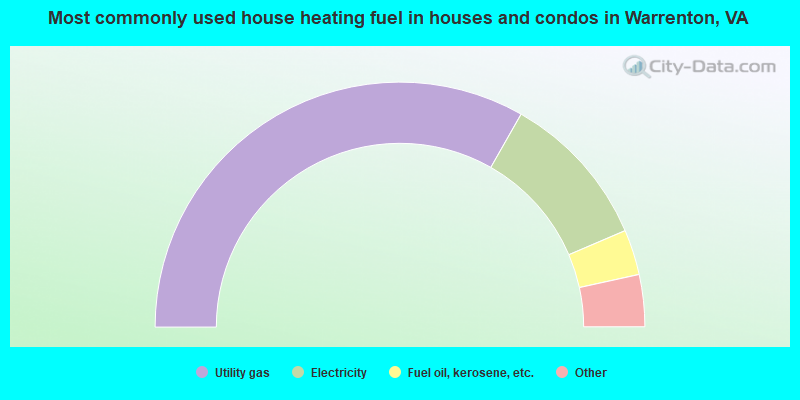
House heating fuel used in houses and condos - Utility gas (%)
House heating fuel used in houses and condos - Bottled, tank, or LP gas (%)
House heating fuel used in houses and condos - Electricity (%)
House heating fuel used in houses and condos - Fuel oil, kerosene, etc. (%)
House heating fuel used in houses and condos - Coal or coke (%)
House heating fuel used in houses and condos - Wood (%)
House heating fuel used in houses and condos - Solar energy (%)
House heating fuel used in houses and condos - Other fuel (%)
House heating fuel used in houses and condos - No fuel used (%)
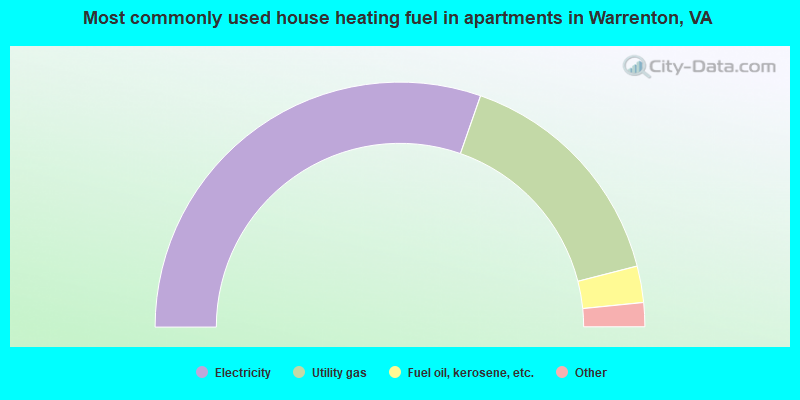
House heating fuel used in apartments - Utility gas (%)
House heating fuel used in apartments - Bottled, tank, or LP gas (%)
House heating fuel used in apartments - Electricity (%)
House heating fuel used in apartments - Fuel oil, kerosene, etc. (%)
House heating fuel used in apartments - Coal or coke (%)
House heating fuel used in apartments - Wood (%)
House heating fuel used in apartments - Solar energy (%)
House heating fuel used in apartments - Other fuel (%)
House heating fuel used in apartments - No fuel used (%)
Latest news about housing in Warrenton, VA collected exclusively by city-data.com from local newspapers, TV, and radio stations
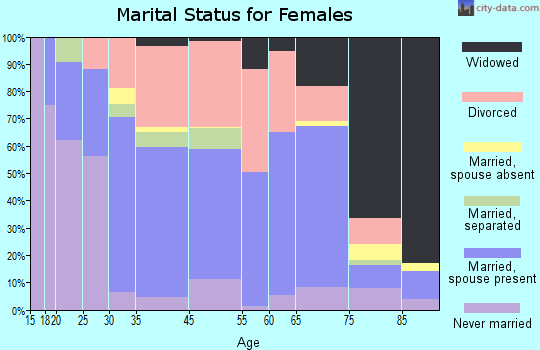
Median year house/condo built: 1994Median year apartment built: 1972Household type by relationship:
Households: 10,300
Male householders: 2,058 (586 living alone ), Female householders: 1,942 (847 living alone )1,503 spouses (1,493 opposite-sex spouses ), 226 unmarried partners , (226 opposite-sex unmarried partners ), 3,232 children (3,109 natural , 29 adopted , 93 stepchildren ), 218 grandchildren , 120 brothers or sisters , 28 parents , 46 foster children , 197 other relatives , 415 non-relatives In group quarters: 309
Size of family households: 832 2-persons , 521 3-persons , 627 4-persons , 131 5-persons , 170 6-persons , 117 7-or-more-persons .
Size of nonfamily households: 1,091 1-person , 413 2-persons , 6 4-persons , 21 5-persons .
1,782 married couples with children. single-parent households (16 men , 222 women ).
89.5% of residents of Warrenton speak English at home. of residents speak Spanish at home (53% speak English very well , 10% speak English well , 6% speak English not well , 30% don't speak English at all ).of residents speak other Indo-European language at home (46% speak English very well , 21% speak English well , 8% speak English not well , 25% don't speak English at all ).of residents speak Asian or Pacific Island language at home (66% speak English very well , 14% speak English well , 17% speak English not well , 3% don't speak English at all ).of residents speak other language at home (46% speak English very well , 54% speak English well ).
Foreign born population: 949 (9.2%)of them are naturalized citizens )
Median number of rooms in houses and condos:
Median number of rooms in apartments
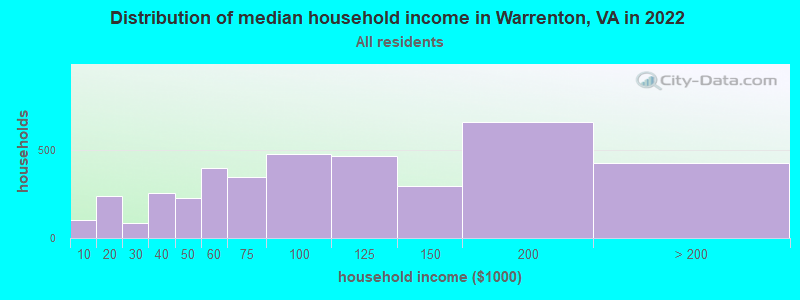
Warrenton, VA household income distribution 102 Less than $10,000238 $10,000 to $19,99986 $20,000 to $29,999255 $30,000 to $39,999227 $40,000 to $49,999397 $50,000 to $59,999349 $60,000 to $74,999477 $75,000 to $99,999466 $100,000 to $124,999293 $125,000 to $149,999659 $150,000 to $199,999425 $200,000 or more
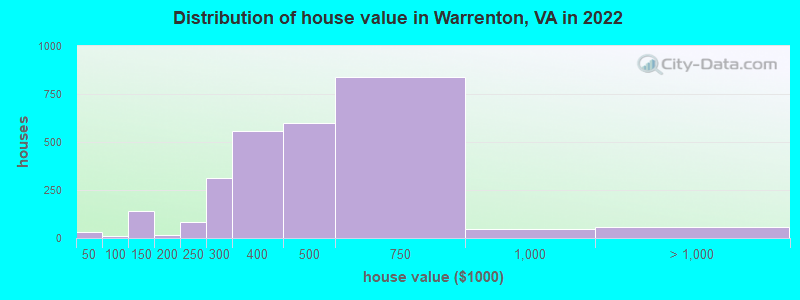
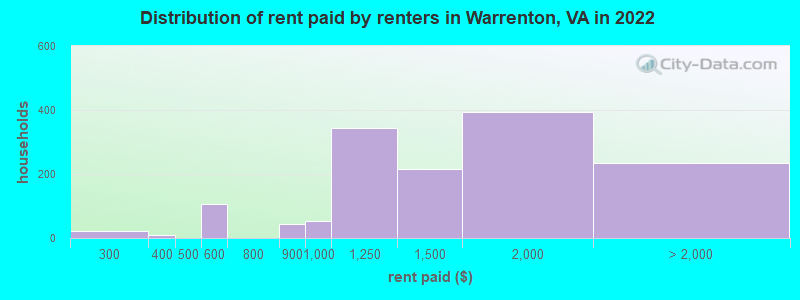
Home value of owner - occupied houses in 2022 in Warrenton, VA 12 Less than $10,00018 $20,000 to $24,99910 $60,000 to $69,99938 $100,000 to $124,999103 $125,000 to $149,99914 $150,000 to $174,99985 $200,000 to $249,999310 $250,000 to $299,999556 $300,000 to $399,999599 $400,000 to $499,999840 $500,000 to $749,99945 $750,000 to $999,99954 $1,000,000 to $1,499,999Rent paid by renters in 2022 in Warrenton, VA 16 $200 to $2494 $250 to $2998 $300 to $34985 $500 to $54919 $550 to $59942 $800 to $89952 $900 to $999344 $1,000 to $1,249214 $1,250 to $1,499395 $1,500 to $1,999115 $2,000 to $2,49925 $2,500 to $2,99950 $3,500 or more43 No cash rent
Percentage of workers working in this county: 58.1%Number of people working at home: 572 (11.0% of all workers )
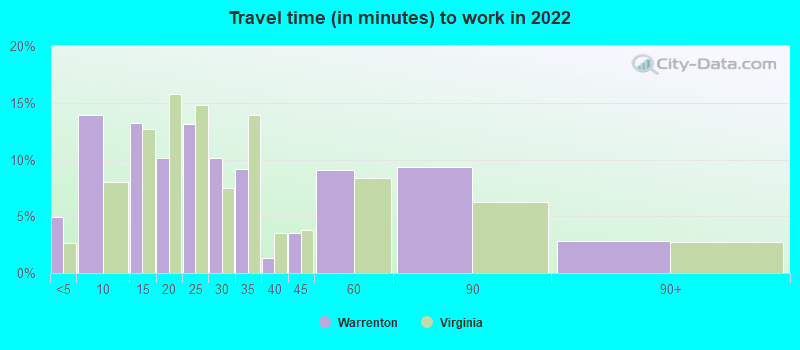
Travel time to work (commute)
Less than 5 minutes: 3065 to 9 minutes: 1,03210 to 14 minutes: 46315 to 19 minutes: 29820 to 24 minutes: 48225 to 29 minutes: 7030 to 34 minutes: 33835 to 39 minutes: 9840 to 44 minutes: 26245 to 59 minutes: 1,11560 to 89 minutes: 52690 or more minutes: 135
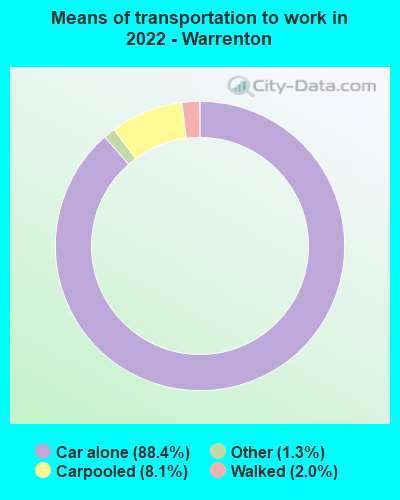
Means of transportation to work:
Drove a car alone: 8,661 (80.7%)Carpooled: 805 (7.5%)Bus : 4 (0.0%)Subway or elevated rail : 5 (0.0%)Taxi: 156 (1.5%)Walked: 214 (2.0%)Worked at home: 572 (5.3%)
Unemployment by race in 2022
Unemployment rate for White non-Hispanic residents 0.3% Males1.2% FemalesUnemployment rate for Black residents 23.7% Females
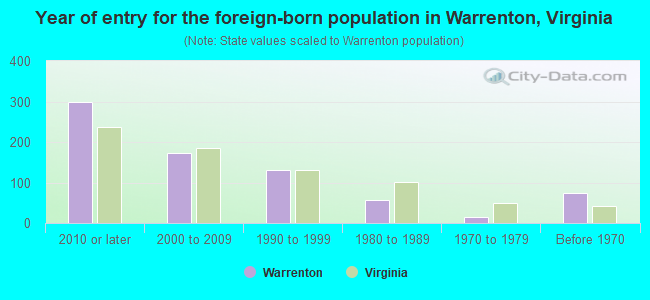
Year of entry for the foreign-born population in Warrenton, Virginia
298 2010 or later 173 2000 to 2009 130 1990 to 1999 57 1980 to 1989 14 1970 to 1979 74 Before 1970
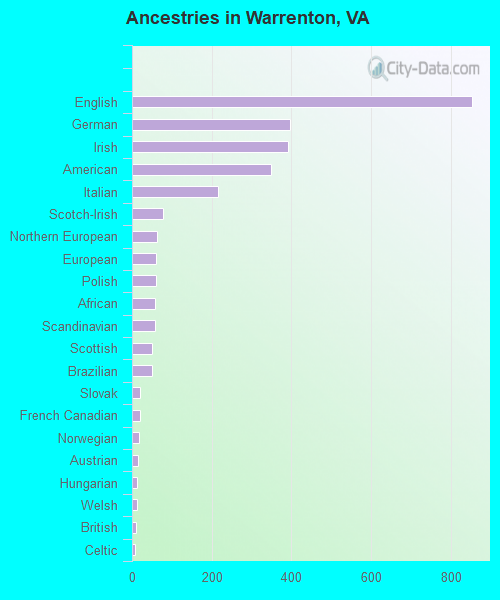
First ancestries reported:
English: 854 (19.5%)
German: 396 (9.0%)
Irish: 391 (8.9%)
American: 348 (7.9%)
Italian: 217 (4.9%)
Scotch-Irish: 77 (1.8%)
Northern European: 64 (1.5%)
European: 61 (1.4%)
Polish: 60 (1.4%)
African: 58 (1.3%)
Scandinavian: 57 (1.3%)
Scottish: 51 (1.2%)
Brazilian: 50 (1.1%)
Slovak: 20 (0.5%)
French Canadian: 19 (0.4%)
Norwegian: 18 (0.4%)
Austrian: 16 (0.4%)
Hungarian: 13 (0.3%)
Welsh: 13 (0.3%)
British: 10 (0.2%)
Celtic: 8 (0.2%)
Bulgarian: 6 (0.1%) Most common places of birth for foreign-born residents (%): India Warrenton:
22.7% (160)Virginia:
9.0% (97,830)
El Salvador Warrenton:
20.8% (147)Virginia:
9.9% (107,534)
Brazil Warrenton:
12.5% (88)Virginia:
0.7% (8,081)
Guatemala Warrenton:
4.4% (31)Virginia:
3.3% (35,938)
Guyana Warrenton:
4.0% (28)Virginia:
0.2% (2,415)
China, excluding Hong Kong and Taiwan Warrenton:
3.1% (22)Virginia:
3.9% (42,989)
Italy Warrenton:
3.0% (21)Virginia:
0.5% (5,147)
Germany Warrenton:
2.8% (20)Virginia:
1.7% (18,227)
Philippines Warrenton:
2.7% (19)Virginia:
4.8% (52,629)
England Warrenton:
2.4% (17)Virginia:
0.9% (9,842)
Korea Warrenton:
2.3% (16)Virginia:
4.9% (52,857)
Egypt Warrenton:
2.3% (16)Virginia:
0.9% (9,672)
Bolivia Warrenton:
2.3% (16)Virginia:
2.4% (25,722)
Nicaragua Warrenton:
1.8% (13)Virginia:
0.6% (6,916)
Costa Rica Warrenton:
1.6% (11)Virginia:
0.2% (1,859)
Venezuela Warrenton:
1.6% (11)Virginia:
0.8% (8,186)
Place of birth for U.S.-born residents:
This state: 5,099Other state: 3,946Northeast: 1,310Midwest: 487South: 1,796West: 354 92.1% of Warrenton residents lived in the same house 1 years ago.
Out of people who lived in different houses, 27.8% lived in this county.
Out of people who lived in different counties, 52.3% lived in Virginia.
Warrenton:
92.1%State average:
86.6%
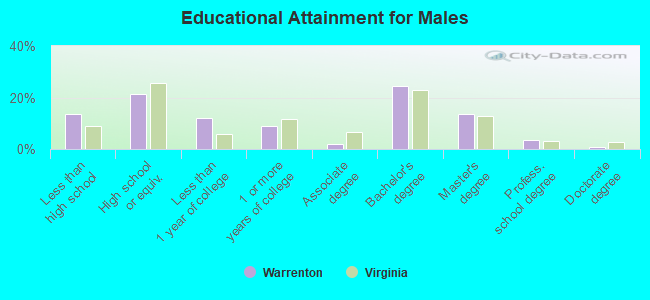
Education attainment for males 25 years and older:
No schooling: 16Nursery to 4th grade: 05th and 6th grade: 07th and 8th grade: 709th grade: 2210th grade: 2211th grade: 3812th grade, no diploma: 278High school graduate (or equivalency): 707Less than 1 year of college: 403Some college more than 1 year, no degree: 290Associate degree: 62Bachelor's degree: 815Master's degree: 444Professional school degree: 113Doctorate degree: 25
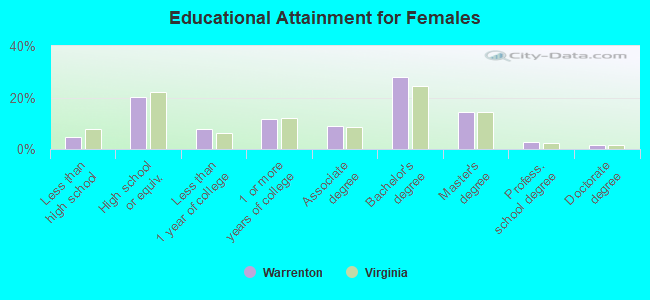
Education attainment for females 25 years and older:
No schooling: 7Nursery to 4th grade: 135th and 6th grade: 47th and 8th grade: 119th grade: 2910th grade: 2011th grade: 3212th grade, no diploma: 64High school graduate (or equivalency): 757Less than 1 year of college: 291Some college more than 1 year, no degree: 445Associate degree: 329Bachelor's degree: 1,059Master's degree: 542Professional school degree: 106Doctorate degree: 57
Housing units in structures:
One, detached: 2,354One, attached: 687Two: 813 or 4: 2975 to 9: 6910 to 19: 15520 to 49: 11750 or more: 242Mobile homes: 141Boats, RVs, vans, etc.: 17Housing units lacking complete plumbing facilities in 2022: 0.9%Housing units lacking complete kitchen facilities in 2022: 3.6%House/condo owner moved in on average 8 years ago
Renter moved in on average 0 years ago
Private vs. public school enrollment:
Students in private schools in grades 1 to 8 (elementary and middle school): 76 Students in private schools in grades 9 to 12 (high school): 22 Students in private undergraduate colleges: 114