Wasco, CA (California) Houses and Residents
Estimated median house or condo value in 2022: $262,203 (it was $80,700 in 2000 )
Wasco:
$262,203California:
$715,900
Lower value quartile - upper value quartile: $200,885 - $308,423Mean price in 2022: Detached houses: $267,209 Here:
$267,209State:
$988,808
Townhouses or other attached units: $236,572 Here:
$236,572State:
$838,546
Mobile homes: $106,038 Here:
$106,038State:
$184,506
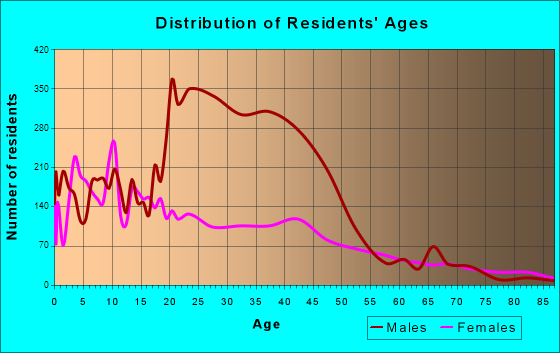
Total population: 26,303 (Urban population: 21,211 (all inside urban clusters), Rural population: 66 (7 farm, 59 nonfarm ))
Houses: 6,682 (6,170 occupied: 3,707 owner occupied, 2,504 renter occupied )
% of renters here:
40%State:
44%
Housing density: 879 houses/condos per square mile
Median price asked for vacant for-sale houses and condos in 2022: $520,428.
Median contract rent in 2022: $764 (lower quartile is $565, upper quartile is $1,056)
Median rent asked for vacant for-rent units in 2022: $835
Median gross rent in Wasco, CA in 2022: $961
Housing units in Wasco with a mortgage: 2,363 (52 second mortgage, 0 home equity loan, 38 both second mortgage and home equity loan )Houses without a mortgage: 0
Median household income for houses/condos with a mortgage: $72,275
Median household income for apartments without a mortgage: $46,234
Median monthly housing costs: $1,031
Data:
Median house or condo value ($)
Median house or condo value ($ change since 2000)
Median house or condo value ($) - White
Median house or condo value ($) - Black or African American
Median house or condo value ($) - Asian
Median house or condo value ($) - Hispanic or Latino
Median house or condo value ($) - American Indian and Alaska Native
Median house or condo value ($) - Multirace
Median house or condo value ($) - Other Race
Median price asked for mobile homes ($)
Household density (households per square mile)
Mean house or condo value by units in structure - 1, detached ($)
Mean house or condo value by units in structure - 1, attached ($)
Mean house or condo value by units in structure - 2 ($)
Mean house or condo value by units in structure by units in structure - 3 or 4 ($)
Mean house or condo value by units in structure - 5 or more ($)
Mean house or condo value by units in structure - Boat, RV, van, etc. ($)
Mean house or condo value by units in structure - Mobile home ($)
Median contract rent ($)
Median contract rent - Lower quartile ($)
Median contract rent - Upper quartile ($)
Median gross rent ($)
Urban houses (%)
Rural houses (%)
Houses occupied (%)
Houses occupied (% change since 2000)
Houses owner occupied (%)
Houses owner occupied (% change since 2000)
Houses renter occupied (%)
Houses renter occupied (% change since 2000)
Vacant housing units - For rent (%)
Vacant housing units - For rent (% change since 2000)
Vacant housing units - For sale only (%)
Vacant housing units - For sale only (% change since 2000)
Vacant housing units - Rented or sold, not occupied (%)
Vacant housing units - Rented or sold, not occupied (% change since 2000)
Vacant housing units - For seasonal, recreational, or occasional use (%)
Vacant housing units - For seasonal, recreational, or occasional use (% change since 2000)
Vacant housing units - For migrant workers (%)
Vacant housing units - For migrant workers (% change since 2000)
Vacant housing units - Other vacant (%)
Vacant housing units - Other vacant (% change since 2000)
Median monthly housing costs ($)
Median household income for houses/condos with a mortgage ($)
Median household income for houses/condos without a mortgage ($)
Median household income ($)
Median household income ($) - White
Median household income ($) - Black or African American
Median household income ($) - Asian
Median household income ($) - Hispanic or Latino
Median household income ($) - American Indian and Alaska Native
Median household income ($) - Multirace
Median household income ($) - Other Race
Mortgage status - with mortgage (%)
Mortgage status - with second mortgage (%)
Mortgage status - with home equity loan (%)
Mortgage status - with both second mortgage and home equity loan (%)
Mortgage status - without a mortgage (%)
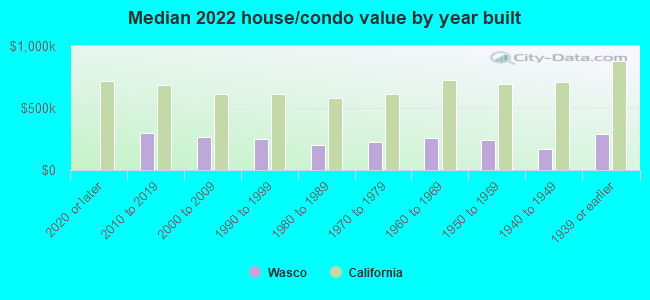
Median year house/condo built
Median year apartment built
Household type by relationship - Male householder living alone (%)
Household type by relationship - Male householder not living alone (%)
Household type by relationship - Female householder living alone (%)
Household type by relationship - Female householder not living alone (%)
Household type by relationship - Opposite-Sex spouse (%)
Household type by relationship - Same-Sex spouse (%)
Household type by relationship - Opposite-Sex unmarried partner (%)
Household type by relationship - Same-Sex unmarried partner (%)
Household type by relationship - In group quarters (%)
Size of family households - 2-person household (%)
Size of family households - 3-person household (%)
Size of family households - 4-person household (%)
Size of family households - 5-person household (%)
Size of family households - 6-person household (%)
Size of family households - 7-or-more-person household (%)
Size of nonfamily households - 1-person household (%)
Size of nonfamily households - 2-person household (%)
Size of nonfamily households - 3-person household (%)
Size of nonfamily households - 4-person household (%)
Size of nonfamily households - 5-person household (%)
Size of nonfamily households - 6-person household (%)
Size of nonfamily households - 7-or-moreperson household (%)
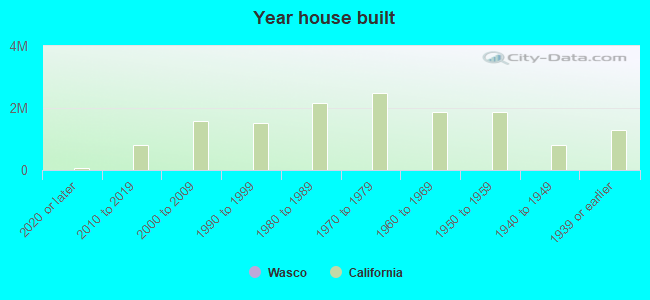
Year house built - Built 2010 or later (%)
Year house built - Built 2000 to 2009 (%)
Year house built - Built 1990 to 1999 (%)
Year house built - Built 1980 to 1989 (%)
Year house built - Built 1970 to 1979 (%)
Year house built - Built 1960 to 1969 (%)
Year house built - Built 1950 to 1959 (%)
Year house built - Built 1940 to 1949 (%)
Year house built - Built 1939 or earlier (%)
Median number of rooms in houses and condos
Median number of rooms in apartments
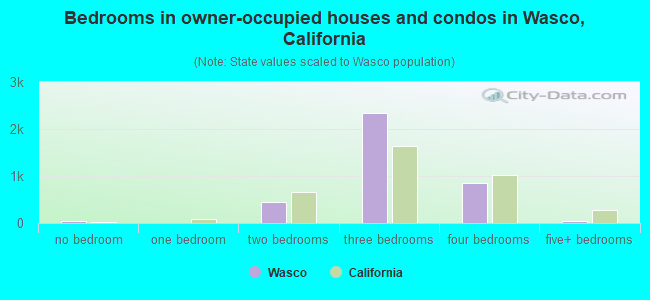
Median number of bedrooms in owner occupied houses
Mean number of bedrooms in owner occupied houses
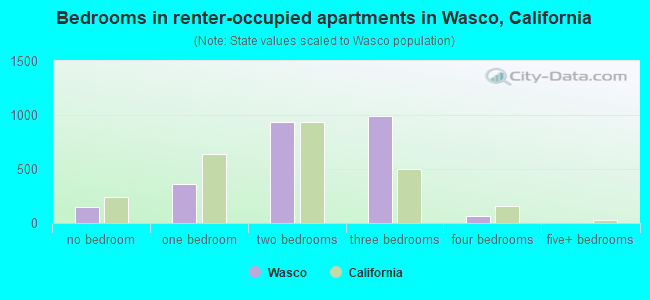
Median number of bedrooms in renter occupied houses
Mean number of bedrooms in renter occupied houses
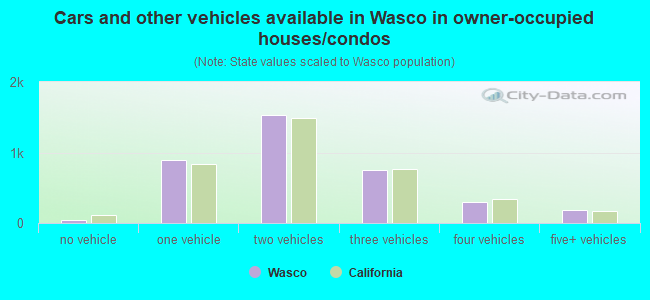
Median number of vehichles in owner occupied houses
Mean number of vehichles in owner occupied houses
Median number of vehichles in renter occupied houses
Mean number of vehichles in renter occupied houses
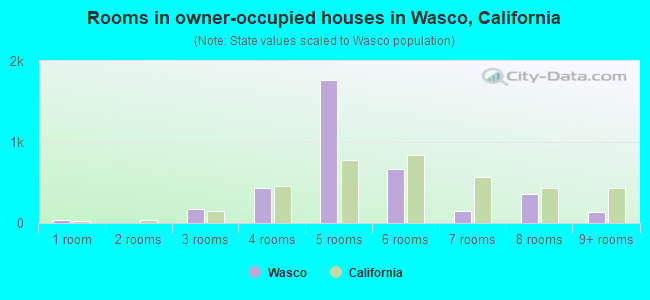
Rooms in owner-occupied houses - 1 room (%)
Rooms in owner-occupied houses - 2 rooms (%)
Rooms in owner-occupied houses - 3 rooms (%)
Rooms in owner-occupied houses - 4 rooms (%)
Rooms in owner-occupied houses - 5 rooms (%)
Rooms in owner-occupied houses - 6 rooms (%)
Rooms in owner-occupied houses - 7 rooms (%)
Rooms in owner-occupied houses - 8 rooms (%)
Rooms in owner-occupied houses - 9+ rooms (%)
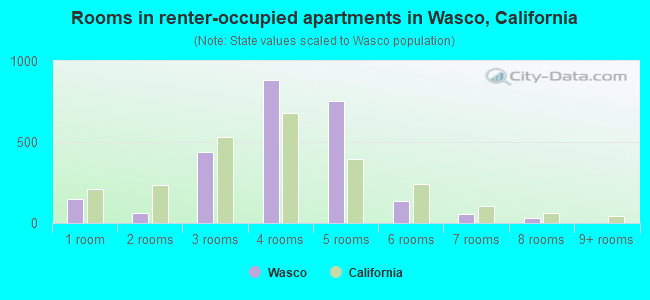
Rooms in renter-occupied houses - 1 room (%)
Rooms in renter-occupied houses - 2 rooms (%)
Rooms in renter-occupied houses - 3 rooms (%)
Rooms in renter-occupied houses - 4 rooms (%)
Rooms in renter-occupied houses - 5 rooms (%)
Rooms in renter-occupied houses - 6 rooms (%)
Rooms in renter-occupied houses - 7 rooms (%)
Rooms in renter-occupied houses - 8 rooms (%)
Rooms in renter-occupied houses - 9+ rooms (%)
Bedrooms in owner-occupied houses - no bedrooms (%)
Bedrooms in owner-occupied houses - 1 bedroom (%)
Bedrooms in owner-occupied houses - 2 bedrooms (%)
Bedrooms in owner-occupied houses - 3 bedrooms (%)
Bedrooms in owner-occupied houses - 4 bedrooms (%)
Bedrooms in owner-occupied houses - 5+ bedrooms (%)
Bedrooms in renter-occupied houses - no bedrooms (%)
Bedrooms in renter-occupied houses - 1 bedroom (%)
Bedrooms in renter-occupied houses - 2 bedrooms (%)
Bedrooms in renter-occupied houses - 3 bedrooms (%)
Bedrooms in renter-occupied houses - 4 bedrooms (%)
Bedrooms in renter-occupied houses - 5+ bedrooms (%)
Vehicles available in owner-occupied houses - no vehicle available (%)
Vehicles available in owner-occupied houses - 1 vehicle available(%)
Vehicles available in owner-occupied houses - 2 Vehicles available (%)
Vehicles available in owner-occupied houses - 3 Vehicles available (%)
Vehicles available in owner-occupied houses - 4 Vehicles available (%)
Vehicles available in owner-occupied houses - 5+ Vehicles available (%)
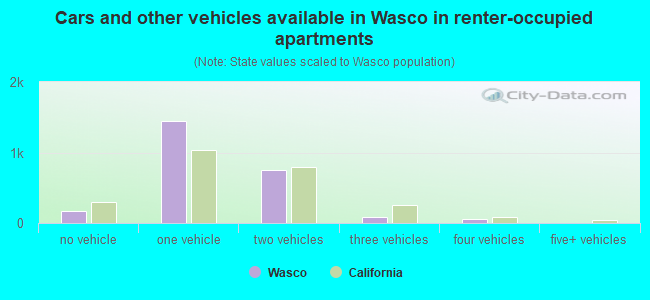
Vehicles available in renter-occupied houses - no vehicle available (%)
Vehicles available in renter-occupied houses - 1 vehicle available (%)
Vehicles available in renter-occupied houses - 2 Vehicles available (%)
Vehicles available in renter-occupied houses - 3 Vehicles available (%)
Vehicles available in renter-occupied houses - 4 Vehicles available (%)
Vehicles available in renter-occupied houses - 5+ Vehicles available (%)
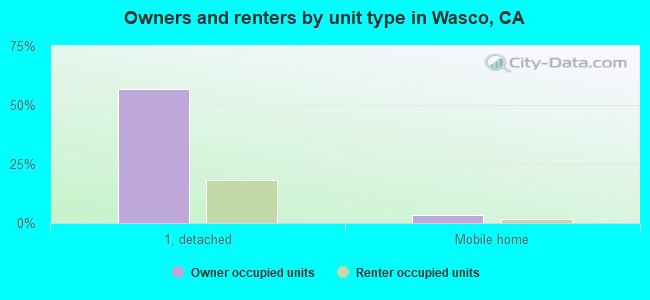
Housing units in structures - 1, detached (%)
Housing units in structures - 1, attached (%)
Housing units in structures - 2 (%)
Housing units in structures - 3 or 4 (%)
Housing units in structures - 5 to 9 (%)
Housing units in structures - 10 to 19 (%)
Housing units in structures - 20 to 49 (%)
Housing units in structures - 50 or more (%)
Housing units in structures - Mobile home (%)
Housing units in structures - Boat, RV, van, etc. (%)
Housing units in structures - Owners - 1, detached (%)
Housing units in structures - Owners - 1, attached (%)
Housing units in structures - Owners - 2 (%)
Housing units in structures - Owners - 3 or 4 (%)
Housing units in structures - Owners - 5 to 9 (%)
Housing units in structures - Owners - 10 to 19 (%)
Housing units in structures - Owners - 20 to 49 (%)
Housing units in structures - Owners - 50 or more (%)
Housing units in structures - Owners - Mobile home (%)
Housing units in structures - Owners - Boat, RV, van, etc. (%)
Housing units in structures - Renters - 1, detached (%)
Housing units in structures - Renters - 1, attached (%)
Housing units in structures - Renters - 2 (%)
Housing units in structures - Renters - 3 or 4 (%)
Housing units in structures - Renters - 5 to 9 (%)
Housing units in structures - Renters - 10 to 19 (%)
Housing units in structures - Renters - 20 to 49 (%)
Housing units in structures - Renters - 50 or more (%)
Housing units in structures - Renters - Mobile home (%)
Housing units in structures - Renters - Boat, RV, van, etc. (%)
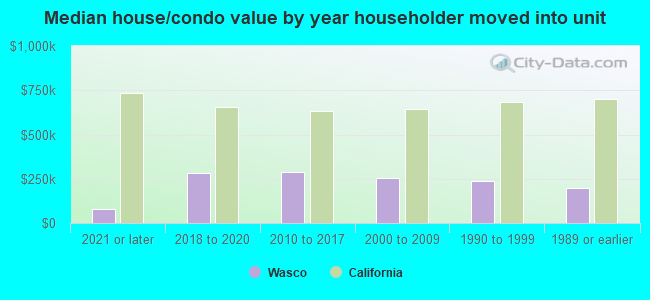
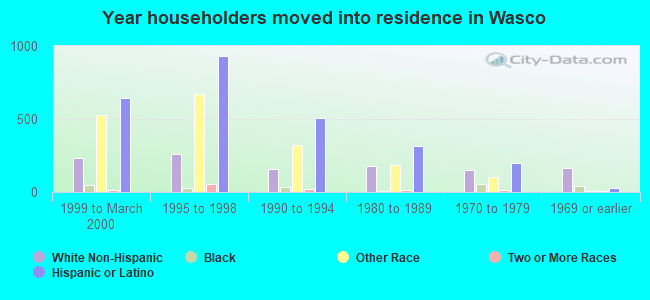
House/condo owner moved in on average (years ago)
Renter moved in on average (years ago)
Year householder moved into unit - Moved in 1999 to March 2000 (%)
Year householder moved into unit - Moved in 1999 to March 2000 (%) - White
Year householder moved into unit - Moved in 1999 to March 2000 (%) - Black or African American
Year householder moved into unit - Moved in 1999 to March 2000 (%) - Asian
Year householder moved into unit - Moved in 1999 to March 2000 (%) - Hispanic or Latino
Year householder moved into unit - Moved in 1999 to March 2000 (%) - American Indian and Alaska Native
Year householder moved into unit - Moved in 1999 to March 2000 (%) - Multirace
Year householder moved into unit - Moved in 1999 to March 2000 (%) - Other Race
Year householder moved into unit - Moved in 1995 to 1998 (%)
Year householder moved into unit - Moved in 1995 to 1998 (%) - White
Year householder moved into unit - Moved in 1995 to 1998 (%) - Black or African American
Year householder moved into unit - Moved in 1995 to 1998 (%) - Asian
Year householder moved into unit - Moved in 1995 to 1998 (%) - Hispanic or Latino
Year householder moved into unit - Moved in 1995 to 1998 (%) - American Indian and Alaska Native
Year householder moved into unit - Moved in 1995 to 1998 (%) - Multirace
Year householder moved into unit - Moved in 1995 to 1998 (%) - Other Race
Year householder moved into unit - Moved in 1990 to 1994 (%)
Year householder moved into unit - Moved in 1990 to 1994 (%) - White
Year householder moved into unit - Moved in 1990 to 1994 (%) - Black or African American
Year householder moved into unit - Moved in 1990 to 1994 (%) - Asian
Year householder moved into unit - Moved in 1990 to 1994 (%) - Hispanic or Latino
Year householder moved into unit - Moved in 1990 to 1994 (%) - American Indian and Alaska Native
Year householder moved into unit - Moved in 1990 to 1994 (%) - Multirace
Year householder moved into unit - Moved in 1990 to 1994 (%) - Other Race
Year householder moved into unit - Moved in 1980 to 1989 (%)
Year householder moved into unit - Moved in 1980 to 1989 (%) - White
Year householder moved into unit - Moved in 1980 to 1989 (%) - Black or African American
Year householder moved into unit - Moved in 1980 to 1989 (%) - Asian
Year householder moved into unit - Moved in 1980 to 1989 (%) - Hispanic or Latino
Year householder moved into unit - Moved in 1980 to 1989 (%) - American Indian and Alaska Native
Year householder moved into unit - Moved in 1980 to 1989 (%) - Multirace
Year householder moved into unit - Moved in 1980 to 1989 (%) - Other Race
Year householder moved into unit - Moved in 1970 to 1979 (%)
Year householder moved into unit - Moved in 1970 to 1979 (%) - White
Year householder moved into unit - Moved in 1970 to 1979 (%) - Black or African American
Year householder moved into unit - Moved in 1970 to 1979 (%) - Asian
Year householder moved into unit - Moved in 1970 to 1979 (%) - Hispanic or Latino
Year householder moved into unit - Moved in 1970 to 1979 (%) - American Indian and Alaska Native
Year householder moved into unit - Moved in 1970 to 1979 (%) - Multirace
Year householder moved into unit - Moved in 1970 to 1979 (%) - Other Race
Year householder moved into unit - Moved in 1969 or earlier (%)
Year householder moved into unit - Moved in 1969 or earlier (%) - White
Year householder moved into unit - Moved in 1969 or earlier (%) - Black or African American
Year householder moved into unit - Moved in 1969 or earlier (%) - Asian
Year householder moved into unit - Moved in 1969 or earlier (%) - Hispanic or Latino
Year householder moved into unit - Moved in 1969 or earlier (%) - American Indian and Alaska Native
Year householder moved into unit - Moved in 1969 or earlier (%) - Multirace
Year householder moved into unit - Moved in 1969 or earlier (%) - Other Race
Housing units lacking complete plumbing facilities (%)
Housing units lacking complete kitchen facilities (%)
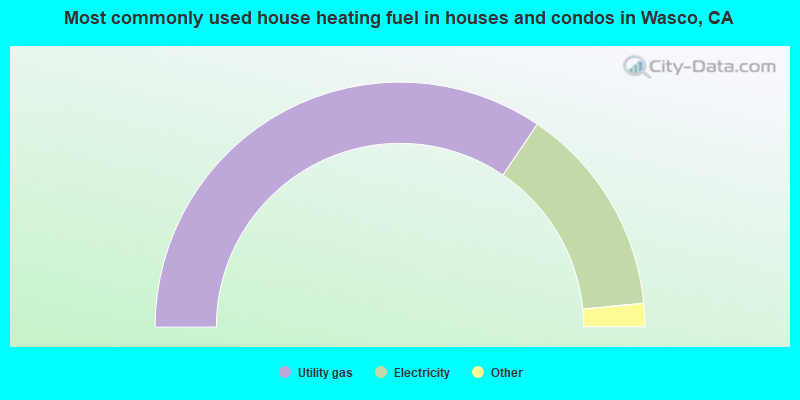
House heating fuel used in houses and condos - Utility gas (%)
House heating fuel used in houses and condos - Bottled, tank, or LP gas (%)
House heating fuel used in houses and condos - Electricity (%)
House heating fuel used in houses and condos - Fuel oil, kerosene, etc. (%)
House heating fuel used in houses and condos - Coal or coke (%)
House heating fuel used in houses and condos - Wood (%)
House heating fuel used in houses and condos - Solar energy (%)
House heating fuel used in houses and condos - Other fuel (%)
House heating fuel used in houses and condos - No fuel used (%)
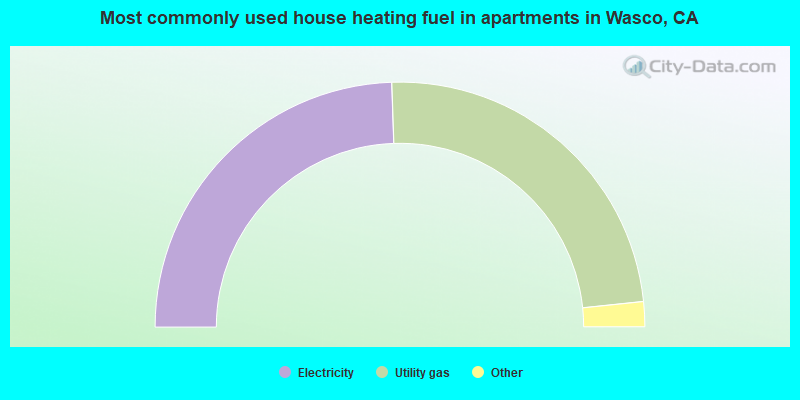
House heating fuel used in apartments - Utility gas (%)
House heating fuel used in apartments - Bottled, tank, or LP gas (%)
House heating fuel used in apartments - Electricity (%)
House heating fuel used in apartments - Fuel oil, kerosene, etc. (%)
House heating fuel used in apartments - Coal or coke (%)
House heating fuel used in apartments - Wood (%)
House heating fuel used in apartments - Solar energy (%)
House heating fuel used in apartments - Other fuel (%)
House heating fuel used in apartments - No fuel used (%)
Latest news about housing in Wasco, CA collected exclusively by city-data.com from local newspapers, TV, and radio stations
Median year house/condo built: 1993Median year apartment built: 1984Household type by relationship:
Households: 26,584
Male householders: 3,449 (510 living alone ), Female householders: 2,692 (511 living alone )3,208 spouses (3,208 opposite-sex spouses ), 590 unmarried partners , (590 opposite-sex unmarried partners ), 9,710 children (9,581 natural , 22 adopted , 107 stepchildren ), 811 grandchildren , 307 brothers or sisters , 439 parents , 0 foster children , 765 other relatives , 214 non-relatives In group quarters: 4,395
Size of family households: 1,340 2-persons , 1,204 3-persons , 1,037 4-persons , 616 5-persons , 473 6-persons , 537 7-or-more-persons .
Size of nonfamily households: 1,022 1-person , 41 2-persons .
3,836 married couples with children. single-parent households (1,402 men , 1,113 women ).
28.7% of residents of Wasco speak English at home. of residents speak Spanish at home (52% speak English very well , 18% speak English well , 16% speak English not well , 13% don't speak English at all ).of residents speak other Indo-European language at home (100% speak English very well ).of residents speak Asian or Pacific Island language at home (68% speak English very well , 20% speak English well , 12% speak English not well ).of residents speak other language at home (40% speak English very well , 7% speak English well , 35% speak English not well , 19% don't speak English at all ).
Foreign born population: 7,486 (28.2%)of them are naturalized citizens )
Median number of rooms in houses and condos:
Median number of rooms in apartments
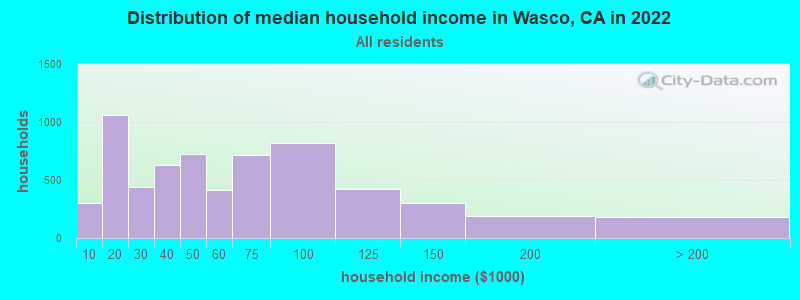
Wasco, CA household income distribution 298 Less than $10,0001,064 $10,000 to $19,999441 $20,000 to $29,999626 $30,000 to $39,999725 $40,000 to $49,999412 $50,000 to $59,999719 $60,000 to $74,999816 $75,000 to $99,999426 $100,000 to $124,999301 $125,000 to $149,999187 $150,000 to $199,999178 $200,000 or more
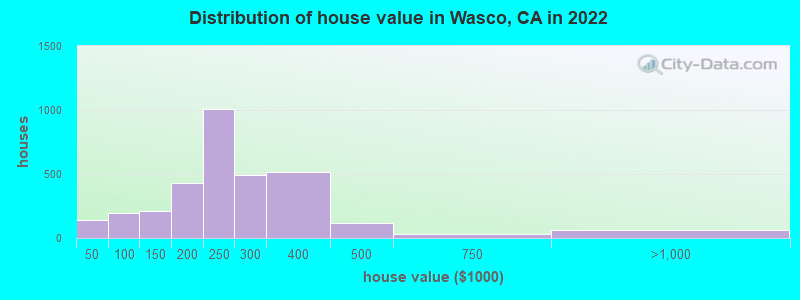
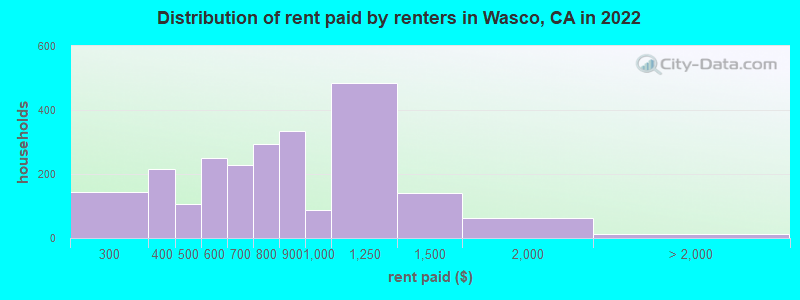
Home value of owner - occupied houses in 2022 in Wasco, CA 100 Less than $10,00010 $10,000 to $14,99927 $25,000 to $29,99958 $50,000 to $59,999129 $70,000 to $79,9999 $80,000 to $89,999143 $100,000 to $124,99966 $125,000 to $149,999175 $150,000 to $174,999253 $175,000 to $199,9991,009 $200,000 to $249,999493 $250,000 to $299,999516 $300,000 to $399,999114 $400,000 to $499,99929 $500,000 to $749,99961 $750,000 to $999,999Rent paid by renters in 2022 in Wasco, CA 3 $150 to $19979 $200 to $24965 $250 to $299175 $300 to $34940 $350 to $39949 $400 to $44956 $450 to $49954 $500 to $549196 $550 to $599118 $600 to $649108 $650 to $699175 $700 to $749117 $750 to $799333 $800 to $89987 $900 to $999484 $1,000 to $1,249140 $1,250 to $1,49963 $1,500 to $1,99912 No cash rent
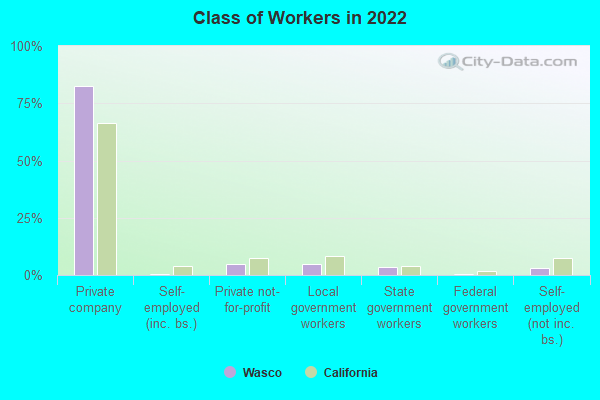
Percentage of workers working in this county: 95.4%Number of people working at home: 210 (2.4% of all workers )
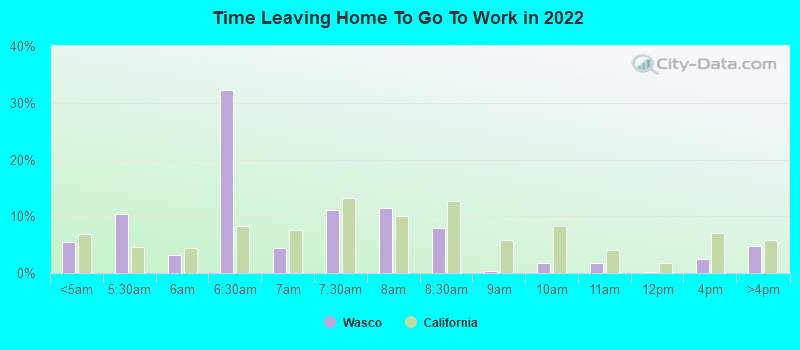
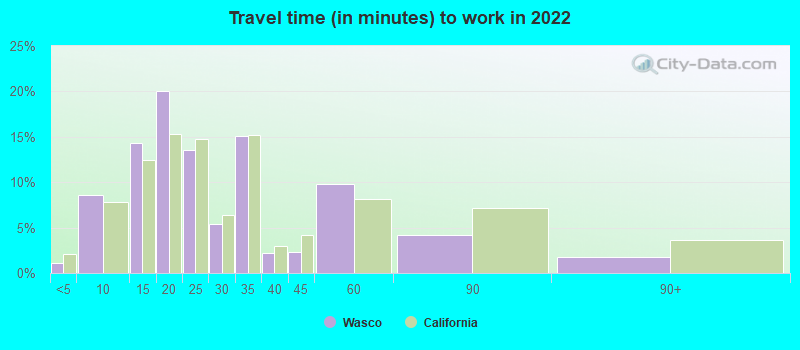
Travel time to work (commute)
Less than 5 minutes: 1315 to 9 minutes: 46710 to 14 minutes: 98415 to 19 minutes: 1,47920 to 24 minutes: 2,70425 to 29 minutes: 1,23730 to 34 minutes: 81235 to 39 minutes: 5840 to 44 minutes: 9945 to 59 minutes: 30860 to 89 minutes: 15190 or more minutes: 222
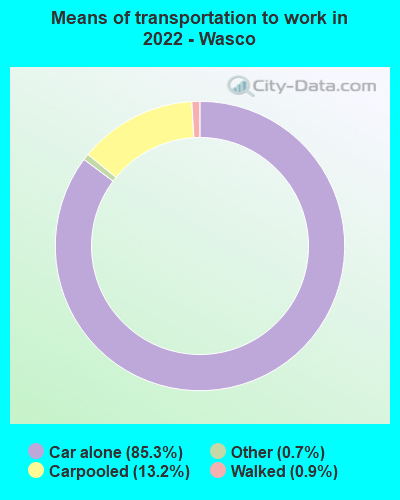
Means of transportation to work:
Drove a car alone: 5,813 (82.2%)Carpooled: 897 (12.7%)Taxi: 62 (0.9%)Walked: 65 (0.9%)Worked at home: 210 (3.0%)
Unemployment by race in 2022
Unemployment rate for White non-Hispanic residents 12.1% FemalesUnemployment rate for other race residents 7.8% Males7.4% FemalesUnemployment rate for two or more race residents 10.6% Males3.7% FemalesUnemployment rate for Hispanic or Latino residents 9.6% Males4.0% Females
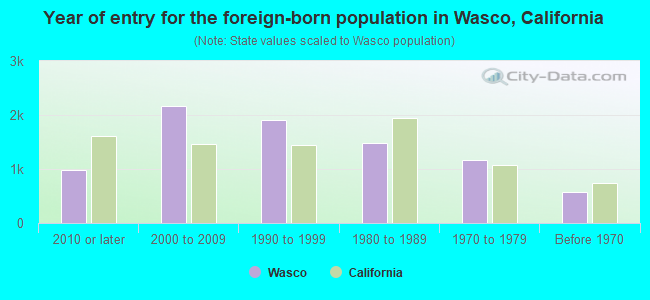
Year of entry for the foreign-born population in Wasco, California
980 2010 or later 2,160 2000 to 2009 1,915 1990 to 1999 1,479 1980 to 1989 1,162 1970 to 1979 575 Before 1970
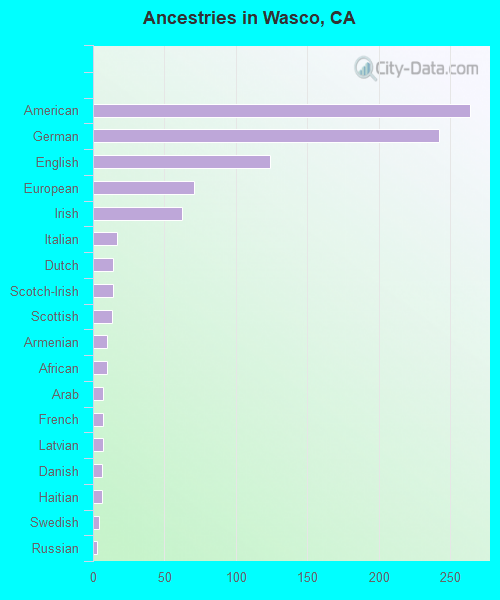
First ancestries reported:
American: 264 (1.2%)
German: 242 (1.1%)
English: 124 (0.6%)
European: 71 (0.3%)
Irish: 62 (0.3%)
Italian: 17 (0.08%)
Dutch: 14 (0.06%)
Scotch-Irish: 14 (0.06%)
Scottish: 13 (0.06%)
Armenian: 10 (0.05%)
African: 10 (0.05%)
Arab: 7 (0.03%)
French: 7 (0.03%)
Latvian: 7 (0.03%)
Danish: 6 (0.03%)
Haitian: 6 (0.03%)
Swedish: 4 (0.02%)
Russian: 3 (0.01%)
Ethiopian: 2 (0.01%) Most common places of birth for foreign-born residents (%): Mexico Wasco:
87.9% (6,722)California:
37.2% (3,881,193)
El Salvador Wasco:
6.7% (512)California:
4.2% (440,287)
Place of birth for U.S.-born residents:
This state: 17,674Other state: 1,138Northeast: 202Midwest: 172South: 402West: 371 90.9% of Wasco residents lived in the same house 1 years ago.
Out of people who lived in different houses, 22.6% lived in this county.
Out of people who lived in different counties, 97.2% lived in California.
Wasco:
90.9%State average:
88.9%
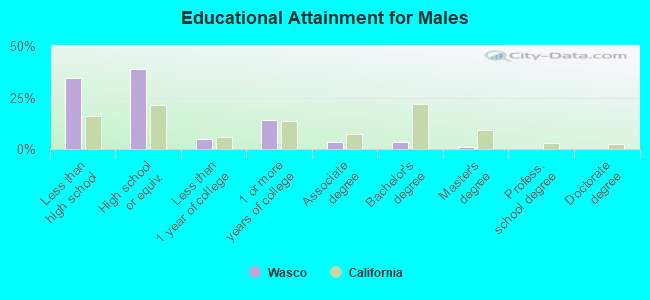
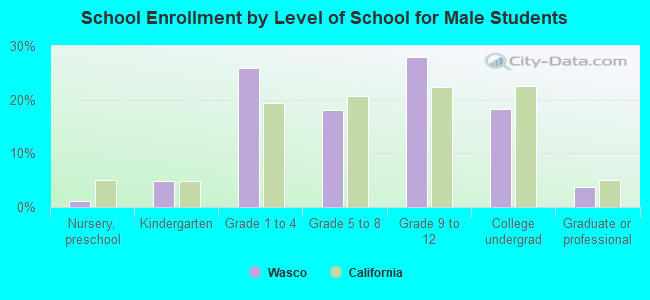
Education attainment for males 25 years and older:
No schooling: 661Nursery to 4th grade: 3985th and 6th grade: 4547th and 8th grade: 3359th grade: 24810th grade: 61311th grade: 40012th grade, no diploma: 458High school graduate (or equivalency): 4,032Less than 1 year of college: 530Some college more than 1 year, no degree: 1,484Associate degree: 375Bachelor's degree: 336Master's degree: 80Professional school degree: 10Doctorate degree: 0
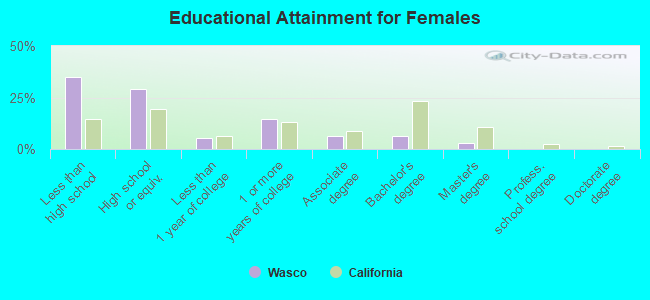
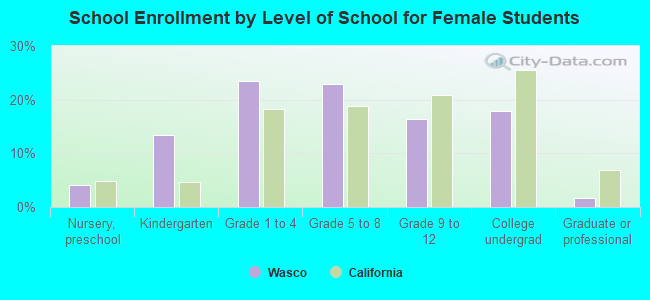
Education attainment for females 25 years and older:
No schooling: 386Nursery to 4th grade: 2395th and 6th grade: 6927th and 8th grade: 839th grade: 30910th grade: 15911th grade: 10412th grade, no diploma: 20High school graduate (or equivalency): 1,654Less than 1 year of college: 302Some college more than 1 year, no degree: 832Associate degree: 359Bachelor's degree: 362Master's degree: 151Professional school degree: 10Doctorate degree: 0
Housing units in structures:
One, detached: 5,035One, attached: 136Two: 813 or 4: 1805 to 9: 10010 to 19: 7020 to 49: 23750 or more: 533Mobile homes: 307Median worth of mobile homes: $74,334
Housing units lacking complete plumbing facilities in 2022: 3.9%Housing units lacking complete kitchen facilities in 2022: 4.2%House/condo owner moved in on average 10 years ago
Renter moved in on average 6 years ago
Private vs. public school enrollment:
Students in private schools in grades 1 to 8 (elementary and middle school): 5 Here:
0.2%California:
10.5%
Students in private schools in grades 9 to 12 (high school): 100 Students in private undergraduate colleges: 230 Here:
18.7%California:
15.9%