Wells Branch, TX (Texas) Houses and Residents
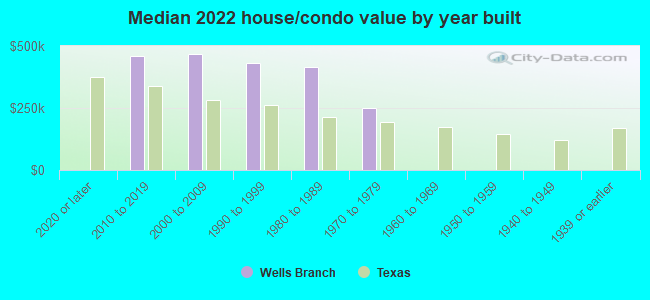
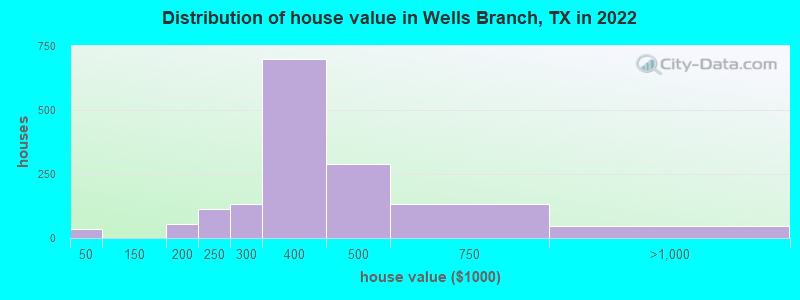
Estimated median house or condo value in 2022: $436,178 (it was $119,200 in 2000 )
Wells Branch:
$436,178Texas:
$275,400
Lower value quartile - upper value quartile: $372,100 - $479,338Total population: 12,120 (Urban population: 11,249, Rural population: 0)
Houses: 8,095 (7,592 occupied: 2,140 owner occupied, 5,472 renter occupied )
% of renters here:
72%State:
38%
Housing density: 3,201 houses/condos per square mile
Median price asked for vacant for-sale houses and condos in 2022 in this county: $941,819.
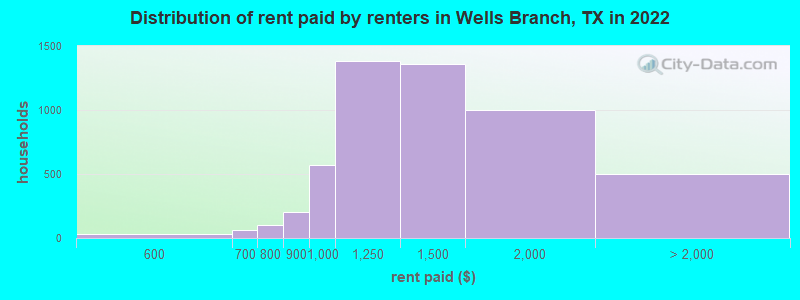
Median contract rent in 2022: $1,322 (lower quartile is $1,079, upper quartile is $1,569)
Median rent asked for vacant for-rent units in 2022: $1,900
Median gross rent in Wells Branch, TX in 2022: $1,439
Housing units in Wells Branch with a mortgage: 1,642 (109 second mortgage, 0 home equity loan, 111 both second mortgage and home equity loan )Houses without a mortgage: 12
Median household income for houses/condos with a mortgage: $142,419
Median household income for apartments without a mortgage: $111,691
Median monthly housing costs: $1,462
Data:
Median house or condo value ($)
Median house or condo value ($ change since 2000)
Median house or condo value ($) - White
Median house or condo value ($) - Black or African American
Median house or condo value ($) - Asian
Median house or condo value ($) - Hispanic or Latino
Median house or condo value ($) - American Indian and Alaska Native
Median house or condo value ($) - Multirace
Median house or condo value ($) - Other Race
Median price asked for mobile homes ($)
Household density (households per square mile)
Mean house or condo value by units in structure - 1, detached ($)
Mean house or condo value by units in structure - 1, attached ($)
Mean house or condo value by units in structure - 2 ($)
Mean house or condo value by units in structure by units in structure - 3 or 4 ($)
Mean house or condo value by units in structure - 5 or more ($)
Mean house or condo value by units in structure - Boat, RV, van, etc. ($)
Mean house or condo value by units in structure - Mobile home ($)
Median contract rent ($)
Median contract rent - Lower quartile ($)
Median contract rent - Upper quartile ($)
Median gross rent ($)
Urban houses (%)
Rural houses (%)
Houses occupied (%)
Houses occupied (% change since 2000)
Houses owner occupied (%)
Houses owner occupied (% change since 2000)
Houses renter occupied (%)
Houses renter occupied (% change since 2000)
Vacant housing units - For rent (%)
Vacant housing units - For rent (% change since 2000)
Vacant housing units - For sale only (%)
Vacant housing units - For sale only (% change since 2000)
Vacant housing units - Rented or sold, not occupied (%)
Vacant housing units - Rented or sold, not occupied (% change since 2000)
Vacant housing units - For seasonal, recreational, or occasional use (%)
Vacant housing units - For seasonal, recreational, or occasional use (% change since 2000)
Vacant housing units - For migrant workers (%)
Vacant housing units - For migrant workers (% change since 2000)
Vacant housing units - Other vacant (%)
Vacant housing units - Other vacant (% change since 2000)
Median monthly housing costs ($)
Median household income for houses/condos with a mortgage ($)
Median household income for houses/condos without a mortgage ($)
Median household income ($)
Median household income ($) - White
Median household income ($) - Black or African American
Median household income ($) - Asian
Median household income ($) - Hispanic or Latino
Median household income ($) - American Indian and Alaska Native
Median household income ($) - Multirace
Median household income ($) - Other Race
Mortgage status - with mortgage (%)
Mortgage status - with second mortgage (%)
Mortgage status - with home equity loan (%)
Mortgage status - with both second mortgage and home equity loan (%)
Mortgage status - without a mortgage (%)
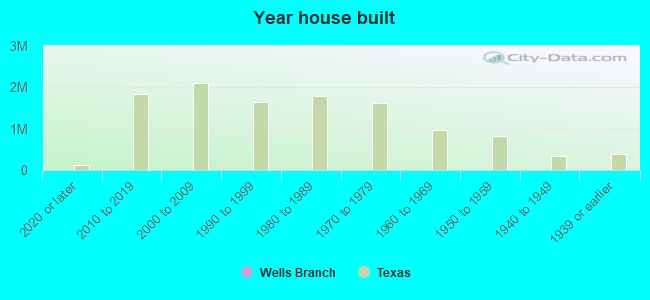
Median year house/condo built
Median year apartment built
Household type by relationship - Male householder living alone (%)
Household type by relationship - Male householder not living alone (%)
Household type by relationship - Female householder living alone (%)
Household type by relationship - Female householder not living alone (%)
Household type by relationship - Opposite-Sex spouse (%)
Household type by relationship - Same-Sex spouse (%)
Household type by relationship - Opposite-Sex unmarried partner (%)
Household type by relationship - Same-Sex unmarried partner (%)
Household type by relationship - In group quarters (%)
Size of family households - 2-person household (%)
Size of family households - 3-person household (%)
Size of family households - 4-person household (%)
Size of family households - 5-person household (%)
Size of family households - 6-person household (%)
Size of family households - 7-or-more-person household (%)
Size of nonfamily households - 1-person household (%)
Size of nonfamily households - 2-person household (%)
Size of nonfamily households - 3-person household (%)
Size of nonfamily households - 4-person household (%)
Size of nonfamily households - 5-person household (%)
Size of nonfamily households - 6-person household (%)
Size of nonfamily households - 7-or-moreperson household (%)
Year house built - Built 2010 or later (%)
Year house built - Built 2000 to 2009 (%)
Year house built - Built 1990 to 1999 (%)
Year house built - Built 1980 to 1989 (%)
Year house built - Built 1970 to 1979 (%)
Year house built - Built 1960 to 1969 (%)
Year house built - Built 1950 to 1959 (%)
Year house built - Built 1940 to 1949 (%)
Year house built - Built 1939 or earlier (%)
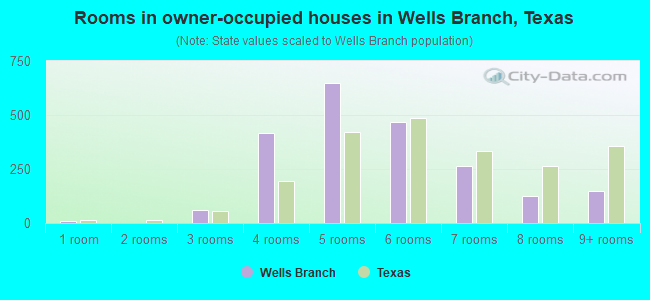
Median number of rooms in houses and condos
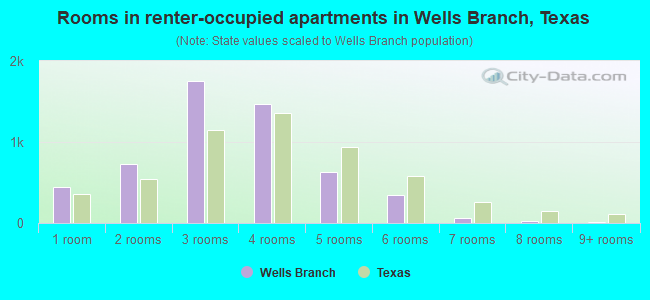
Median number of rooms in apartments
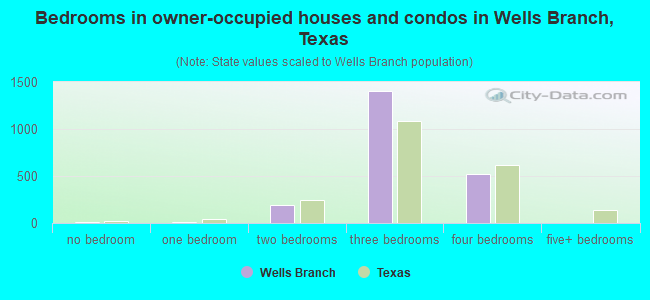
Median number of bedrooms in owner occupied houses
Mean number of bedrooms in owner occupied houses
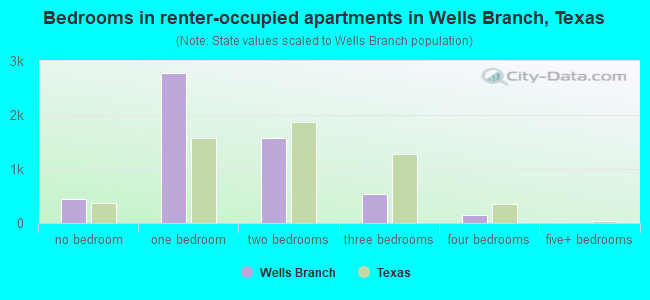
Median number of bedrooms in renter occupied houses
Mean number of bedrooms in renter occupied houses
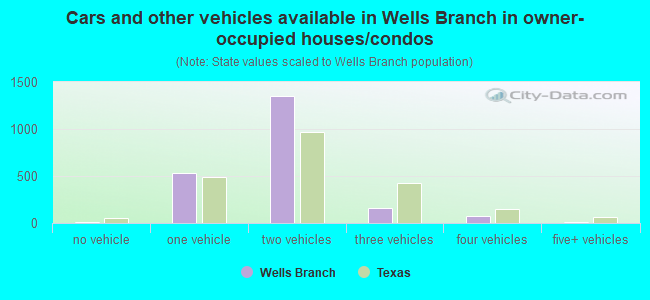
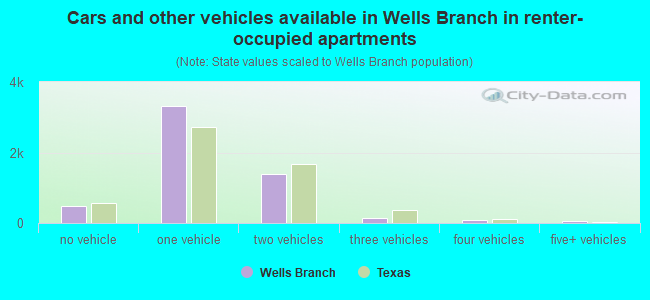
Median number of vehichles in owner occupied houses
Mean number of vehichles in owner occupied houses
Median number of vehichles in renter occupied houses
Mean number of vehichles in renter occupied houses
Rooms in owner-occupied houses - 1 room (%)
Rooms in owner-occupied houses - 2 rooms (%)
Rooms in owner-occupied houses - 3 rooms (%)
Rooms in owner-occupied houses - 4 rooms (%)
Rooms in owner-occupied houses - 5 rooms (%)
Rooms in owner-occupied houses - 6 rooms (%)
Rooms in owner-occupied houses - 7 rooms (%)
Rooms in owner-occupied houses - 8 rooms (%)
Rooms in owner-occupied houses - 9+ rooms (%)
Rooms in renter-occupied houses - 1 room (%)
Rooms in renter-occupied houses - 2 rooms (%)
Rooms in renter-occupied houses - 3 rooms (%)
Rooms in renter-occupied houses - 4 rooms (%)
Rooms in renter-occupied houses - 5 rooms (%)
Rooms in renter-occupied houses - 6 rooms (%)
Rooms in renter-occupied houses - 7 rooms (%)
Rooms in renter-occupied houses - 8 rooms (%)
Rooms in renter-occupied houses - 9+ rooms (%)
Bedrooms in owner-occupied houses - no bedrooms (%)
Bedrooms in owner-occupied houses - 1 bedroom (%)
Bedrooms in owner-occupied houses - 2 bedrooms (%)
Bedrooms in owner-occupied houses - 3 bedrooms (%)
Bedrooms in owner-occupied houses - 4 bedrooms (%)
Bedrooms in owner-occupied houses - 5+ bedrooms (%)
Bedrooms in renter-occupied houses - no bedrooms (%)
Bedrooms in renter-occupied houses - 1 bedroom (%)
Bedrooms in renter-occupied houses - 2 bedrooms (%)
Bedrooms in renter-occupied houses - 3 bedrooms (%)
Bedrooms in renter-occupied houses - 4 bedrooms (%)
Bedrooms in renter-occupied houses - 5+ bedrooms (%)
Vehicles available in owner-occupied houses - no vehicle available (%)
Vehicles available in owner-occupied houses - 1 vehicle available(%)
Vehicles available in owner-occupied houses - 2 Vehicles available (%)
Vehicles available in owner-occupied houses - 3 Vehicles available (%)
Vehicles available in owner-occupied houses - 4 Vehicles available (%)
Vehicles available in owner-occupied houses - 5+ Vehicles available (%)
Vehicles available in renter-occupied houses - no vehicle available (%)
Vehicles available in renter-occupied houses - 1 vehicle available (%)
Vehicles available in renter-occupied houses - 2 Vehicles available (%)
Vehicles available in renter-occupied houses - 3 Vehicles available (%)
Vehicles available in renter-occupied houses - 4 Vehicles available (%)
Vehicles available in renter-occupied houses - 5+ Vehicles available (%)
Housing units in structures - 1, detached (%)
Housing units in structures - 1, attached (%)
Housing units in structures - 2 (%)
Housing units in structures - 3 or 4 (%)
Housing units in structures - 5 to 9 (%)
Housing units in structures - 10 to 19 (%)
Housing units in structures - 20 to 49 (%)
Housing units in structures - 50 or more (%)
Housing units in structures - Mobile home (%)
Housing units in structures - Boat, RV, van, etc. (%)
Housing units in structures - Owners - 1, detached (%)
Housing units in structures - Owners - 1, attached (%)
Housing units in structures - Owners - 2 (%)
Housing units in structures - Owners - 3 or 4 (%)
Housing units in structures - Owners - 5 to 9 (%)
Housing units in structures - Owners - 10 to 19 (%)
Housing units in structures - Owners - 20 to 49 (%)
Housing units in structures - Owners - 50 or more (%)
Housing units in structures - Owners - Mobile home (%)
Housing units in structures - Owners - Boat, RV, van, etc. (%)
Housing units in structures - Renters - 1, detached (%)
Housing units in structures - Renters - 1, attached (%)
Housing units in structures - Renters - 2 (%)
Housing units in structures - Renters - 3 or 4 (%)
Housing units in structures - Renters - 5 to 9 (%)
Housing units in structures - Renters - 10 to 19 (%)
Housing units in structures - Renters - 20 to 49 (%)
Housing units in structures - Renters - 50 or more (%)
Housing units in structures - Renters - Mobile home (%)
Housing units in structures - Renters - Boat, RV, van, etc. (%)
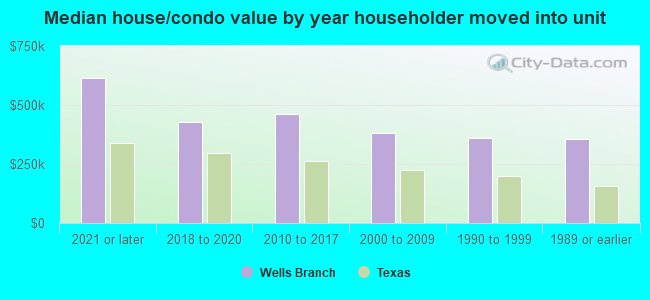
House/condo owner moved in on average (years ago)
Renter moved in on average (years ago)
Year householder moved into unit - Moved in 1999 to March 2000 (%)
Year householder moved into unit - Moved in 1999 to March 2000 (%) - White
Year householder moved into unit - Moved in 1999 to March 2000 (%) - Black or African American
Year householder moved into unit - Moved in 1999 to March 2000 (%) - Asian
Year householder moved into unit - Moved in 1999 to March 2000 (%) - Hispanic or Latino
Year householder moved into unit - Moved in 1999 to March 2000 (%) - American Indian and Alaska Native
Year householder moved into unit - Moved in 1999 to March 2000 (%) - Multirace
Year householder moved into unit - Moved in 1999 to March 2000 (%) - Other Race
Year householder moved into unit - Moved in 1995 to 1998 (%)
Year householder moved into unit - Moved in 1995 to 1998 (%) - White
Year householder moved into unit - Moved in 1995 to 1998 (%) - Black or African American
Year householder moved into unit - Moved in 1995 to 1998 (%) - Asian
Year householder moved into unit - Moved in 1995 to 1998 (%) - Hispanic or Latino
Year householder moved into unit - Moved in 1995 to 1998 (%) - American Indian and Alaska Native
Year householder moved into unit - Moved in 1995 to 1998 (%) - Multirace
Year householder moved into unit - Moved in 1995 to 1998 (%) - Other Race
Year householder moved into unit - Moved in 1990 to 1994 (%)
Year householder moved into unit - Moved in 1990 to 1994 (%) - White
Year householder moved into unit - Moved in 1990 to 1994 (%) - Black or African American
Year householder moved into unit - Moved in 1990 to 1994 (%) - Asian
Year householder moved into unit - Moved in 1990 to 1994 (%) - Hispanic or Latino
Year householder moved into unit - Moved in 1990 to 1994 (%) - American Indian and Alaska Native
Year householder moved into unit - Moved in 1990 to 1994 (%) - Multirace
Year householder moved into unit - Moved in 1990 to 1994 (%) - Other Race
Year householder moved into unit - Moved in 1980 to 1989 (%)
Year householder moved into unit - Moved in 1980 to 1989 (%) - White
Year householder moved into unit - Moved in 1980 to 1989 (%) - Black or African American
Year householder moved into unit - Moved in 1980 to 1989 (%) - Asian
Year householder moved into unit - Moved in 1980 to 1989 (%) - Hispanic or Latino
Year householder moved into unit - Moved in 1980 to 1989 (%) - American Indian and Alaska Native
Year householder moved into unit - Moved in 1980 to 1989 (%) - Multirace
Year householder moved into unit - Moved in 1980 to 1989 (%) - Other Race
Year householder moved into unit - Moved in 1970 to 1979 (%)
Year householder moved into unit - Moved in 1970 to 1979 (%) - White
Year householder moved into unit - Moved in 1970 to 1979 (%) - Black or African American
Year householder moved into unit - Moved in 1970 to 1979 (%) - Asian
Year householder moved into unit - Moved in 1970 to 1979 (%) - Hispanic or Latino
Year householder moved into unit - Moved in 1970 to 1979 (%) - American Indian and Alaska Native
Year householder moved into unit - Moved in 1970 to 1979 (%) - Multirace
Year householder moved into unit - Moved in 1970 to 1979 (%) - Other Race
Year householder moved into unit - Moved in 1969 or earlier (%)
Year householder moved into unit - Moved in 1969 or earlier (%) - White
Year householder moved into unit - Moved in 1969 or earlier (%) - Black or African American
Year householder moved into unit - Moved in 1969 or earlier (%) - Asian
Year householder moved into unit - Moved in 1969 or earlier (%) - Hispanic or Latino
Year householder moved into unit - Moved in 1969 or earlier (%) - American Indian and Alaska Native
Year householder moved into unit - Moved in 1969 or earlier (%) - Multirace
Year householder moved into unit - Moved in 1969 or earlier (%) - Other Race
Housing units lacking complete plumbing facilities (%)
Housing units lacking complete kitchen facilities (%)
House heating fuel used in houses and condos - Utility gas (%)
House heating fuel used in houses and condos - Bottled, tank, or LP gas (%)
House heating fuel used in houses and condos - Electricity (%)
House heating fuel used in houses and condos - Fuel oil, kerosene, etc. (%)
House heating fuel used in houses and condos - Coal or coke (%)
House heating fuel used in houses and condos - Wood (%)
House heating fuel used in houses and condos - Solar energy (%)
House heating fuel used in houses and condos - Other fuel (%)
House heating fuel used in houses and condos - No fuel used (%)
House heating fuel used in apartments - Utility gas (%)
House heating fuel used in apartments - Bottled, tank, or LP gas (%)
House heating fuel used in apartments - Electricity (%)
House heating fuel used in apartments - Fuel oil, kerosene, etc. (%)
House heating fuel used in apartments - Coal or coke (%)
House heating fuel used in apartments - Wood (%)
House heating fuel used in apartments - Solar energy (%)
House heating fuel used in apartments - Other fuel (%)
House heating fuel used in apartments - No fuel used (%)
Median year house/condo built: 1990Median year apartment built: 1998Household type by relationship:
Households: 14,345
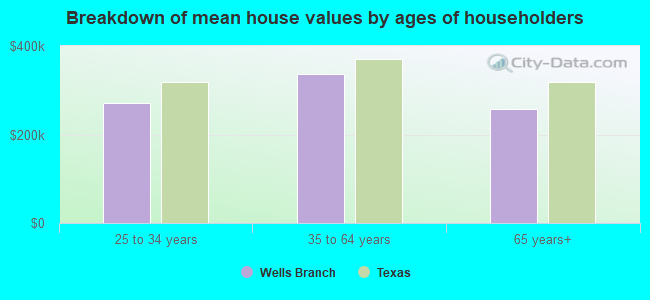
Male householders: 4,113 (1,594 living alone ), Female householders: 3,077 (1,514 living alone )2,610 spouses (2,565 opposite-sex spouses ), 594 unmarried partners , (594 opposite-sex unmarried partners ), 3,113 children (2,975 natural , 56 adopted , 81 stepchildren ), 16 grandchildren , 66 brothers or sisters , 182 parents , 0 foster children , 149 other relatives , 410 non-relatives In group quarters: 9
Size of family households: 1,728 2-persons , 1,037 3-persons , 465 4-persons , 229 5-persons , 45 6-persons , 15 7-or-more-persons .
Size of nonfamily households: 3,518 1-person , 607 2-persons , 38 3-persons , 11 5-persons .
1,881 married couples with children. single-parent households (137 men , 420 women ).
67.6% of residents of Wells Branch speak English at home. of residents speak Spanish at home (61% speak English very well , 24% speak English well , 11% speak English not well , 4% don't speak English at all ).of residents speak other Indo-European language at home (51% speak English very well , 33% speak English well , 12% speak English not well , 5% don't speak English at all ).of residents speak Asian or Pacific Island language at home (46% speak English very well , 19% speak English well , 1% speak English not well , 34% don't speak English at all ).of residents speak other language at home (72% speak English very well , 14% speak English well , 13% speak English not well ).
Foreign born population: 3,268 (22.8%)of them are naturalized citizens )
Median number of rooms in houses and condos:
Median number of rooms in apartments
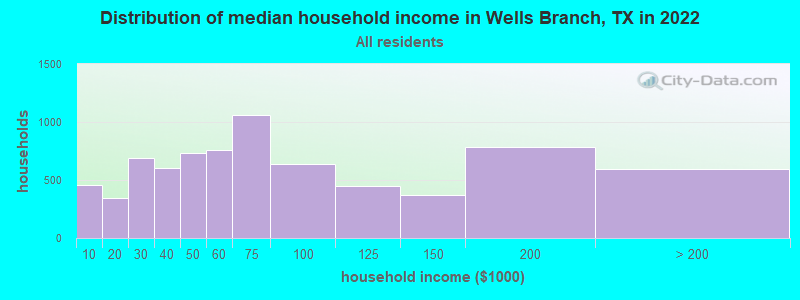
Wells Branch, TX household income distribution 461 Less than $10,000348 $10,000 to $19,999687 $20,000 to $29,999600 $30,000 to $39,999732 $40,000 to $49,999761 $50,000 to $59,9991,064 $60,000 to $74,999635 $75,000 to $99,999451 $100,000 to $124,999368 $125,000 to $149,999783 $150,000 to $199,999594 $200,000 or more
Home value of owner - occupied houses in 2022 in Wells Branch, TX 34 Less than $10,00038 $150,000 to $174,99914 $175,000 to $199,999114 $200,000 to $249,999132 $250,000 to $299,999700 $300,000 to $399,999289 $400,000 to $499,999133 $500,000 to $749,99936 $750,000 to $999,99911 $2,000,000 or moreRent paid by renters in 2022 in Wells Branch, TX 29 $550 to $59964 $650 to $69929 $700 to $74971 $750 to $799203 $800 to $899569 $900 to $9991,381 $1,000 to $1,2491,359 $1,250 to $1,499998 $1,500 to $1,999389 $2,000 to $2,49999 $3,000 to $3,49910 $3,500 or more
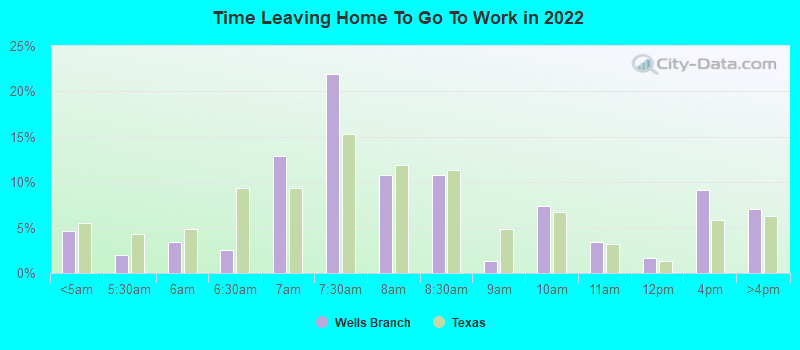
Percentage of workers working in this county: 84.8%Number of people working at home: 2,306 (25.8% of all workers )
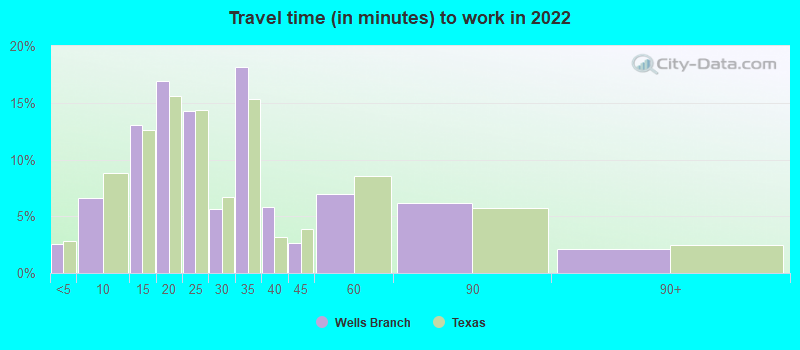
Travel time to work (commute)
Less than 5 minutes: 1895 to 9 minutes: 35410 to 14 minutes: 1,25815 to 19 minutes: 1,40820 to 24 minutes: 1,23025 to 29 minutes: 45630 to 34 minutes: 82135 to 39 minutes: 30640 to 44 minutes: 11745 to 59 minutes: 34260 to 89 minutes: 11490 or more minutes: 9
Means of transportation to work:
Drove a car alone: 3,737 (56.1%)Carpooled: 646 (9.7%)Bus : 39 (0.6%)Light rail, streetcar or trolley : 62 (0.9%)Taxi: 3 (0.0%)Walked: 74 (1.1%)Worked at home: 2,306 (34.6%)
Unemployment by race in 2022
Unemployment rate for White non-Hispanic residents 1.0% MalesUnemployment rate for two or more race residents 1.2% FemalesUnemployment rate for Hispanic or Latino residents 2.1% Males1.6% Females
Year of entry for the foreign-born population in Wells Branch, Texas
2,301 2010 or later 505 2000 to 2009 416 1990 to 1999 321 1980 to 1989 226 1970 to 1979 126 Before 1970
First ancestries reported:
German: 482 (6.6%)
Turkish: 445 (6.1%)
English: 430 (5.9%)
American: 275 (3.8%)
Iranian: 232 (3.2%)
Afghan: 202 (2.8%)
Italian: 169 (2.3%)
Irish: 155 (2.1%)
European: 120 (1.6%)
African: 105 (1.4%)
Portuguese: 103 (1.4%)
Moroccan: 68 (0.9%)
Russian: 68 (0.9%)
Czech: 61 (0.8%)
Ethiopian: 48 (0.7%)
Romanian: 36 (0.5%)
British: 34 (0.5%)
Scotch-Irish: 30 (0.4%)
Belgian: 29 (0.4%)
Slavic: 28 (0.4%)
Lebanese: 22 (0.3%)
Polish: 22 (0.3%)
Norwegian: 18 (0.2%)
Scottish: 14 (0.2%)
Lithuanian: 12 (0.2%)
Armenian: 9 (0.1%)
Greek: 9 (0.1%)
Swedish: 9 (0.1%)
French Canadian: 7 (0.10%)
Dutch: 6 (0.08%)
Eastern European: 4 (0.05%)
French: 3 (0.04%) Most common places of birth for foreign-born residents (%): Mexico Wells Branch:
21.1% (691)Texas:
48.4% (2,411,723)
Turkey Wells Branch:
12.8% (419)Texas:
0.3% (13,298)
India Wells Branch:
8.4% (274)Texas:
6.1% (306,347)
Nepal Wells Branch:
7.6% (250)Texas:
0.6% (27,480)
Iran Wells Branch:
7.3% (240)Texas:
0.6% (28,963)
China, excluding Hong Kong and Taiwan Wells Branch:
6.8% (223)Texas:
2.3% (115,558)
Venezuela Wells Branch:
5.2% (170)Texas:
1.5% (72,413)
Morocco Wells Branch:
4.5% (147)Texas:
0.1% (4,509)
El Salvador Wells Branch:
4.5% (147)Texas:
4.5% (224,455)
Afghanistan Wells Branch:
3.7% (120)Texas:
0.3% (13,197)
Albania Wells Branch:
3.0% (98)Texas:
0.0% (1,967)
Cameroon Wells Branch:
2.5% (82)Texas:
0.3% (15,833)
Vietnam Wells Branch:
1.9% (62)Texas:
3.7% (184,770)
Germany Wells Branch:
1.9% (61)Texas:
0.8% (37,989)
Ethiopia Wells Branch:
1.6% (54)Texas:
0.5% (24,705)
Portugal Wells Branch:
1.6% (51)Texas:
0.0% (1,905)
Place of birth for U.S.-born residents:
This state: 6,188Other state: 4,732Northeast: 989Midwest: 1,556South: 1,090West: 1,106 76.1% of Wells Branch residents lived in the same house 1 years ago.
Out of people who lived in different houses, 32.0% lived in this county.
Out of people who lived in different counties, 63.2% lived in Texas.
Wells Branch:
76.1%State average:
85.7%
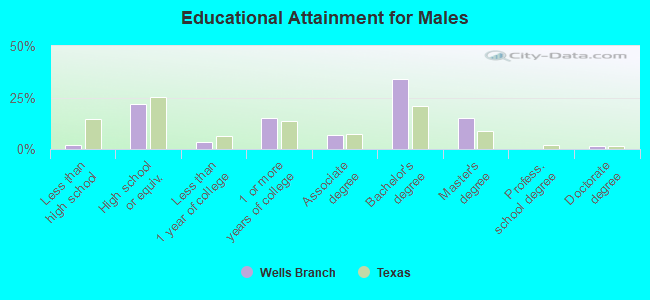
Education attainment for males 25 years and older:
No schooling: 1Nursery to 4th grade: 05th and 6th grade: 137th and 8th grade: 29th grade: 010th grade: 1611th grade: 012th grade, no diploma: 71High school graduate (or equivalency): 1,271Less than 1 year of college: 194Some college more than 1 year, no degree: 888Associate degree: 395Bachelor's degree: 1,982Master's degree: 883Professional school degree: 7Doctorate degree: 84
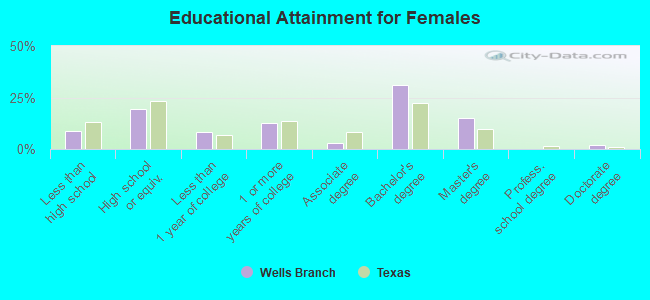
Education attainment for females 25 years and older:
No schooling: 172Nursery to 4th grade: 405th and 6th grade: 657th and 8th grade: 199th grade: 010th grade: 2611th grade: 1112th grade, no diploma: 84High school graduate (or equivalency): 930Less than 1 year of college: 385Some college more than 1 year, no degree: 603Associate degree: 134Bachelor's degree: 1,494Master's degree: 730Professional school degree: 0Doctorate degree: 88
Housing units in structures:
One, detached: 2,739One, attached: 111Two: 823 or 4: 2125 to 9: 93810 to 19: 1,71420 to 49: 1,06850 or more: 1,226Housing units lacking complete plumbing facilities in 2022: 0.3%Housing units lacking complete kitchen facilities in 2022: 0.3%House/condo owner moved in on average 9 years ago
Renter moved in on average 1 years ago
Private vs. public school enrollment:
Students in private schools in grades 1 to 8 (elementary and middle school): 258 Students in private schools in grades 9 to 12 (high school): 67 Students in private undergraduate colleges: 38