Median price asked for vacant for-sale houses and condos in 2022 in this county: $227,012.
Median contract rent in 2022: $1,030 (lower quartile is $756, upper quartile is $1,441)
Median rent asked for vacant for-rent units in 2022: $557
Median gross rent in West Greenwich, RI in 2022: $1,092
Housing units in West Greenwich with a mortgage: 1,144 (80 second mortgage, 226 home equity loan, 0 both second mortgage and home equity loan) Houses without a mortgage: 194
Compare current foreclosures near West Greenwich, RI:
In family households: 134,056 (29,767 male householders, 13,980 female householders)
33,027 spouses, 45,492 children (42,195 natural, 1,247 adopted, 2,050 stepchildren), 2,725 grandchildren, 1,292 brothers or sisters, 1,670 parents, foster children, 1,312 other relatives, 3,703 non-relatives
In nonfamily households: 30,566 (10,946 male householders (8,254 living alone)), 13,952 female householders (11,819 living alone)), 5,668 nonrelatives
In group quarters: 1,536 (1,255 institutionalized population)
28,199 married couples with children.
7,812 single-parent households (1,777 men, 6,035 women).
95.9% of residents of West Greenwich speak English at home.
1.7% of residents speak Spanish at home (66% speak English very well, 14% speak English well, 20% speak English not well).
1.9% of residents speak other Indo-European language at home (93% speak English very well, 7% speak English not well).
0.4% of residents speak Asian or Pacific Island language at home (100% speak English very well).
0.1% of residents speak other language at home (100% speak English very well).
Foreign born population: 166 (3.2%)
(50.6% of them are naturalized citizens)
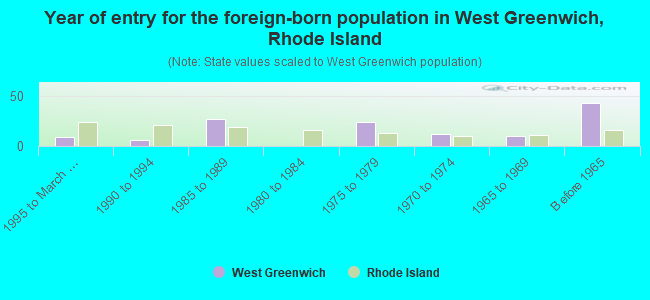
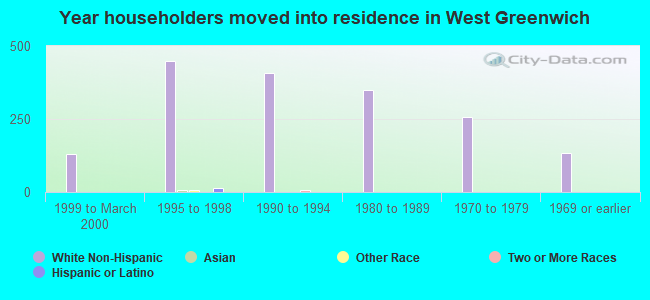
Year of entry for the foreign-born population in West Greenwich, Rhode Island
91995 to March 2000
61990 to 1994
271985 to 1989
01980 to 1984
241975 to 1979
121970 to 1974
101965 to 1969
43Before 1965
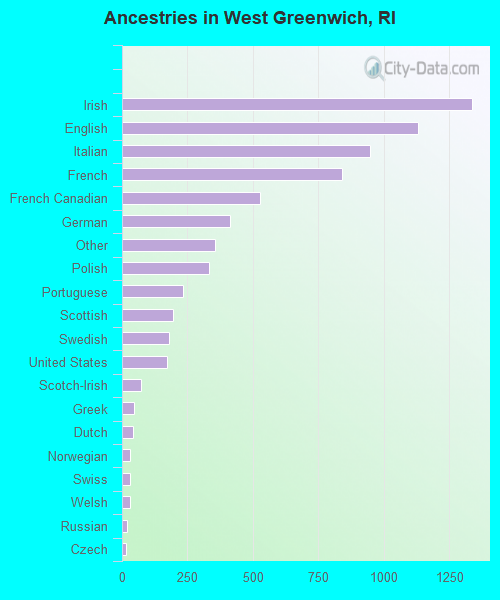
First ancestries reported:
Irish: 1,336 (19.1%)
English: 1,131 (16.2%)
Italian: 949 (13.6%)
French: 842 (12.0%)
French Canadian: 527 (7.5%)
German: 412 (5.9%)
Other: 354 (5.1%)
Polish: 331 (4.7%)
Portuguese: 233 (3.3%)
Scottish: 196 (2.8%)
Swedish: 181 (2.6%)
United States: 171 (2.4%)
Scotch-Irish: 73 (1.0%)
Greek: 46 (0.7%)
Dutch: 41 (0.6%)
Norwegian: 32 (0.5%)
Swiss: 32 (0.5%)
Welsh: 32 (0.5%)
Russian: 21 (0.3%)
Czech: 15 (0.2%)
Slovak: 12 (0.2%)
Lithuanian: 11 (0.2%)
Arab: 6 (0.09%)
Hungarian: 6 (0.09%)
Subsaharan African: 6 (0.09%)
Most common places of birth for foreign-born residents (%):
Canada
West Greenwich:
26.7% (35)
Rhode Island:
3.4% (4,015)
Korea
West Greenwich:
9.2% (12)
Rhode Island:
1.2% (1,404)
Turkey
West Greenwich:
9.2% (12)
Rhode Island:
0.4% (509)
Dominican Republic
West Greenwich:
9.2% (12)
Rhode Island:
13.7% (16,382)
Mexico
West Greenwich:
9.2% (12)
Rhode Island:
2.1% (2,510)
Germany
West Greenwich:
8.4% (11)
Rhode Island:
1.7% (1,982)
France
West Greenwich:
6.9% (9)
Rhode Island:
0.6% (730)
United Kingdom
West Greenwich:
4.6% (6)
Rhode Island:
2.6% (3,120)
Italy
West Greenwich:
4.6% (6)
Rhode Island:
3.8% (4,502)
Other Western Africa
West Greenwich:
4.6% (6)
Rhode Island:
7.0% (8,389)
Ireland
West Greenwich:
3.8% (5)
Rhode Island:
0.8% (911)
Portugal
West Greenwich:
3.8% (5)
Rhode Island:
17.6% (21,016)
Place of birth for U.S.-born residents:
This state: 3,817
Other state: 1,156
Northeast: 784
Midwest: 133
South: 156
West: 83
67% of West Greenwich residents lived in the same house 5 years ago. Out of people who lived in different houses, 44% lived in this county. Out of people who lived in different counties, 54% lived in Rhode Island.
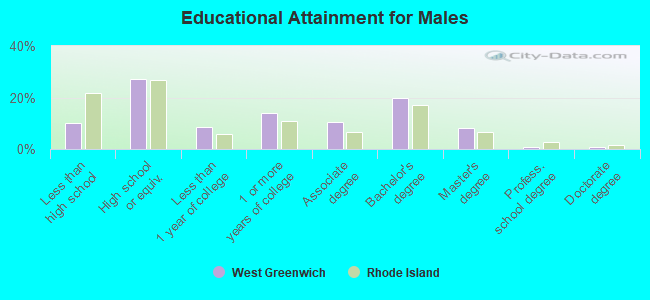
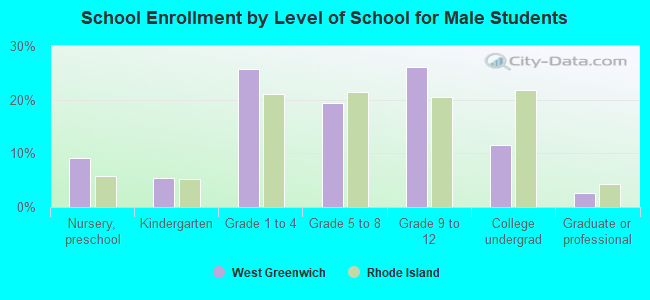
Education attainment for males 25 years and older:
No schooling: 0
Nursery to 4th grade: 6
5th and 6th grade: 6
7th and 8th grade: 37
9th grade: 36
10th grade: 31
11th grade: 33
12th grade, no diploma: 17
High school graduate (or equivalency): 445
Less than 1 year of college: 141
Some college more than 1 year, no degree: 229
Associate degree: 171
Bachelor's degree: 328
Master's degree: 132
Professional school degree: 16
Doctorate degree: 14
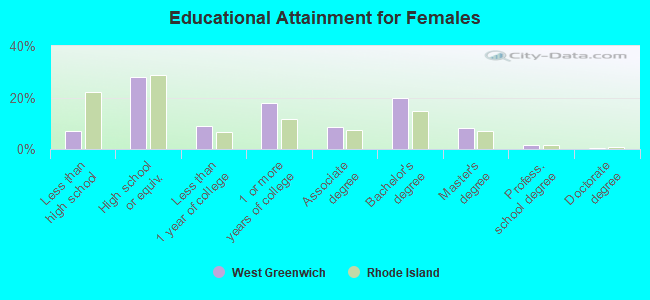
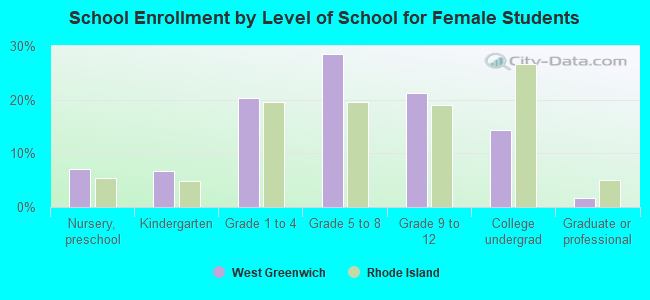
Education attainment for females 25 years and older: