Westford, VT (Vermont) Houses and Residents
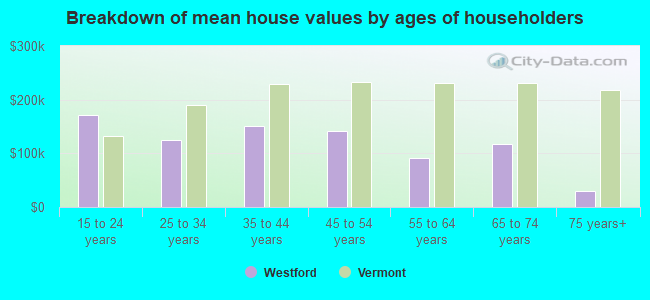
| Westford: | $408,242 |
| Vermont: | $304,700 |
Total population: 2,029 (Urban population: 0, Rural population: 2,086 (86 farm, 2,000 nonfarm))
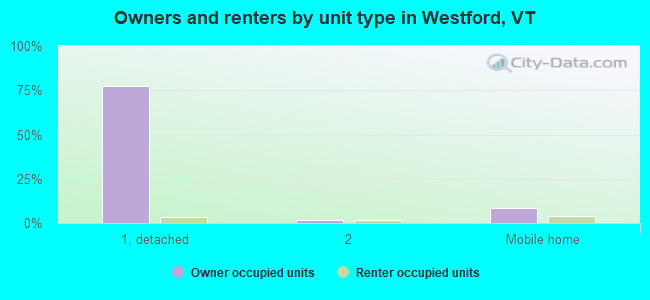
Houses: 750 (725 occupied: 654 owner occupied, 71 renter occupied)
| % of renters here: | 10% |
| State: | 26% |
Housing density: 19 houses/condos per square mile
Median price asked for vacant for-sale houses and condos in 2022 in this county: $706,355.
Median contract rent in 2022: $1,173 (lower quartile is $932, upper quartile is $1,309)
Median rent asked for vacant for-rent units in 2022: $1,341
Median gross rent in Westford, VT in 2022: $1,399
Housing units in Westford with a mortgage: 195 (14 second mortgage, 23 home equity loan, 0 both second mortgage and home equity loan)
Houses without a mortgage: 45
Compare current foreclosures near Westford, VT:
| Photo | Address | Area | Beds / Baths | Price | Details |
|---|---|---|---|---|---|

|
#1
Old Stage Rd
Westford, VT 05494
|
- sq. feet
|
- baths - beds |
show details | |

|
#2
Roosevelt Hwy Apt 111
Colchester, VT 05446
|
- sq. feet
|
- baths - beds |
show details | |

|
#3
Shelburne Rd # 309
South Burlington, VT 05403
|
- sq. feet
|
- baths - beds |
show details | |

|
#4
Eastwood Dr Apt 206
South Burlington, VT 05403
|
- sq. feet
|
- baths - beds |
show details | |

|
#5
Elizabeth St
Saint Albans, VT 05478
|
- sq. feet
|
- baths - beds |
show details | |

|
#6
Pine St Apt 2
Burlington, VT 05401
|
- sq. feet
|
- baths - beds |
show details | |

|
#7
Sandra Cir
Burlington, VT 05408
|
- sq. feet
|
- baths - beds |
show details | |

|
#8
Elmwood Ave Apt 8
Burlington, VT 05401
|
- sq. feet
|
- baths - beds |
show details | |

|
#9
Hinesburg Rd Apt 103
South Burlington, VT 05403
|
- sq. feet
|
- baths - beds |
show details | |

|
#10
Williston Rd
South Burlington, VT 05403
|
- sq. feet
|
- baths - beds |
show details |
| Photo | Address | Area | Beds / Baths | Price | Details |
|---|---|---|---|---|---|

|
#11
Hibbard Rd
Milton, VT 05468
|
- sq. feet
|
- baths - beds |
show details | |

|
#12
W Allen St Apt 35f
Winooski, VT 05404
|
- sq. feet
|
- baths - beds |
show details | |

|
#13
Us Route 2
Grand Isle, VT 05458
|
- sq. feet
|
- baths - beds |
show details | |

|
#14
Windcrest Road
Milton, VT 05468
|
- sq. feet
|
- baths - beds |
show details | |

|
#15
Lapierre Dr
Milton, VT 05468
|
- sq. feet
|
- baths - beds |
show details | |

|
#16
Johnsons Ct # 202
Milton, VT 05468
|
- sq. feet
|
- baths - beds |
show details | |

|
#17
Elm St
Essex Junction, VT 05452
|
- sq. feet
|
- baths - beds |
show details | |

|
#18
Esplanade
Richmond, VT 05477
|
- sq. feet
|
- baths - beds |
show details | |

|
#19
Main St
Fairfax, VT 05454
|
- sq. feet
|
- baths - beds |
show details | |

|
#20
Walnut St
Saint Albans, VT 05478
|
- sq. feet
|
- baths - beds |
show details |
| Photo | Address | Area | Beds / Baths | Price | Details |
|---|---|---|---|---|---|

|
#21
Willowbrook Ln
Williston, VT 05495
|
- sq. feet
|
- baths - beds |
show details | |

|
#22
Lake St
Saint Albans, VT 05478
|
- sq. feet
|
- baths - beds |
show details | |

|
#23
Lincoln Ave
Saint Albans, VT 05478
|
- sq. feet
|
- baths - beds |
show details | |

|
#24
Potter Ave
Saint Albans, VT 05478
|
- sq. feet
|
- baths - beds |
show details | |

|
#25
Kingsbury Xing
Milton, VT 05468
|
- sq. feet
|
- baths - beds |
show details | |

|
#26
Vt Route 15
Jericho, VT 05465
|
- sq. feet
|
- baths - beds |
show details | |

|
#27
Woodcrest Cir
Milton, VT 05468
|
- sq. feet
|
- baths - beds |
show details | |

|
#28
Crossfield Dr
Colchester, VT 05446
|
- sq. feet
|
- baths - beds |
show details | |

|
#29
Bayview St
Burlington, VT 05401
|
- sq. feet
|
- baths - beds |
show details | |

|
#30
Briar Ln
Essex Junction, VT 05452
|
- sq. feet
|
- baths - beds |
show details |
| Photo | Address | Area | Beds / Baths | Price | Details |
|---|---|---|---|---|---|

|
#31
Mountain View Rd
Williston, VT 05495
|
- sq. feet
|
- baths - beds |
show details | |

|
#32
Shady Ln
Colchester, VT 05446
|
- sq. feet
|
- baths - beds |
show details | |

|
#33
Ridge Rd
Essex Junction, VT 05452
|
- sq. feet
|
- baths - beds |
show details | |

|
#34
Route 7 N
Milton, VT 05468
|
- sq. feet
|
- baths - beds |
show details | |

|
#35
Stage Rd
Jericho, VT 05465
|
- sq. feet
|
- baths - beds |
show details | |

|
#36
Barrett St
South Burlington, VT 05403
|
- sq. feet
|
- baths - beds |
show details | |

|
#37
Pleasant Valley Rd
Underhill, VT 05489
|
- sq. feet
|
- baths - beds |
show details | |

|
#38
Mckinlee Ln
Saint Albans, VT 05478
|
- sq. feet
|
- baths - beds |
show details | |

|
#39
Old Academy St # 102
Fairfax, VT 05454
|
- sq. feet
|
- baths - beds |
show details | |

|
#40
Lafountain St
Winooski, VT 05404
|
- sq. feet
|
- baths - beds |
show details |
| Photo | Address | Area | Beds / Baths | Price | Details |
|---|---|---|---|---|---|

|
#41
Village Grv
Williston, VT 05495
|
- sq. feet
|
- baths - beds |
show details | |

|
#42
Stonybrook Dr
Williston, VT 05495
|
- sq. feet
|
- baths - beds |
show details | |

|
#43
Edgewood Dr
Colchester, VT 05446
|
- sq. feet
|
- baths - beds |
show details | |

|
#44
Colchester Rd
Essex Junction, VT 05452
|
- sq. feet
|
- baths - beds |
show details | |

|
Check over 1 million property listings on Foreclosure.com!
|
browse all offers | |||
Latest news about housing in Westford, VT collected exclusively by city-data.com from local newspapers, TV, and radio stations

 | Apartment in a scenic town within 30 min drive of South Burlington? (3 replies) |
| Essex Vermont (few questions for a Essex Local) (6 replies) |
| Job Advice (3 replies) |
| Where to settle Islands or Essex? (13 replies) |

Household type by relationship:
Households: 146,750- In family households: 109,943 (24,793 male householders, 11,789 female householders)
28,660 spouses, 37,454 children (34,847 natural, 1,395 adopted, 1,212 stepchildren), 1,289 grandchildren, 800 brothers or sisters, 735 parents, foster children, 675 other relatives, 3,212 non-relatives
- In nonfamily households: 36,807 (11,423 male householders (7,248 living alone)), 13,822 female householders (9,861 living alone)), 11,562 nonrelatives
- In group quarters: 9,795 (1,163 institutionalized population)
25,754 married couples with children.
6,932 single-parent households (1,683 men, 5,249 women).
94.7% of residents of Westford speak English at home.
1.4% of residents speak Spanish at home (86% speak English very well, 14% speak English well).
3.7% of residents speak other Indo-European language at home (65% speak English very well, 32% speak English well, 3% speak English not well).
0.1% of residents speak Asian or Pacific Island language at home (100% speak English well).
Foreign born population: 113 (4.7%)
(60.2% of them are naturalized citizens)
| Here: | 6.3 |
| State: | 6.4 |
| Here: | 4.9 |
| State: | 3.9 |
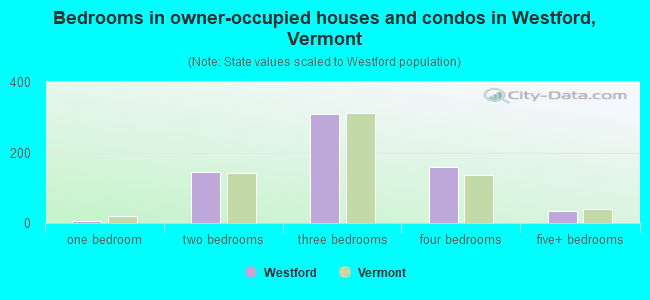
- Bedrooms in owner-occupied houses and condos in Westford, Vermont
- 2no bedroom
- 61 bedroom
- 1452 bedrooms
- 3103 bedrooms
- 1584 bedrooms
- 335+ bedrooms
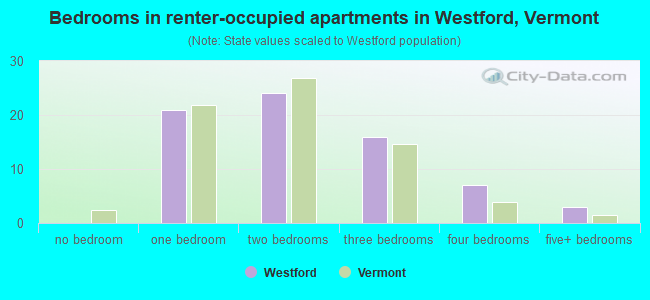
- Bedrooms in renter-occupied apartments in Westford, Vermont
- 0no bedroom
- 211 bedroom
- 242 bedrooms
- 163 bedrooms
- 74 bedrooms
- 35+ bedrooms
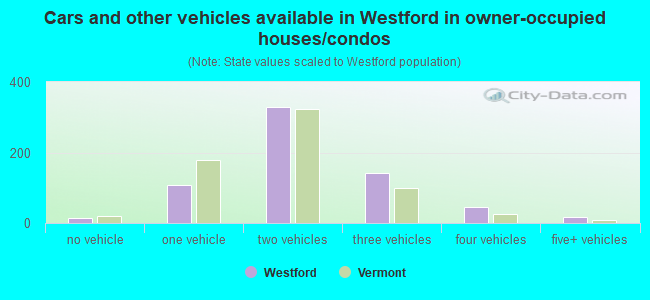
- Cars and other vehicles available in Westford in owner-occupied houses/condos
- 14no vehicle
- 1081 vehicle
- 3282 vehicles
- 1433 vehicles
- 454 vehicles
- 165+ vehicles
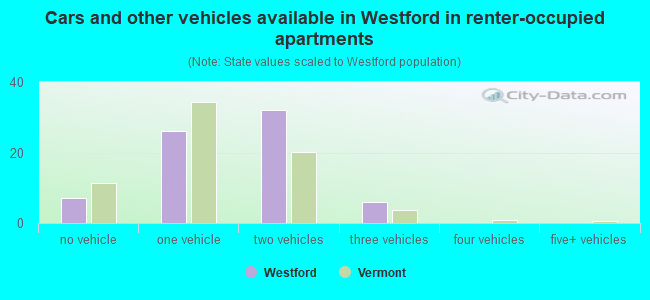
- Cars and other vehicles available in Westford in renter-occupied apartments
- 7no vehicle
- 261 vehicle
- 322 vehicles
- 63 vehicles
- 04 vehicles
- 05+ vehicles
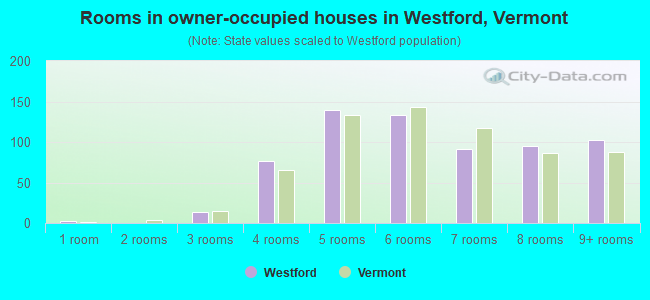
- Rooms in owner-occupied houses in Westford, Vermont
- 21 room
- 02 rooms
- 143 rooms
- 774 rooms
- 1395 rooms
- 1336 rooms
- 917 rooms
- 958 rooms
- 1039+ rooms
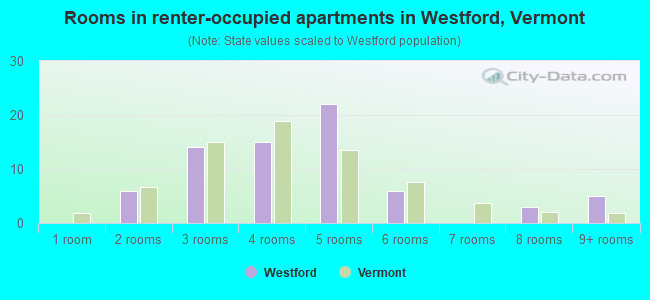
- Rooms in renter-occupied apartments in Westford, Vermont
- 01 room
- 62 rooms
- 143 rooms
- 154 rooms
- 225 rooms
- 66 rooms
- 07 rooms
- 38 rooms
- 59+ rooms
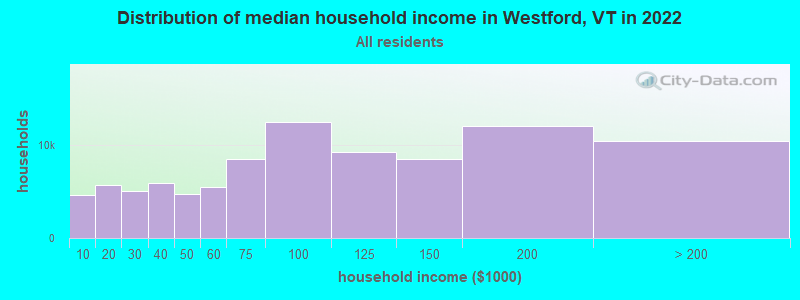
Westford, VT household income distribution

- 4,587Less than $10,000
- 5,679$10,000 to $19,999
- 5,095$20,000 to $29,999
- 5,880$30,000 to $39,999
- 4,761$40,000 to $49,999
- 5,508$50,000 to $59,999
- 8,525$60,000 to $74,999
- 12,476$75,000 to $99,999
- 9,214$100,000 to $124,999
- 8,449$125,000 to $149,999
- 11,996$150,000 to $199,999
- 10,404$200,000 or more
Percentage of workers working in this county: 87.4%
Number of people working at home: 242 (16.8% of all workers)
Travel time to work (commute)
- Less than 5 minutes: 25
- 5 to 9 minutes: 38
- 10 to 14 minutes: 66
- 15 to 19 minutes: 82
- 20 to 24 minutes: 193
- 25 to 29 minutes: 143
- 30 to 34 minutes: 240
- 35 to 39 minutes: 73
- 40 to 44 minutes: 75
- 45 to 59 minutes: 104
- 60 to 89 minutes: 35
- 90 or more minutes: 22
Means of transportation to work:
- Drove a car alone: 934 (79.8%)
- Carpooled: 132 (11.3%)
- Bus or trolley bus: 7 (0.6%)
- Bicycle: 2 (0.2%)
- Walked: 19 (1.6%)
- Other means: 2 (0.2%)
- Worked at home: 75 (6.4%)
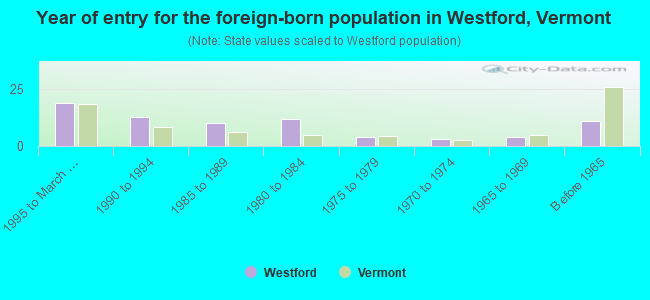
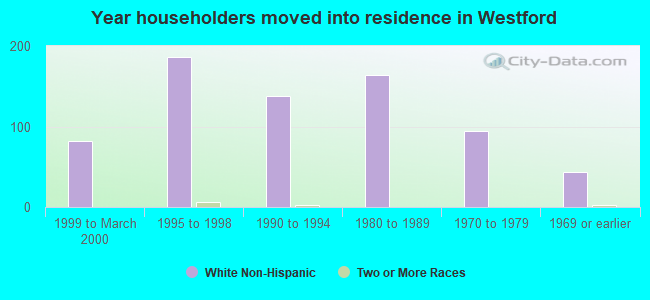
- Year of entry for the foreign-born population in Westford, Vermont
- 191995 to March 2000
- 131990 to 1994
- 101985 to 1989
- 121980 to 1984
- 41975 to 1979
- 31970 to 1974
- 41965 to 1969
- 11Before 1965
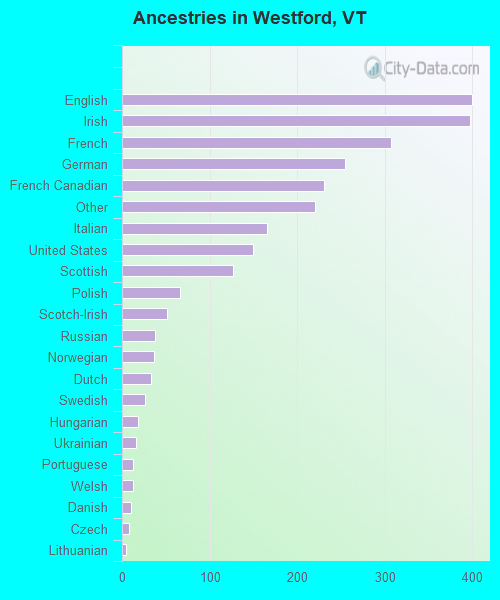
First ancestries reported:
- English: 399 (15.4%)
- Irish: 397 (15.3%)
- French: 307 (11.8%)
- German: 255 (9.8%)
- French Canadian: 231 (8.9%)
- Other: 220 (8.5%)
- Italian: 166 (6.4%)
- United States: 150 (5.8%)
- Scottish: 127 (4.9%)
- Polish: 66 (2.5%)
- Scotch-Irish: 51 (2.0%)
- Russian: 38 (1.5%)
- Norwegian: 37 (1.4%)
- Dutch: 33 (1.3%)
- Swedish: 26 (1.0%)
- Hungarian: 18 (0.7%)
- Ukrainian: 16 (0.6%)
- Portuguese: 13 (0.5%)
- Welsh: 13 (0.5%)
- Danish: 10 (0.4%)
- Czech: 8 (0.3%)
- Lithuanian: 5 (0.2%)
- West Indian: 3 (0.1%)
- Arab: 2 (0.08%)
- Greek: 2 (0.08%)
- Subsaharan African: 2 (0.08%)
- Swiss: 2 (0.08%)
Most common places of birth for foreign-born residents (%):
| Westford: | 18.4% (14) |
| Vermont: | 34.0% (7,912) |
| Westford: | 13.2% (10) |
| Vermont: | 7.5% (1,744) |
| Westford: | 11.8% (9) |
| Vermont: | 7.2% (1,669) |
| Westford: | 7.9% (6) |
| Vermont: | 1.7% (400) |
| Westford: | 7.9% (6) |
| Vermont: | 1.6% (381) |
| Westford: | 7.9% (6) |
| Vermont: | 2.5% (585) |
| Westford: | 7.9% (6) |
| Vermont: | 0.2% (51) |
| Westford: | 3.9% (3) |
| Vermont: | 1.2% (268) |
| Westford: | 3.9% (3) |
| Vermont: | 0.3% (67) |
| Westford: | 2.6% (2) |
| Vermont: | 1.0% (226) |
| Westford: | 2.6% (2) |
| Vermont: | 0.6% (129) |
| Westford: | 2.6% (2) |
| Vermont: | 0.2% (40) |
| Westford: | 2.6% (2) |
| Vermont: | 0.5% (106) |
| Westford: | 2.6% (2) |
| Vermont: | 0.2% (45) |
| Westford: | 2.6% (2) |
| Vermont: | 0.5% (108) |
Place of birth for U.S.-born residents:
- This state: 1,157
- Other state: 818
- Northeast: 568
- Midwest: 111
- South: 86
- West: 53
71% of Westford residents lived in the same house 5 years ago.
Out of people who lived in different houses, 55% lived in this county.
Out of people who lived in different counties, 54% lived in Vermont.
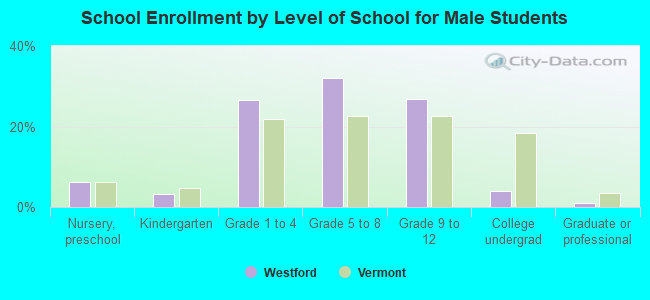
Education attainment for males 25 years and older:
- No schooling: 2
- Nursery to 4th grade: 0
- 5th and 6th grade: 0
- 7th and 8th grade: 27
- 9th grade: 12
- 10th grade: 7
- 11th grade: 19
- 12th grade, no diploma: 14
- High school graduate (or equivalency): 167
- Less than 1 year of college: 25
- Some college more than 1 year, no degree: 66
- Associate degree: 62
- Bachelor's degree: 168
- Master's degree: 62
- Professional school degree: 27
- Doctorate degree: 22

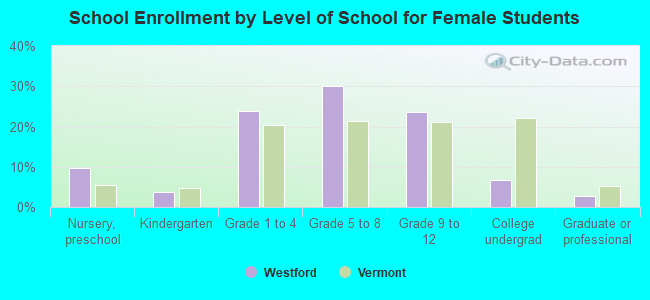
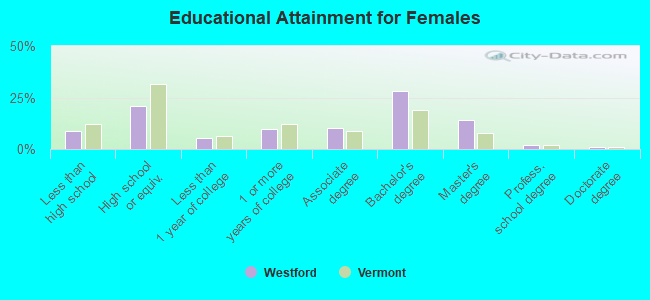
Education attainment for females 25 years and older:
- No schooling: 0
- Nursery to 4th grade: 4
- 5th and 6th grade: 0
- 7th and 8th grade: 24
- 9th grade: 16
- 10th grade: 3
- 11th grade: 3
- 12th grade, no diploma: 9
- High school graduate (or equivalency): 144
- Less than 1 year of college: 36
- Some college more than 1 year, no degree: 65
- Associate degree: 70
- Bachelor's degree: 192
- Master's degree: 97
- Professional school degree: 14
- Doctorate degree: 6


Housing units in structures:
- One, detached: 605
- One, attached: 9
- Two: 25
- 3 or 4: 11
- 10 to 19: 3
- Mobile homes: 96
- Boats, RVs, vans, etc.: 1
Median worth of mobile homes: $68,201
Housing units lacking complete kitchen facilities: 0.7%
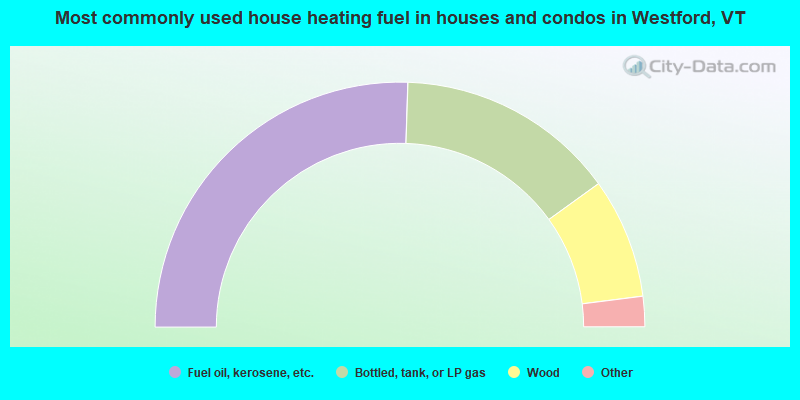
- 51.1%Fuel oil, kerosene, etc.
- 29.1%Bottled, tank, or LP gas
- 15.9%Wood
- 2.1%Utility gas
- 1.1%Other fuel
- 0.5%Electricity
- 0.3%Coal or coke
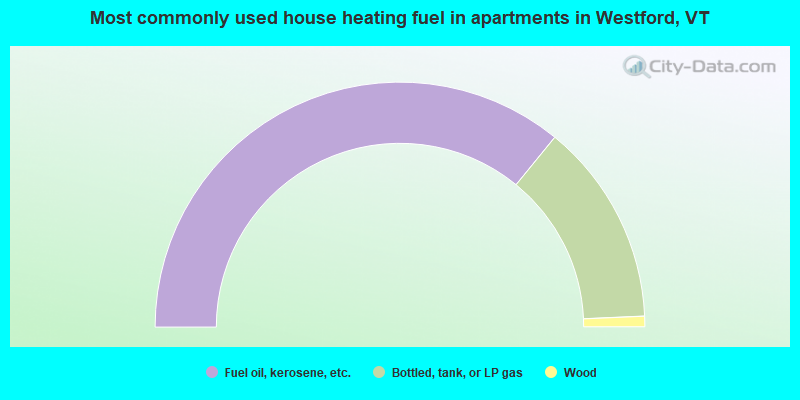
- 71.8%Fuel oil, kerosene, etc.
- 26.8%Bottled, tank, or LP gas
- 1.4%Wood
Private vs. public school enrollment:
| Here: | 4.3% |
| Vermont: | 7.2% |
| Here: | 3.4% |
| Vermont: | 10.4% |
| Here: | 19.4% |
| Vermont: | 37.7% |