Westmore, VT (Vermont) Houses and Residents
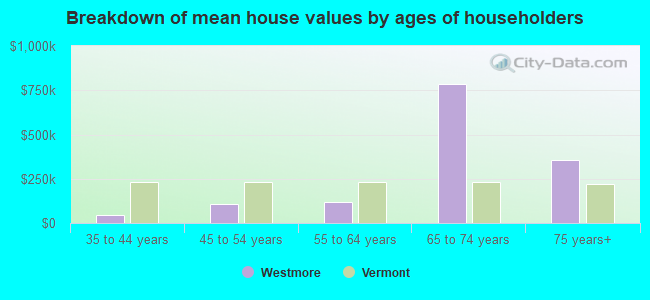
| Westmore: | $239,516 |
| Vermont: | $304,700 |
Total population: 350 (Urban population: 0, Rural population: 338 (6 farm, 332 nonfarm))
Houses: 536 (138 occupied: 113 owner occupied, 25 renter occupied)
| % of renters here: | 18% |
| State: | 26% |
Housing density: 16 houses/condos per square mile
Median price asked for vacant for-sale houses and condos in 2022 in this county: $197,886.
Median contract rent in 2022: $855 (lower quartile is $798, upper quartile is $1,031)
Median rent asked for vacant for-rent units in 2022: $1,026
Median gross rent in Westmore, VT in 2022: $1,008
Housing units in Westmore with a mortgage: 36 (2 second mortgage, 0 home equity loan, 0 both second mortgage and home equity loan)
Houses without a mortgage: 26


Latest news about housing in Westmore, VT collected exclusively by city-data.com from local newspapers, TV, and radio stations

 | How is the Barton/Westmore area to live in? (4 replies) |

Household type by relationship:
Households: 26,413- In family households: 21,371 (5,129 male householders, 2,169 female householders)
5,656 spouses, 6,697 children (6,082 natural, 229 adopted, 386 stepchildren), 334 grandchildren, 119 brothers or sisters, 162 parents, foster children, 130 other relatives, 867 non-relatives
- In nonfamily households: 5,042 (2,023 male householders (1,486 living alone)), 1,999 female householders (1,659 living alone)), 1,020 nonrelatives
- In group quarters: 818 (679 institutionalized population)
4,545 married couples with children.
1,627 single-parent households (444 men, 1,183 women).
95.7% of residents of Westmore speak English at home.
4.3% of residents speak other Indo-European language at home (79% speak English very well, 21% speak English not well).
Foreign born population: 3 (0.8%)
(100.0% of them are naturalized citizens)
| Here: | 5.3 |
| State: | 6.4 |
| Here: | 5.4 |
| State: | 3.9 |
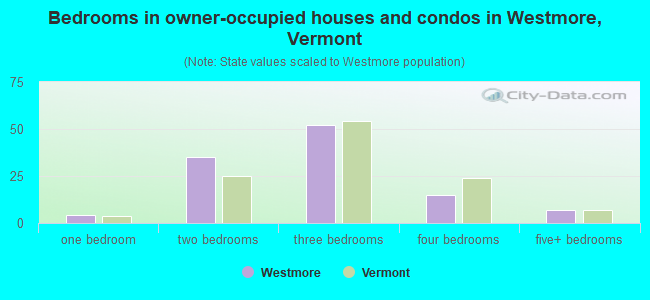
- Bedrooms in owner-occupied houses and condos in Westmore, Vermont
- 0no bedroom
- 41 bedroom
- 352 bedrooms
- 523 bedrooms
- 154 bedrooms
- 75+ bedrooms
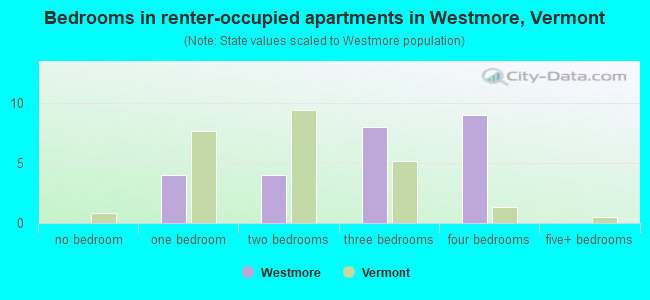
- Bedrooms in renter-occupied apartments in Westmore, Vermont
- 0no bedroom
- 41 bedroom
- 42 bedrooms
- 83 bedrooms
- 94 bedrooms
- 05+ bedrooms
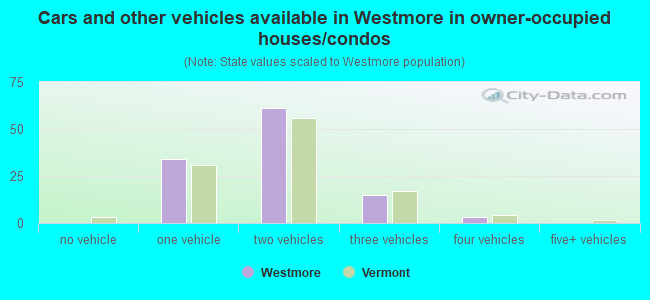
- Cars and other vehicles available in Westmore in owner-occupied houses/condos
- 0no vehicle
- 341 vehicle
- 612 vehicles
- 153 vehicles
- 34 vehicles
- 05+ vehicles
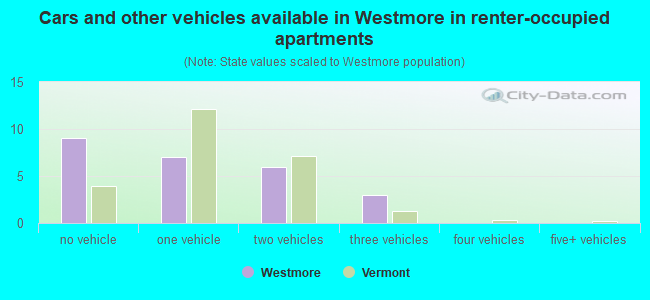
- Cars and other vehicles available in Westmore in renter-occupied apartments
- 9no vehicle
- 71 vehicle
- 62 vehicles
- 33 vehicles
- 04 vehicles
- 05+ vehicles
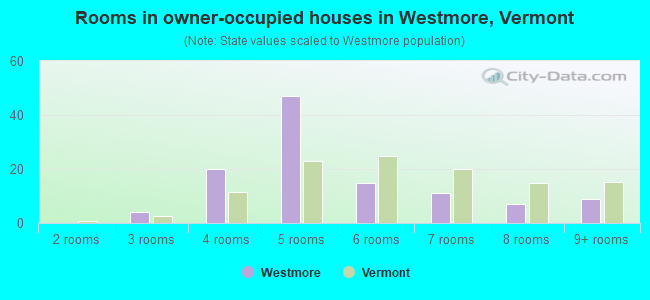
- Rooms in owner-occupied houses in Westmore, Vermont
- 01 room
- 02 rooms
- 43 rooms
- 204 rooms
- 475 rooms
- 156 rooms
- 117 rooms
- 78 rooms
- 99+ rooms
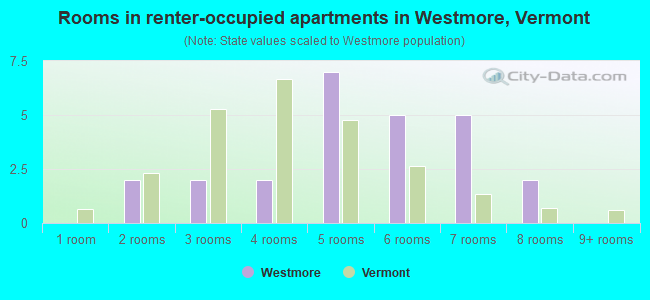
- Rooms in renter-occupied apartments in Westmore, Vermont
- 01 room
- 22 rooms
- 23 rooms
- 24 rooms
- 75 rooms
- 56 rooms
- 57 rooms
- 28 rooms
- 09+ rooms
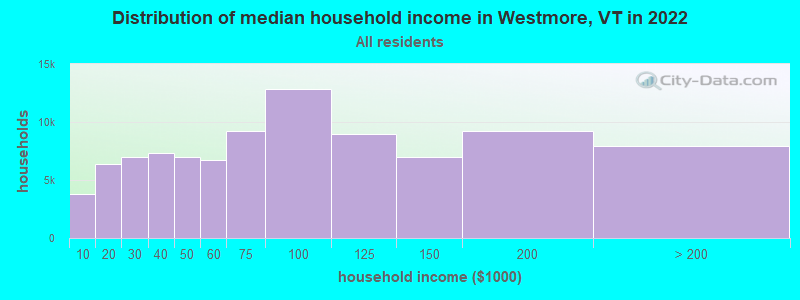
Westmore, VT household income distribution

- 3,373Less than $10,000
- 6,888$10,000 to $19,999
- 7,907$20,000 to $29,999
- 9,203$30,000 to $39,999
- 8,536$40,000 to $49,999
- 8,318$50,000 to $59,999
- 11,071$60,000 to $74,999
- 16,757$75,000 to $99,999
- 11,096$100,000 to $124,999
- 8,859$125,000 to $149,999
- 11,249$150,000 to $199,999
- 10,161$200,000 or more
Percentage of workers working in this county: 77.3%
Number of people working at home: 28 (17.2% of all workers)
Travel time to work (commute)
- Less than 5 minutes: 12
- 5 to 9 minutes: 5
- 10 to 14 minutes: 10
- 15 to 19 minutes: 34
- 20 to 24 minutes: 14
- 25 to 29 minutes: 12
- 30 to 34 minutes: 18
- 35 to 39 minutes: 5
- 40 to 44 minutes: 4
- 45 to 59 minutes: 6
- 60 to 89 minutes: 6
- 90 or more minutes: 3
Means of transportation to work:
- Drove a car alone: 113 (75.3%)
- Carpooled: 9 (6.0%)
- Walked: 7 (4.7%)
- Worked at home: 21 (14.0%)
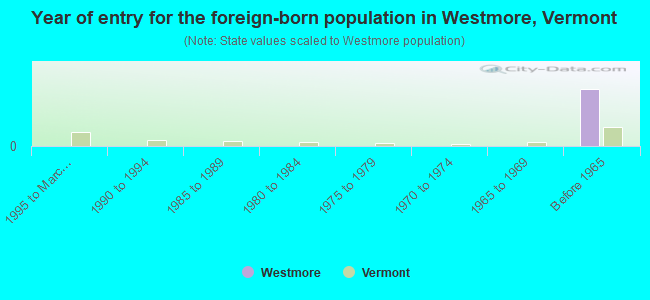
- Year of entry for the foreign-born population in Westmore, Vermont
- 01995 to March 2000
- 01990 to 1994
- 01985 to 1989
- 01980 to 1984
- 01975 to 1979
- 01970 to 1974
- 01965 to 1969
- 3Before 1965
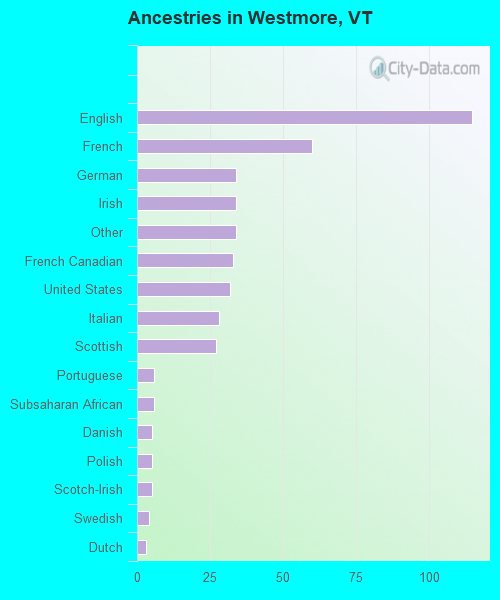
First ancestries reported:
- English: 115 (26.7%)
- French: 60 (13.9%)
- German: 34 (7.9%)
- Irish: 34 (7.9%)
- Other: 34 (7.9%)
- French Canadian: 33 (7.7%)
- United States: 32 (7.4%)
- Italian: 28 (6.5%)
- Scottish: 27 (6.3%)
- Portuguese: 6 (1.4%)
- Subsaharan African: 6 (1.4%)
- Danish: 5 (1.2%)
- Polish: 5 (1.2%)
- Scotch-Irish: 5 (1.2%)
- Swedish: 4 (0.9%)
- Dutch: 3 (0.7%)
Most common places of birth for foreign-born residents (%):
| Westmore: | 100.0% (3) |
| Vermont: | 34.0% (7,912) |
Place of birth for U.S.-born residents:
- This state: 178
- Other state: 154
- Northeast: 118
- Midwest: 21
- South: 5
- West: 10
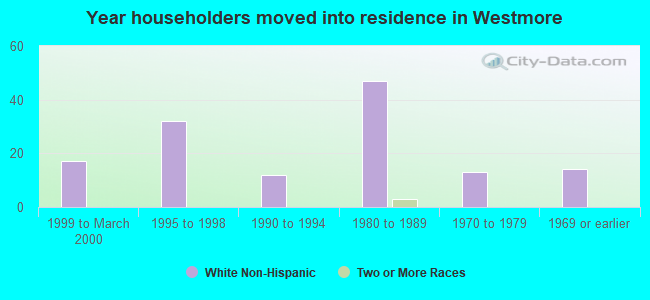
64% of Westmore residents lived in the same house 5 years ago.
Out of people who lived in different houses, 56% lived in this county.
Out of people who lived in different counties, 19% lived in Vermont.
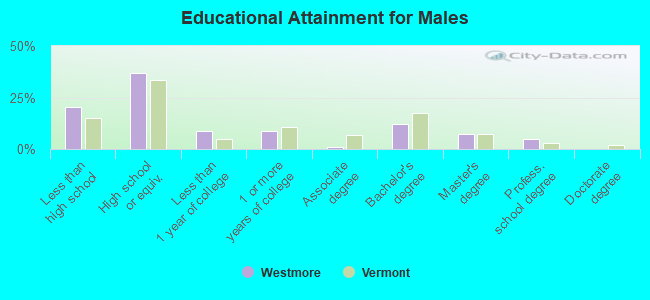
Education attainment for males 25 years and older:
- No schooling: 2
- Nursery to 4th grade: 0
- 5th and 6th grade: 0
- 7th and 8th grade: 6
- 9th grade: 4
- 10th grade: 2
- 11th grade: 9
- 12th grade, no diploma: 2
- High school graduate (or equivalency): 46
- Less than 1 year of college: 11
- Some college more than 1 year, no degree: 11
- Associate degree: 1
- Bachelor's degree: 15
- Master's degree: 9
- Professional school degree: 6
- Doctorate degree: 0
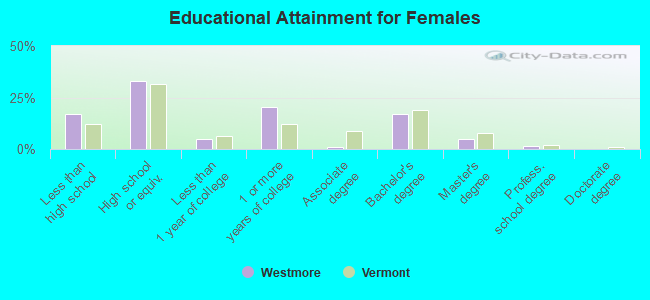
Education attainment for females 25 years and older:
- No schooling: 0
- Nursery to 4th grade: 0
- 5th and 6th grade: 0
- 7th and 8th grade: 5
- 9th grade: 5
- 10th grade: 4
- 11th grade: 7
- 12th grade, no diploma: 0
- High school graduate (or equivalency): 40
- Less than 1 year of college: 6
- Some college more than 1 year, no degree: 25
- Associate degree: 1
- Bachelor's degree: 21
- Master's degree: 6
- Professional school degree: 2
- Doctorate degree: 0


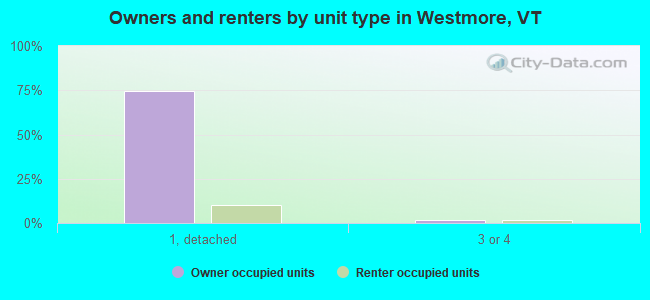
Housing units in structures:
- One, detached: 492
- One, attached: 4
- Two: 16
- 3 or 4: 6
- Mobile homes: 16
- Boats, RVs, vans, etc.: 2
Median worth of mobile homes: $21,903
Housing units lacking complete kitchen facilities: 5.2%
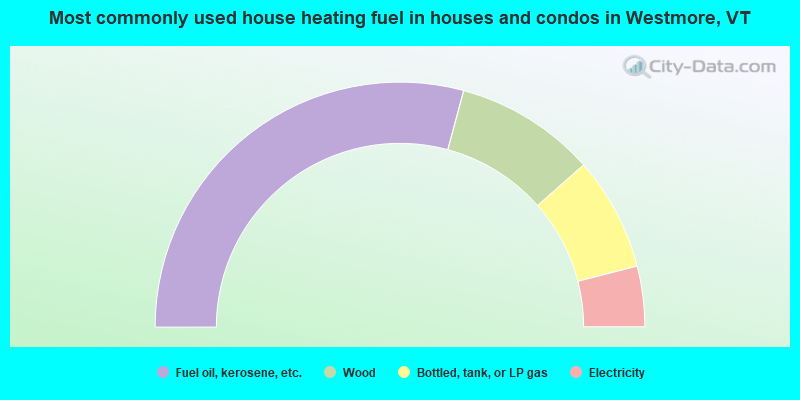
- 58.4%Fuel oil, kerosene, etc.
- 18.6%Wood
- 15.0%Bottled, tank, or LP gas
- 8.0%Electricity
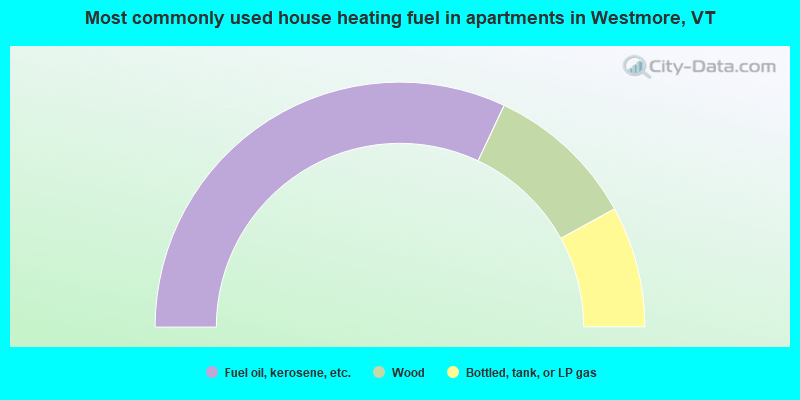
- 64.0%Fuel oil, kerosene, etc.
- 20.0%Wood
- 16.0%Bottled, tank, or LP gas
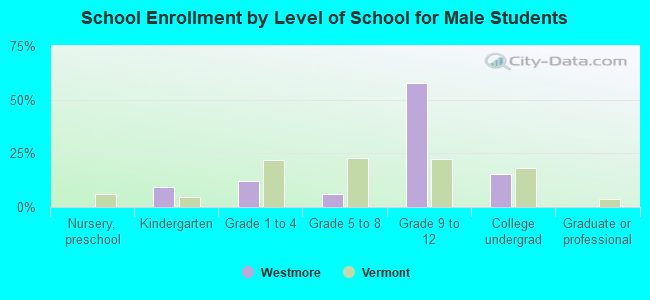
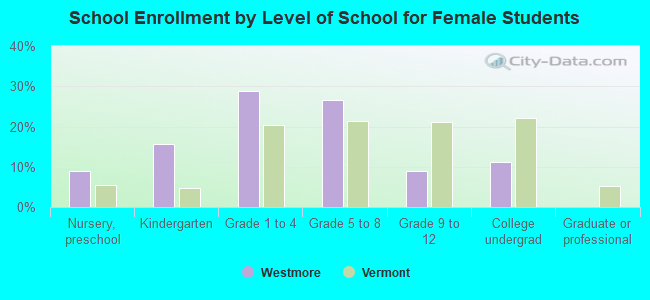
Private vs. public school enrollment:
| Here: | 22.6% |
| Vermont: | 7.2% |
| Here: | 0.0% |
| Vermont: | 10.4% |
| Here: | 20.0% |
| Vermont: | 37.7% |