Wheeling, IL (Illinois) Houses and Residents
Estimated median house or condo value in 2022: $243,213 (it was $147,600 in 2000 )
Wheeling:
$243,213Illinois:
$251,600
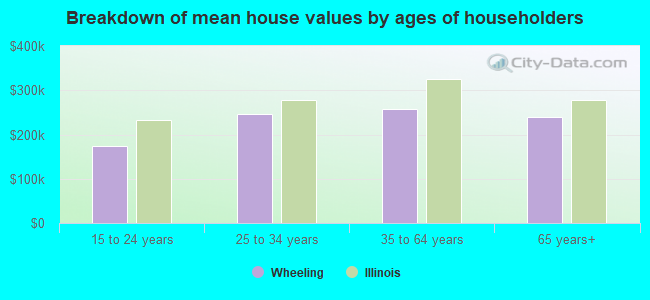
Lower value quartile - upper value quartile: $187,913 - $334,868Mean price in 2022: Detached houses: $295,301 Here:
$295,301State:
$310,164
Townhouses or other attached units: $224,961 Here:
$224,961State:
$286,230
In 3-to-4-unit structures: $205,723 Here:
$205,723State:
$330,907
In 5-or-more-unit structures: $236,125 Here:
$236,125State:
$318,887
Mobile homes: $23,088 Here:
$23,088State:
$78,855
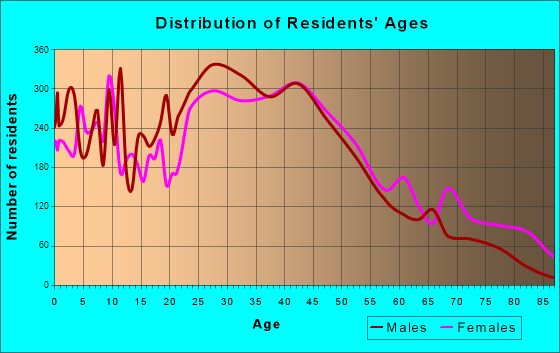
Total population: 38,010 (Urban population: 34,411, Rural population: 0)
Houses: 16,336 (15,549 occupied: 9,897 owner occupied, 5,918 renter occupied )
% of renters here:
37%State:
33%
Housing density: 1,945 houses/condos per square mile
Median price asked for vacant for-sale houses and condos in 2022: $96,343.
Median contract rent in 2022: $1,354 (lower quartile is $1,128, upper quartile is $1,716)
Median rent asked for vacant for-rent units in 2022: $1,258
Median gross rent in Wheeling, IL in 2022: $1,467
Housing units in Wheeling with a mortgage: 6,147 (544 second mortgage, 0 home equity loan, 442 both second mortgage and home equity loan )Houses without a mortgage: 168
Median household income for houses/condos with a mortgage: $91,269
Median household income for apartments without a mortgage: $74,569
Median monthly housing costs: $1,433
Data:
Median house or condo value ($)
Median house or condo value ($ change since 2000)
Median house or condo value ($) - White
Median house or condo value ($) - Black or African American
Median house or condo value ($) - Asian
Median house or condo value ($) - Hispanic or Latino
Median house or condo value ($) - American Indian and Alaska Native
Median house or condo value ($) - Multirace
Median house or condo value ($) - Other Race
Median price asked for mobile homes ($)
Household density (households per square mile)
Mean house or condo value by units in structure - 1, detached ($)
Mean house or condo value by units in structure - 1, attached ($)
Mean house or condo value by units in structure - 2 ($)
Mean house or condo value by units in structure by units in structure - 3 or 4 ($)
Mean house or condo value by units in structure - 5 or more ($)
Mean house or condo value by units in structure - Boat, RV, van, etc. ($)
Mean house or condo value by units in structure - Mobile home ($)
Median contract rent ($)
Median contract rent - Lower quartile ($)
Median contract rent - Upper quartile ($)
Median gross rent ($)
Urban houses (%)
Rural houses (%)
Houses occupied (%)
Houses occupied (% change since 2000)
Houses owner occupied (%)
Houses owner occupied (% change since 2000)
Houses renter occupied (%)
Houses renter occupied (% change since 2000)
Vacant housing units - For rent (%)
Vacant housing units - For rent (% change since 2000)
Vacant housing units - For sale only (%)
Vacant housing units - For sale only (% change since 2000)
Vacant housing units - Rented or sold, not occupied (%)
Vacant housing units - Rented or sold, not occupied (% change since 2000)
Vacant housing units - For seasonal, recreational, or occasional use (%)
Vacant housing units - For seasonal, recreational, or occasional use (% change since 2000)
Vacant housing units - For migrant workers (%)
Vacant housing units - For migrant workers (% change since 2000)
Vacant housing units - Other vacant (%)
Vacant housing units - Other vacant (% change since 2000)
Median monthly housing costs ($)
Median household income for houses/condos with a mortgage ($)
Median household income for houses/condos without a mortgage ($)
Median household income ($)
Median household income ($) - White
Median household income ($) - Black or African American
Median household income ($) - Asian
Median household income ($) - Hispanic or Latino
Median household income ($) - American Indian and Alaska Native
Median household income ($) - Multirace
Median household income ($) - Other Race
Mortgage status - with mortgage (%)
Mortgage status - with second mortgage (%)
Mortgage status - with home equity loan (%)
Mortgage status - with both second mortgage and home equity loan (%)
Mortgage status - without a mortgage (%)
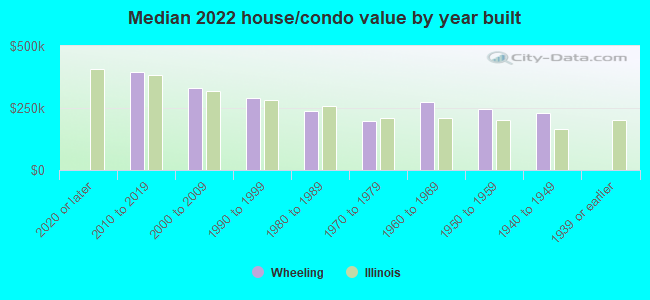
Median year house/condo built
Median year apartment built
Household type by relationship - Male householder living alone (%)
Household type by relationship - Male householder not living alone (%)
Household type by relationship - Female householder living alone (%)
Household type by relationship - Female householder not living alone (%)
Household type by relationship - Opposite-Sex spouse (%)
Household type by relationship - Same-Sex spouse (%)
Household type by relationship - Opposite-Sex unmarried partner (%)
Household type by relationship - Same-Sex unmarried partner (%)
Household type by relationship - In group quarters (%)
Size of family households - 2-person household (%)
Size of family households - 3-person household (%)
Size of family households - 4-person household (%)
Size of family households - 5-person household (%)
Size of family households - 6-person household (%)
Size of family households - 7-or-more-person household (%)
Size of nonfamily households - 1-person household (%)
Size of nonfamily households - 2-person household (%)
Size of nonfamily households - 3-person household (%)
Size of nonfamily households - 4-person household (%)
Size of nonfamily households - 5-person household (%)
Size of nonfamily households - 6-person household (%)
Size of nonfamily households - 7-or-moreperson household (%)
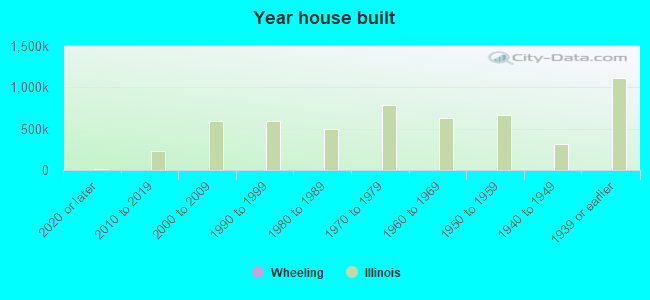
Year house built - Built 2010 or later (%)
Year house built - Built 2000 to 2009 (%)
Year house built - Built 1990 to 1999 (%)
Year house built - Built 1980 to 1989 (%)
Year house built - Built 1970 to 1979 (%)
Year house built - Built 1960 to 1969 (%)
Year house built - Built 1950 to 1959 (%)
Year house built - Built 1940 to 1949 (%)
Year house built - Built 1939 or earlier (%)
Median number of rooms in houses and condos
Median number of rooms in apartments
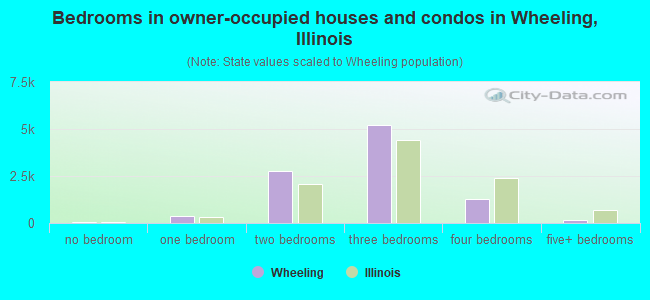
Median number of bedrooms in owner occupied houses
Mean number of bedrooms in owner occupied houses
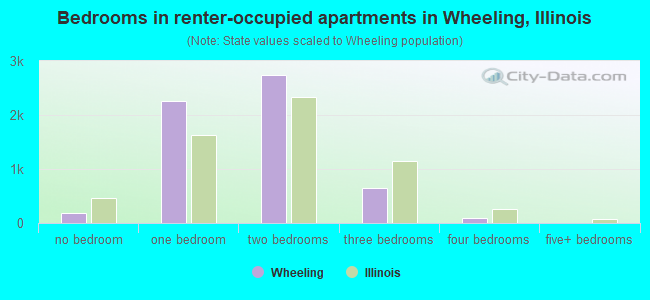
Median number of bedrooms in renter occupied houses
Mean number of bedrooms in renter occupied houses
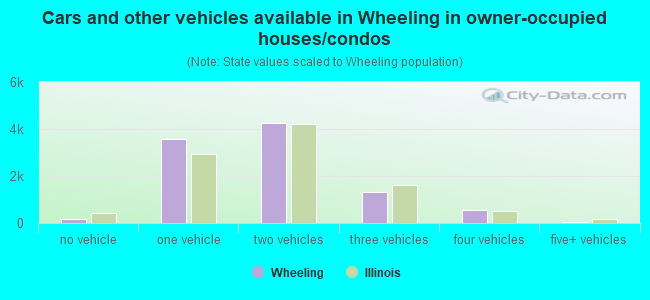
Median number of vehichles in owner occupied houses
Mean number of vehichles in owner occupied houses
Median number of vehichles in renter occupied houses
Mean number of vehichles in renter occupied houses
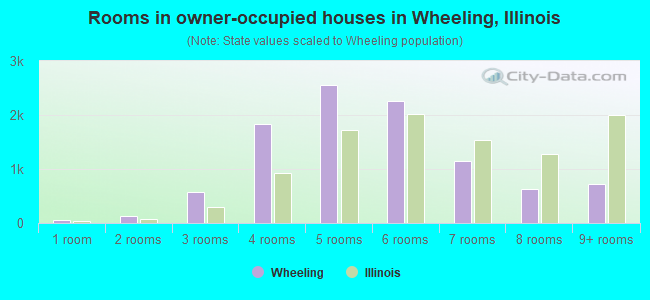
Rooms in owner-occupied houses - 1 room (%)
Rooms in owner-occupied houses - 2 rooms (%)
Rooms in owner-occupied houses - 3 rooms (%)
Rooms in owner-occupied houses - 4 rooms (%)
Rooms in owner-occupied houses - 5 rooms (%)
Rooms in owner-occupied houses - 6 rooms (%)
Rooms in owner-occupied houses - 7 rooms (%)
Rooms in owner-occupied houses - 8 rooms (%)
Rooms in owner-occupied houses - 9+ rooms (%)
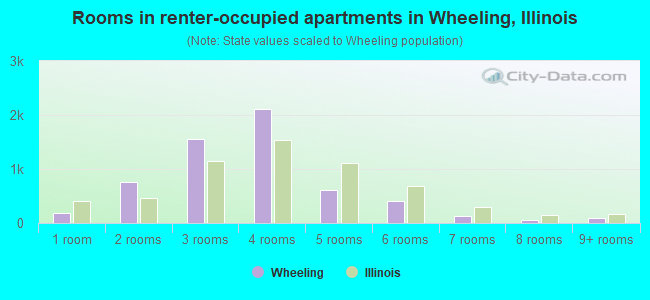
Rooms in renter-occupied houses - 1 room (%)
Rooms in renter-occupied houses - 2 rooms (%)
Rooms in renter-occupied houses - 3 rooms (%)
Rooms in renter-occupied houses - 4 rooms (%)
Rooms in renter-occupied houses - 5 rooms (%)
Rooms in renter-occupied houses - 6 rooms (%)
Rooms in renter-occupied houses - 7 rooms (%)
Rooms in renter-occupied houses - 8 rooms (%)
Rooms in renter-occupied houses - 9+ rooms (%)
Bedrooms in owner-occupied houses - no bedrooms (%)
Bedrooms in owner-occupied houses - 1 bedroom (%)
Bedrooms in owner-occupied houses - 2 bedrooms (%)
Bedrooms in owner-occupied houses - 3 bedrooms (%)
Bedrooms in owner-occupied houses - 4 bedrooms (%)
Bedrooms in owner-occupied houses - 5+ bedrooms (%)
Bedrooms in renter-occupied houses - no bedrooms (%)
Bedrooms in renter-occupied houses - 1 bedroom (%)
Bedrooms in renter-occupied houses - 2 bedrooms (%)
Bedrooms in renter-occupied houses - 3 bedrooms (%)
Bedrooms in renter-occupied houses - 4 bedrooms (%)
Bedrooms in renter-occupied houses - 5+ bedrooms (%)
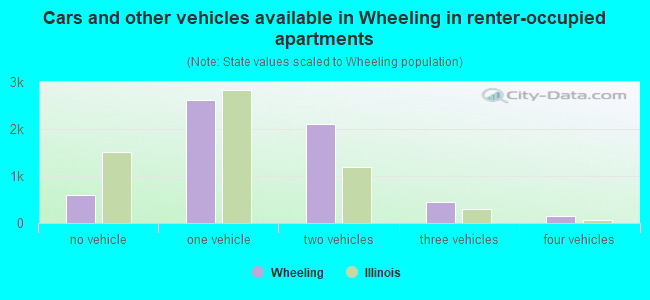
Vehicles available in owner-occupied houses - no vehicle available (%)
Vehicles available in owner-occupied houses - 1 vehicle available(%)
Vehicles available in owner-occupied houses - 2 Vehicles available (%)
Vehicles available in owner-occupied houses - 3 Vehicles available (%)
Vehicles available in owner-occupied houses - 4 Vehicles available (%)
Vehicles available in owner-occupied houses - 5+ Vehicles available (%)
Vehicles available in renter-occupied houses - no vehicle available (%)
Vehicles available in renter-occupied houses - 1 vehicle available (%)
Vehicles available in renter-occupied houses - 2 Vehicles available (%)
Vehicles available in renter-occupied houses - 3 Vehicles available (%)
Vehicles available in renter-occupied houses - 4 Vehicles available (%)
Vehicles available in renter-occupied houses - 5+ Vehicles available (%)
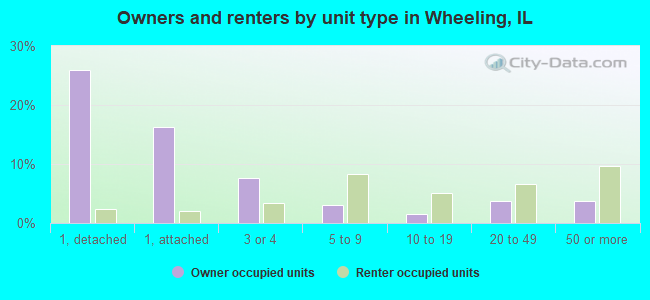
Housing units in structures - 1, detached (%)
Housing units in structures - 1, attached (%)
Housing units in structures - 2 (%)
Housing units in structures - 3 or 4 (%)
Housing units in structures - 5 to 9 (%)
Housing units in structures - 10 to 19 (%)
Housing units in structures - 20 to 49 (%)
Housing units in structures - 50 or more (%)
Housing units in structures - Mobile home (%)
Housing units in structures - Boat, RV, van, etc. (%)
Housing units in structures - Owners - 1, detached (%)
Housing units in structures - Owners - 1, attached (%)
Housing units in structures - Owners - 2 (%)
Housing units in structures - Owners - 3 or 4 (%)
Housing units in structures - Owners - 5 to 9 (%)
Housing units in structures - Owners - 10 to 19 (%)
Housing units in structures - Owners - 20 to 49 (%)
Housing units in structures - Owners - 50 or more (%)
Housing units in structures - Owners - Mobile home (%)
Housing units in structures - Owners - Boat, RV, van, etc. (%)
Housing units in structures - Renters - 1, detached (%)
Housing units in structures - Renters - 1, attached (%)
Housing units in structures - Renters - 2 (%)
Housing units in structures - Renters - 3 or 4 (%)
Housing units in structures - Renters - 5 to 9 (%)
Housing units in structures - Renters - 10 to 19 (%)
Housing units in structures - Renters - 20 to 49 (%)
Housing units in structures - Renters - 50 or more (%)
Housing units in structures - Renters - Mobile home (%)
Housing units in structures - Renters - Boat, RV, van, etc. (%)
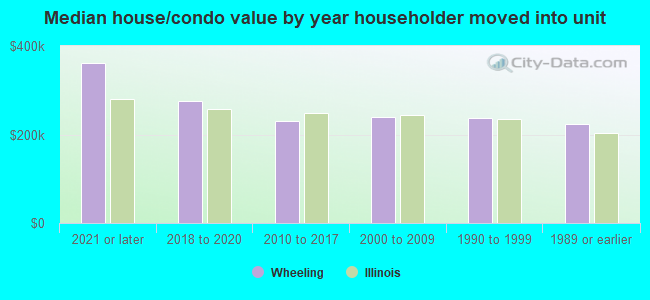
House/condo owner moved in on average (years ago)
Renter moved in on average (years ago)
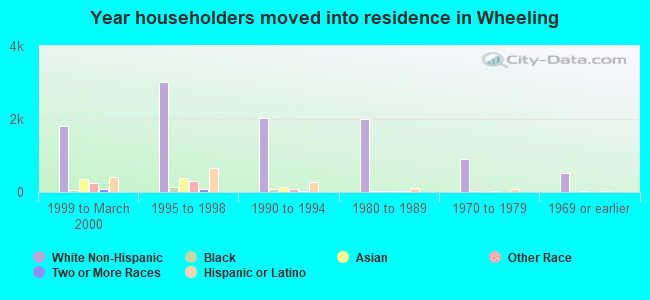
Year householder moved into unit - Moved in 1999 to March 2000 (%)
Year householder moved into unit - Moved in 1999 to March 2000 (%) - White
Year householder moved into unit - Moved in 1999 to March 2000 (%) - Black or African American
Year householder moved into unit - Moved in 1999 to March 2000 (%) - Asian
Year householder moved into unit - Moved in 1999 to March 2000 (%) - Hispanic or Latino
Year householder moved into unit - Moved in 1999 to March 2000 (%) - American Indian and Alaska Native
Year householder moved into unit - Moved in 1999 to March 2000 (%) - Multirace
Year householder moved into unit - Moved in 1999 to March 2000 (%) - Other Race
Year householder moved into unit - Moved in 1995 to 1998 (%)
Year householder moved into unit - Moved in 1995 to 1998 (%) - White
Year householder moved into unit - Moved in 1995 to 1998 (%) - Black or African American
Year householder moved into unit - Moved in 1995 to 1998 (%) - Asian
Year householder moved into unit - Moved in 1995 to 1998 (%) - Hispanic or Latino
Year householder moved into unit - Moved in 1995 to 1998 (%) - American Indian and Alaska Native
Year householder moved into unit - Moved in 1995 to 1998 (%) - Multirace
Year householder moved into unit - Moved in 1995 to 1998 (%) - Other Race
Year householder moved into unit - Moved in 1990 to 1994 (%)
Year householder moved into unit - Moved in 1990 to 1994 (%) - White
Year householder moved into unit - Moved in 1990 to 1994 (%) - Black or African American
Year householder moved into unit - Moved in 1990 to 1994 (%) - Asian
Year householder moved into unit - Moved in 1990 to 1994 (%) - Hispanic or Latino
Year householder moved into unit - Moved in 1990 to 1994 (%) - American Indian and Alaska Native
Year householder moved into unit - Moved in 1990 to 1994 (%) - Multirace
Year householder moved into unit - Moved in 1990 to 1994 (%) - Other Race
Year householder moved into unit - Moved in 1980 to 1989 (%)
Year householder moved into unit - Moved in 1980 to 1989 (%) - White
Year householder moved into unit - Moved in 1980 to 1989 (%) - Black or African American
Year householder moved into unit - Moved in 1980 to 1989 (%) - Asian
Year householder moved into unit - Moved in 1980 to 1989 (%) - Hispanic or Latino
Year householder moved into unit - Moved in 1980 to 1989 (%) - American Indian and Alaska Native
Year householder moved into unit - Moved in 1980 to 1989 (%) - Multirace
Year householder moved into unit - Moved in 1980 to 1989 (%) - Other Race
Year householder moved into unit - Moved in 1970 to 1979 (%)
Year householder moved into unit - Moved in 1970 to 1979 (%) - White
Year householder moved into unit - Moved in 1970 to 1979 (%) - Black or African American
Year householder moved into unit - Moved in 1970 to 1979 (%) - Asian
Year householder moved into unit - Moved in 1970 to 1979 (%) - Hispanic or Latino
Year householder moved into unit - Moved in 1970 to 1979 (%) - American Indian and Alaska Native
Year householder moved into unit - Moved in 1970 to 1979 (%) - Multirace
Year householder moved into unit - Moved in 1970 to 1979 (%) - Other Race
Year householder moved into unit - Moved in 1969 or earlier (%)
Year householder moved into unit - Moved in 1969 or earlier (%) - White
Year householder moved into unit - Moved in 1969 or earlier (%) - Black or African American
Year householder moved into unit - Moved in 1969 or earlier (%) - Asian
Year householder moved into unit - Moved in 1969 or earlier (%) - Hispanic or Latino
Year householder moved into unit - Moved in 1969 or earlier (%) - American Indian and Alaska Native
Year householder moved into unit - Moved in 1969 or earlier (%) - Multirace
Year householder moved into unit - Moved in 1969 or earlier (%) - Other Race
Housing units lacking complete plumbing facilities (%)
Housing units lacking complete kitchen facilities (%)
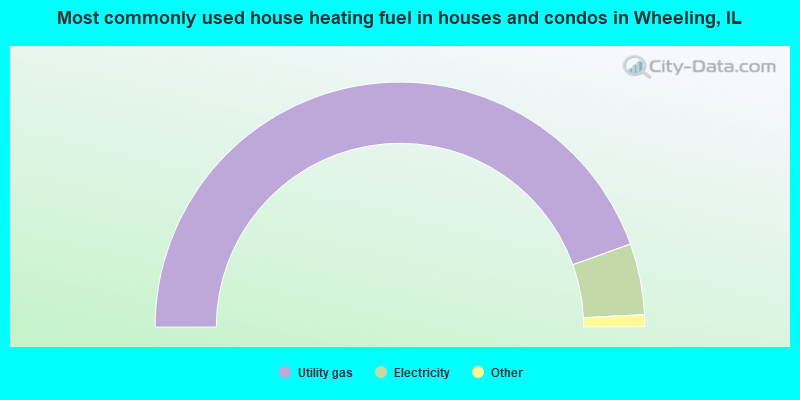
House heating fuel used in houses and condos - Utility gas (%)
House heating fuel used in houses and condos - Bottled, tank, or LP gas (%)
House heating fuel used in houses and condos - Electricity (%)
House heating fuel used in houses and condos - Fuel oil, kerosene, etc. (%)
House heating fuel used in houses and condos - Coal or coke (%)
House heating fuel used in houses and condos - Wood (%)
House heating fuel used in houses and condos - Solar energy (%)
House heating fuel used in houses and condos - Other fuel (%)
House heating fuel used in houses and condos - No fuel used (%)
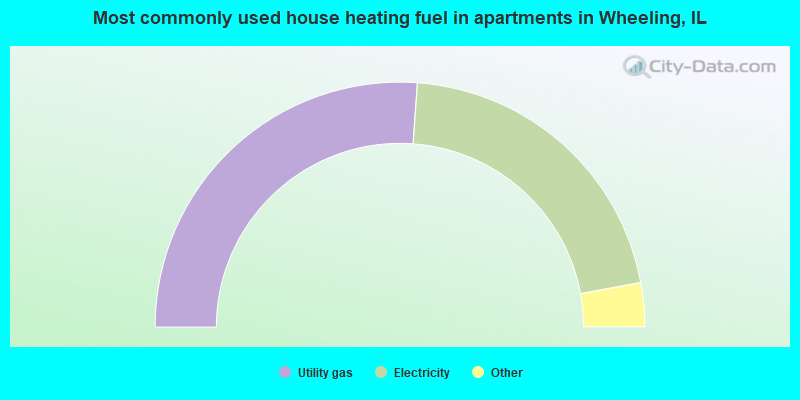
House heating fuel used in apartments - Utility gas (%)
House heating fuel used in apartments - Bottled, tank, or LP gas (%)
House heating fuel used in apartments - Electricity (%)
House heating fuel used in apartments - Fuel oil, kerosene, etc. (%)
House heating fuel used in apartments - Coal or coke (%)
House heating fuel used in apartments - Wood (%)
House heating fuel used in apartments - Solar energy (%)
House heating fuel used in apartments - Other fuel (%)
House heating fuel used in apartments - No fuel used (%)
Latest news about housing in Wheeling, IL collected exclusively by city-data.com from local newspapers, TV, and radio stations
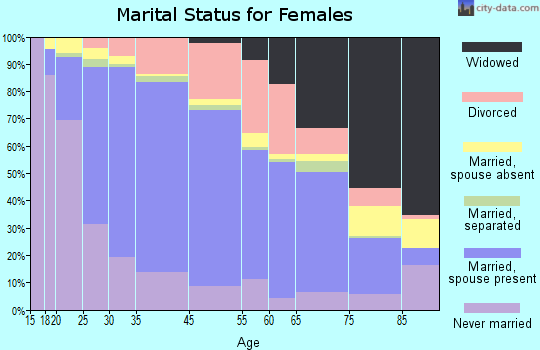
Median year house/condo built: 1978Median year apartment built: 1984Household type by relationship:
Households: 37,960
Male householders: 7,885 (1,857 living alone ), Female householders: 7,254 (2,784 living alone )7,142 spouses (7,001 opposite-sex spouses ), 802 unmarried partners , (731 opposite-sex unmarried partners ), 9,660 children (9,376 natural , 46 adopted , 236 stepchildren ), 576 grandchildren , 806 brothers or sisters , 1,315 parents , 0 foster children , 565 other relatives , 1,400 non-relatives In group quarters: 550
Size of family households: 4,096 2-persons , 2,700 3-persons , 1,466 4-persons , 885 5-persons , 300 6-persons , 158 7-or-more-persons .
Size of nonfamily households: 4,987 1-person , 902 2-persons , 120 3-persons , 135 4-persons , 1 6-persons .
5,021 married couples with children. single-parent households (389 men , 548 women ).
35.8% of residents of Wheeling speak English at home. of residents speak Spanish at home (56% speak English very well , 23% speak English well , 15% speak English not well , 5% don't speak English at all ).of residents speak other Indo-European language at home (53% speak English very well , 25% speak English well , 20% speak English not well , 2% don't speak English at all ).of residents speak Asian or Pacific Island language at home (65% speak English very well , 19% speak English well , 13% speak English not well , 3% don't speak English at all ).of residents speak other language at home (56% speak English very well , 38% speak English well , 5% speak English not well ).
Foreign born population: 17,682 (46.6%)of them are naturalized citizens )
Median number of rooms in houses and condos:
Median number of rooms in apartments
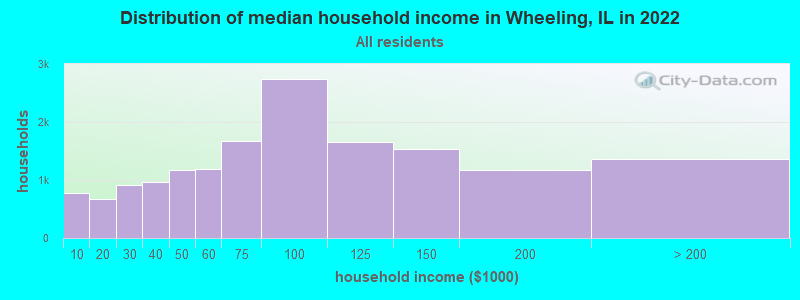
Wheeling, IL household income distribution 784 Less than $10,000665 $10,000 to $19,999915 $20,000 to $29,999971 $30,000 to $39,9991,181 $40,000 to $49,9991,197 $50,000 to $59,9991,664 $60,000 to $74,9992,742 $75,000 to $99,9991,661 $100,000 to $124,9991,528 $125,000 to $149,9991,181 $150,000 to $199,9991,362 $200,000 or more
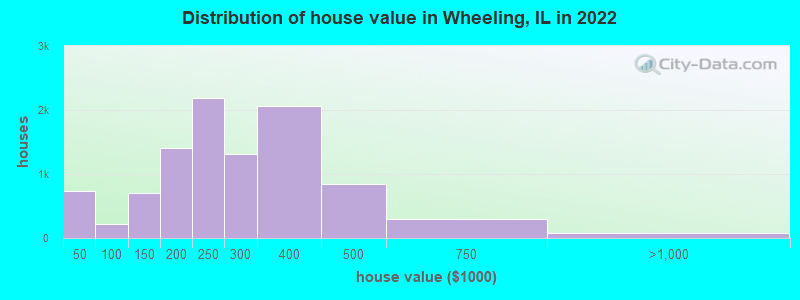
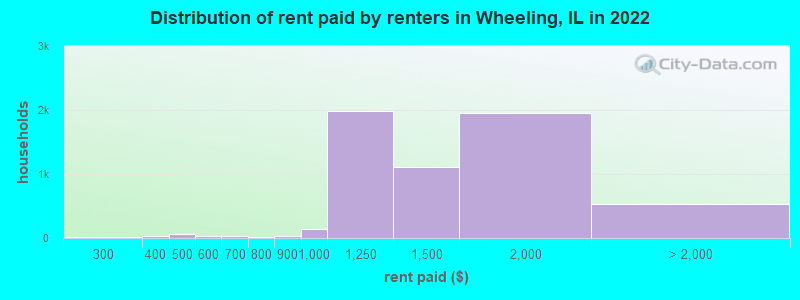
Home value of owner - occupied houses in 2022 in Wheeling, IL 123 Less than $10,00053 $10,000 to $14,9998 $15,000 to $19,999265 $20,000 to $24,999163 $25,000 to $29,99939 $30,000 to $34,99951 $35,000 to $39,99937 $40,000 to $49,9995 $50,000 to $59,99941 $60,000 to $69,99962 $70,000 to $79,9999 $80,000 to $89,99959 $90,000 to $99,999390 $100,000 to $124,999313 $125,000 to $149,999606 $150,000 to $174,999796 $175,000 to $199,9992,179 $200,000 to $249,9991,313 $250,000 to $299,9992,063 $300,000 to $399,999847 $400,000 to $499,999299 $500,000 to $749,99969 $750,000 to $999,99913 $2,000,000 or moreRent paid by renters in 2022 in Wheeling, IL 14 $150 to $19921 $200 to $24918 $300 to $3498 $350 to $39955 $400 to $44911 $450 to $49924 $500 to $5494 $550 to $59928 $650 to $69912 $750 to $79931 $800 to $899140 $900 to $9991,992 $1,000 to $1,2491,109 $1,250 to $1,4991,953 $1,500 to $1,999275 $2,000 to $2,49939 $2,500 to $2,999106 $3,500 or more106 No cash rent
Percentage of workers working in this county: 73.1%Number of people working at home: 2,703 (12.5% of all workers )
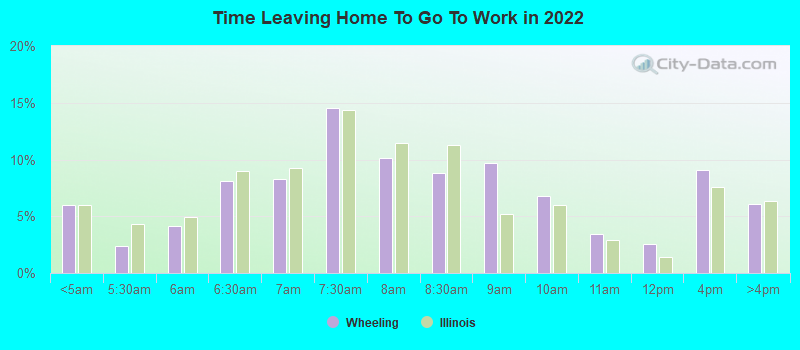
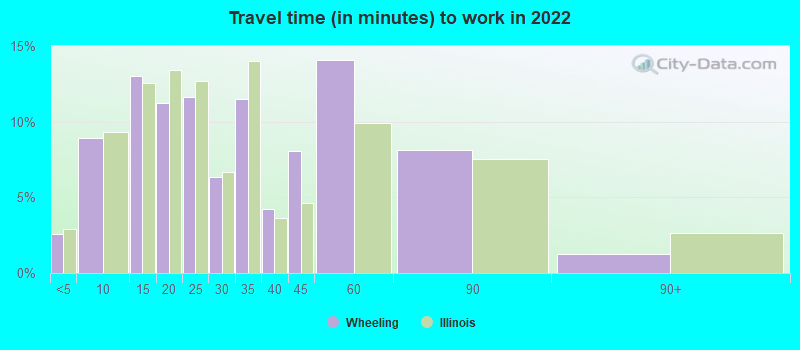
Travel time to work (commute)
Less than 5 minutes: 4335 to 9 minutes: 1,61810 to 14 minutes: 2,70415 to 19 minutes: 3,05420 to 24 minutes: 2,56225 to 29 minutes: 1,52030 to 34 minutes: 2,48735 to 39 minutes: 52440 to 44 minutes: 93745 to 59 minutes: 1,38260 to 89 minutes: 1,08790 or more minutes: 483
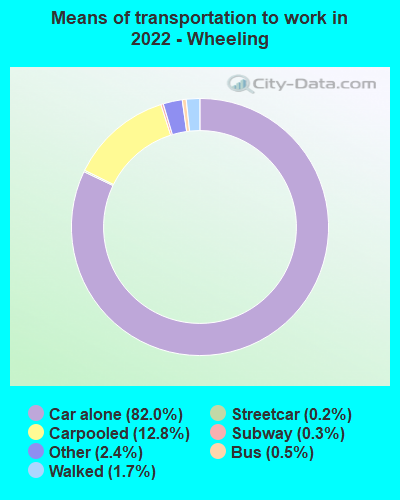
Means of transportation to work:
Drove a car alone: 15,329 (72.0%)Carpooled: 2,564 (12.0%)Bus : 84 (0.4%)Subway or elevated rail : 21 (0.1%)Long-distance train or commuter rail : 45 (0.2%)Taxi: 461 (2.2%)Bicycle: 15 (0.1%)Walked: 318 (1.5%)Worked at home: 2,703 (12.7%)
Unemployment by race in 2022
Unemployment rate for White non-Hispanic residents 4.0% Males3.6% FemalesUnemployment rate for Black residents 19.1% FemalesUnemployment rate for Asian residents 1.9% Males4.5% FemalesUnemployment rate for other race residents 6.0% Males4.8% FemalesUnemployment rate for two or more race residents 7.8% Males1.8% FemalesUnemployment rate for Hispanic or Latino residents 6.3% Males3.7% Females
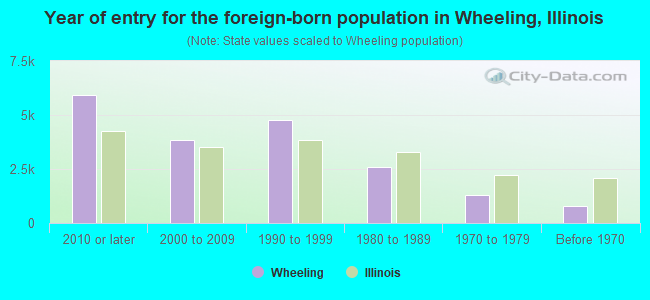
Year of entry for the foreign-born population in Wheeling, Illinois
5,923 2010 or later 3,834 2000 to 2009 4,791 1990 to 1999 2,587 1980 to 1989 1,318 1970 to 1979 807 Before 1970
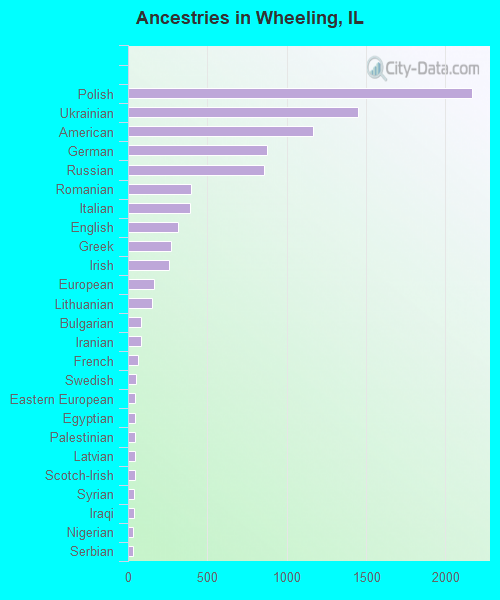
First ancestries reported:
Polish: 2,166 (8.9%)
Ukrainian: 1,449 (5.9%)
American: 1,166 (4.8%)
German: 873 (3.6%)
Russian: 857 (3.5%)
Romanian: 394 (1.6%)
Italian: 389 (1.6%)
English: 315 (1.3%)
Greek: 271 (1.1%)
Irish: 260 (1.1%)
European: 162 (0.7%)
Lithuanian: 153 (0.6%)
Bulgarian: 83 (0.3%)
Iranian: 81 (0.3%)
French: 64 (0.3%)
Swedish: 50 (0.2%)
Eastern European: 47 (0.2%)
Egyptian: 42 (0.2%)
Palestinian: 42 (0.2%)
Latvian: 42 (0.2%)
Scotch-Irish: 41 (0.2%)
Syrian: 37 (0.2%)
Iraqi: 36 (0.1%)
Nigerian: 34 (0.1%)
Serbian: 29 (0.1%)
Slavic: 29 (0.1%)
Slovak: 29 (0.1%)
Luxembourger: 28 (0.1%)
Moroccan: 26 (0.1%)
Israeli: 26 (0.1%)
Turkish: 23 (0.09%)
Portuguese: 19 (0.08%)
Lebanese: 18 (0.07%)
Austrian: 18 (0.07%)
Danish: 17 (0.07%)
Norwegian: 17 (0.07%)
Croatian: 17 (0.07%)
Armenian: 16 (0.07%)
Dutch: 15 (0.06%)
Scottish: 15 (0.06%)
Finnish: 11 (0.05%)
Jordanian: 10 (0.04%)
Northern European: 10 (0.04%)
South African: 10 (0.04%)
Yugoslavian: 10 (0.04%)
Czechoslovakian: 6 (0.02%)
British: 6 (0.02%)
Hungarian: 4 (0.02%)
Czech: 4 (0.02%)
Most common places of birth for foreign-born residents (%): Mexico Wheeling:
30.8% (5,451)Illinois:
34.7% (626,958)
India Wheeling:
14.9% (2,627)Illinois:
9.2% (166,409)
Ukraine Wheeling:
11.6% (2,058)Illinois:
1.6% (29,316)
Poland Wheeling:
6.2% (1,105)Illinois:
6.9% (124,474)
Korea Wheeling:
4.9% (874)Illinois:
2.2% (40,393)
Philippines Wheeling:
4.8% (854)Illinois:
5.2% (93,003)
Russia Wheeling:
4.1% (717)Illinois:
0.9% (16,308)
Belarus Wheeling:
2.1% (365)Illinois:
0.3% (6,186)
Moldova Wheeling:
1.6% (278)Illinois:
0.3% (4,938)
Place of birth for U.S.-born residents:
This state: 16,833Other state: 3,212Northeast: 438Midwest: 1,327South: 979West: 462 88.0% of Wheeling residents lived in the same house 1 years ago.
Out of people who lived in different houses, 42.7% lived in this county.
Out of people who lived in different counties, 64.9% lived in Illinois.
Wheeling:
88.0%State average:
88.3%
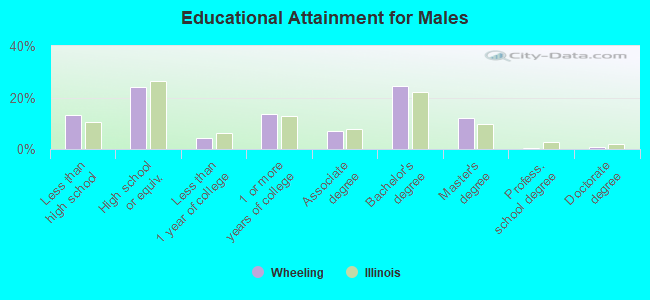
Education attainment for males 25 years and older:
No schooling: 593Nursery to 4th grade: 1075th and 6th grade: 2437th and 8th grade: 1099th grade: 6510th grade: 13611th grade: 27712th grade, no diploma: 285High school graduate (or equivalency): 3,381Less than 1 year of college: 595Some college more than 1 year, no degree: 1,919Associate degree: 977Bachelor's degree: 3,414Master's degree: 1,673Professional school degree: 69Doctorate degree: 93
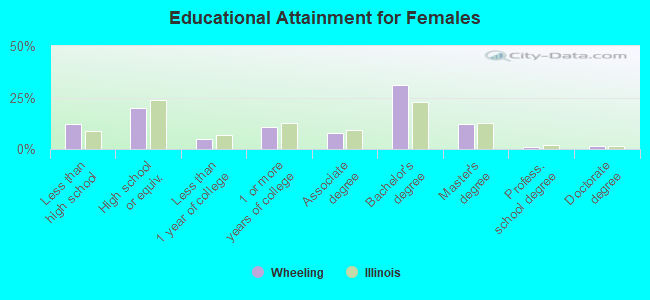
Education attainment for females 25 years and older:
No schooling: 630Nursery to 4th grade: 1715th and 6th grade: 2057th and 8th grade: 1049th grade: 9210th grade: 6111th grade: 17212th grade, no diploma: 304High school graduate (or equivalency): 2,861Less than 1 year of college: 702Some college more than 1 year, no degree: 1,570Associate degree: 1,119Bachelor's degree: 4,484Master's degree: 1,752Professional school degree: 120Doctorate degree: 186
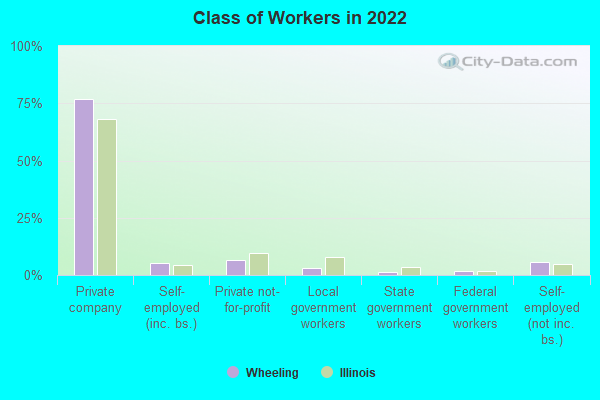
Housing units in structures:
One, detached: 4,530One, attached: 2,638Two: 1583 or 4: 1,9405 to 9: 1,98210 to 19: 97520 to 49: 1,52550 or more: 2,185Mobile homes: 400Median worth of mobile homes: $27,401
Housing units lacking complete plumbing facilities in 2022: 0.3%Housing units lacking complete kitchen facilities in 2022: 0.7%House/condo owner moved in on average 12 years ago
Renter moved in on average 2 years ago
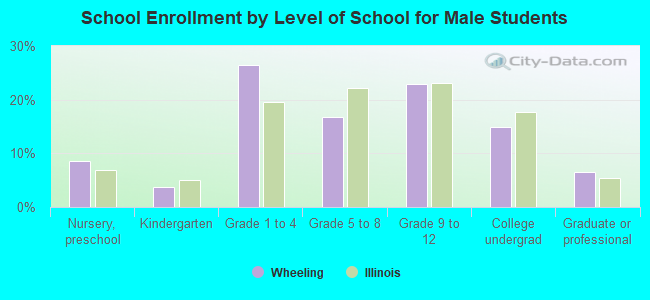
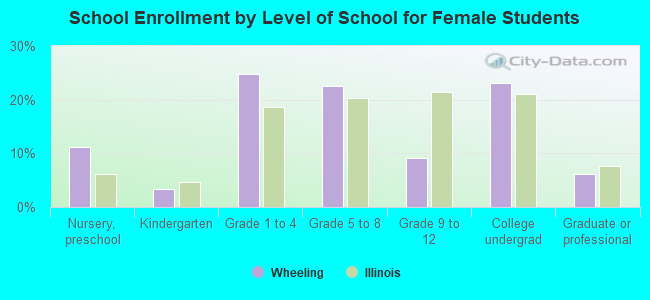
Private vs. public school enrollment:
Students in private schools in grades 1 to 8 (elementary and middle school): 584 Students in private schools in grades 9 to 12 (high school): 34 Students in private undergraduate colleges: 450