Whitney, NV (Nevada) Houses and Residents
| Whitney: | $318,481 |
| Nevada: | $434,700 |
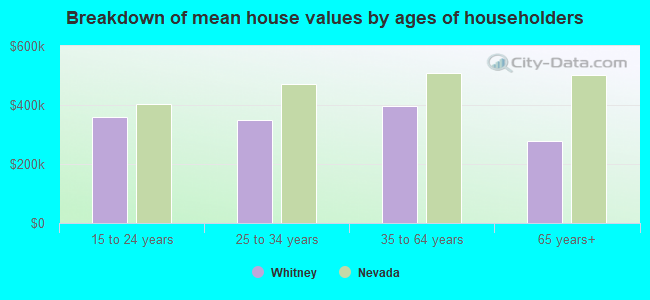
Mean price in 2022:
Detached houses: $195,992
Here: $195,992 State: $549,327 Townhouses or other attached units: $118,565
Here: $118,565 State: $328,893 In 3-to-4-unit structures: $117,970
Here: $117,970 State: $295,216 In 5-or-more-unit structures: $106,768
Here: $106,768 State: $297,847 Mobile homes: $79,270
Here: $79,270 State: $159,995
Total population: 38,585 (Urban population: 17,463, Rural population: 268 (all nonfarm))
Houses: 18,670 (16,475 occupied: 9,224 owner occupied, 7,251 renter occupied)
| % of renters here: | 44% |
| State: | 40% |
Housing density: 2,492 houses/condos per square mile
Median price asked for vacant for-sale houses and condos in 2022: $242,439.
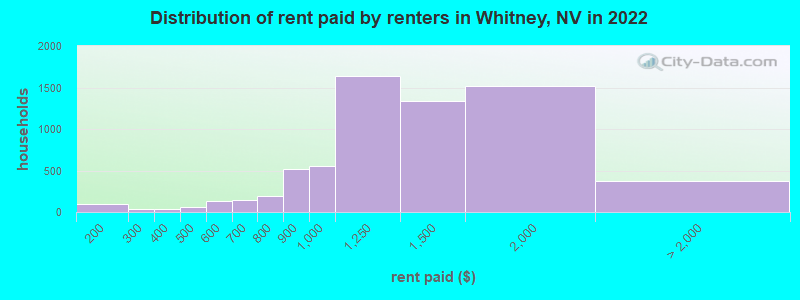
Median contract rent in 2022: $1,264 (lower quartile is $997, upper quartile is $1,595)
Median rent asked for vacant for-rent units in 2022: $1,272
Median gross rent in Whitney, NV in 2022: $1,425
Housing units in Whitney with a mortgage: 6,443 (358 second mortgage, 27 home equity loan, 234 both second mortgage and home equity loan)
Houses without a mortgage: 173
Median household income for houses/condos with a mortgage: $73,665
Median household income for apartments without a mortgage: $56,362
Median monthly housing costs: $1,260
Compare current foreclosures near Whitney, NV:
| Photo | Address | Area | Beds / Baths | Price | Details |
|---|---|---|---|---|---|

|
#1
Freedom Ave
Las Vegas, NV 89121
|
2,025 sq. feet
|
3 baths 2 beds |
$305,000
|
show details |

|
#2
Oro Silver Ct
Las Vegas, NV 89178
|
1,400 sq. feet
|
2 baths 2 beds |
$385,000
|
show details |

|
#3
Brentcove Dr
North Las Vegas, NV 89032
|
1,852 sq. feet
|
2 baths 3 beds |
$361,500
|
show details |

|
#4
Vida Pacifica St
Las Vegas, NV 89115
|
1,621 sq. feet
|
2 baths 4 beds |
$357,000
|
show details |

|
#5
Balcones Fault Ave
North Las Vegas, NV 89081
|
2,321 sq. feet
|
3 baths 4 beds |
$434,900
|
show details |

|
#6
Cape Verde Ln
Las Vegas, NV 89128
|
1,857 sq. feet
|
2 baths 4 beds |
$484,900
|
show details |

|
#7
Sheer Paradise Ln Unit 1
Henderson, NV 89002
|
1,182 sq. feet
|
2 baths 2 beds |
show details | |

|
#8
Red Gable Ln
Las Vegas, NV 89144
|
1,263 sq. feet
|
2 baths 2 beds |
show details | |

|
#9
S Valley View Blvd Unit 1050
Las Vegas, NV 89103
|
496 sq. feet
|
1 baths 1 beds |
show details | |

|
#10
Bel Air Dr Unit 24g
Las Vegas, NV 89109
|
2,208 sq. feet
|
3 baths 2 beds |
show details |
| Photo | Address | Area | Beds / Baths | Price | Details |
|---|---|---|---|---|---|

|
#11
Harmony Ave
Las Vegas, NV 89107
|
1,350 sq. feet
|
2 baths 3 beds |
show details | |

|
#12
Seedling Way
Las Vegas, NV 89115
|
1,604 sq. feet
|
2 baths 4 beds |
show details | |

|
#13
Clarington Ave
North Las Vegas, NV 89081
|
1,688 sq. feet
|
2 baths 2 beds |
show details | |

|
#14
E Cactus Ave Unit 2112
Las Vegas, NV 89183
|
1,048 sq. feet
|
2 baths 2 beds |
show details | |

|
#15
E Cleveland Ave
Las Vegas, NV 89104
|
2,136 sq. feet
|
2 baths 5 beds |
show details | |

|
#16
Heritage Ct
Las Vegas, NV 89121
|
- sq. feet
|
2 baths 4 beds |
show details | |

|
#17
Franklin Ave
Las Vegas, NV 89104
|
1,247 sq. feet
|
2 baths 3 beds |
show details | |

|
#18
Eagle Hills Dr
Las Vegas, NV 89134
|
7,111 sq. feet
|
7 baths 5 beds |
show details | |

|
#19
Via Cassia
Henderson, NV 89052
|
4,043 sq. feet
|
3 baths 5 beds |
show details | |

|
#20
Laronda Ln
Las Vegas, NV 89156
|
1,196 sq. feet
|
2 baths 3 beds |
show details |
| Photo | Address | Area | Beds / Baths | Price | Details |
|---|---|---|---|---|---|

|
#21
W Basic Rd
Henderson, NV 89015
|
1,422 sq. feet
|
2 baths 4 beds |
show details | |

|
#22
Betty Davis St
Las Vegas, NV 89142
|
1,418 sq. feet
|
2 baths 3 beds |
show details | |

|
#23
Osceola Mills St
Las Vegas, NV 89141
|
3,976 sq. feet
|
4 baths 6 beds |
show details | |

|
#24
Wengert Ave
Las Vegas, NV 89104
|
903 sq. feet
|
1 baths 2 beds |
show details | |

|
#25
Crown Imperial St
Henderson, NV 89074
|
1,186 sq. feet
|
2 baths 2 beds |
show details | |

|
#26
Flora Spray St
Las Vegas, NV 89130
|
2,219 sq. feet
|
3 baths 5 beds |
show details | |

|
#27
Seneca Dr
Las Vegas, NV 89169
|
1,640 sq. feet
|
4 baths 4 beds |
show details | |

|
#28
Oxbow St
Las Vegas, NV 89119
|
1,868 sq. feet
|
2 baths 4 beds |
show details | |

|
#29
Meadow Foxtail Dr
Las Vegas, NV 89122
|
1,601 sq. feet
|
2 baths 2 beds |
show details | |

|
#30
Silver Falls Ave
Las Vegas, NV 89123
|
1,979 sq. feet
|
2 baths 4 beds |
show details |
| Photo | Address | Area | Beds / Baths | Price | Details |
|---|---|---|---|---|---|

|
#31
Casa Verde Dr
North Las Vegas, NV 89031
|
1,215 sq. feet
|
2 baths 3 beds |
show details | |

|
#32
La Mata St
Las Vegas, NV 89108
|
1,754 sq. feet
|
2 baths 3 beds |
show details | |

|
#33
English Oak St
Las Vegas, NV 89117
|
3,569 sq. feet
|
2 baths 4 beds |
show details | |

|
#34
Peppermill Dr
Las Vegas, NV 89146
|
2,040 sq. feet
|
3 baths 3 beds |
show details | |

|
#35
Providence Ln
Las Vegas, NV 89107
|
1,350 sq. feet
|
1 baths 3 beds |
show details | |

|
#36
Shady Hill Ave
Las Vegas, NV 89106
|
1,096 sq. feet
|
2 baths 3 beds |
show details | |

|
#37
W Carey Ave
North Las Vegas, NV 89030
|
1,320 sq. feet
|
1 baths 4 beds |
show details | |

|
#38
Legato Falls St
Las Vegas, NV 89115
|
1,740 sq. feet
|
3 baths 3 beds |
show details | |

|
#39
Bristol Way
Las Vegas, NV 89107
|
1,180 sq. feet
|
2 baths 3 beds |
show details | |

|
#40
Woodridge Dr
Henderson, NV 89015
|
1,389 sq. feet
|
2 baths 3 beds |
show details |
| Photo | Address | Area | Beds / Baths | Price | Details |
|---|---|---|---|---|---|

|
#41
King Hill St
Las Vegas, NV 89106
|
1,096 sq. feet
|
2 baths 3 beds |
show details | |

|
#42
N Buffalo Dr Apt 102
Las Vegas, NV 89128
|
912 sq. feet
|
2 baths 2 beds |
show details | |

|
#43
Kendall Point Ave
North Las Vegas, NV 89081
|
2,018 sq. feet
|
3 baths 3 beds |
show details | |

|
#44
Gulls Perch Dr
Las Vegas, NV 89128
|
2,084 sq. feet
|
2 baths 4 beds |
show details | |

|
#45
Fossil Lake St
North Las Vegas, NV 89084
|
3,484 sq. feet
|
3 baths 3 beds |
show details | |

|
#46
Calzado Dr
Las Vegas, NV 89178
|
1,797 sq. feet
|
3 baths 4 beds |
show details | |

|
#47
Cuddy Falls Place
North Las Vegas, NV 89084
|
2,202 sq. feet
|
4 baths 4 beds |
show details | |

|
#48
Blue Rose St
North Las Vegas, NV 89081
|
1,647 sq. feet
|
2 baths 4 beds |
show details | |

|
#49
Summer Glen Ln
North Las Vegas, NV 89031
|
1,509 sq. feet
|
2 baths 3 beds |
show details | |

|
Check over 1 million property listings on Foreclosure.com!
|
browse all offers | |||

Latest news about housing in Whitney, NV collected exclusively by city-data.com from local newspapers, TV, and radio stations

 | Back again..Best Area to Rent a SFHhome for $1600? (66 replies) |
| Current Update on the LV Real Estate Market -- Part II (8922 replies) |
| Are all the cheap houses gone? (192 replies) |
| What is cost of small, newer house for rent in Las Vegas area (7 replies) |
| Does the 89122 area code have nice homes? (15 replies) |
| Whitney Ranch area real estate near wash and mall (17 replies) |
Median year apartment built: 2000
Household type by relationship:
Households: 45,846- Male householders: 7,322 (2,242 living alone), Female householders: 9,075 (2,546 living alone)
6,580 spouses (6,462 opposite-sex spouses), 1,515 unmarried partners, (1,363 opposite-sex unmarried partners), 13,892 children (12,653 natural, 280 adopted, 957 stepchildren), 1,408 grandchildren, 1,081 brothers or sisters, 1,157 parents, 45 foster children, 1,991 other relatives, 1,774 non-relatives
Size of family households: 4,010 2-persons, 2,396 3-persons, 1,981 4-persons, 1,387 5-persons, 504 6-persons, 428 7-or-more-persons.
Size of nonfamily households: 4,686 1-person, 952 2-persons, 56 3-persons, 42 4-persons, 30 6-persons, 3 7-or-more-persons.
5,734 married couples with children.
2,987 single-parent households (670 men, 2,317 women).
58.1% of residents of Whitney speak English at home.
29.9% of residents speak Spanish at home (58% speak English very well, 18% speak English well, 18% speak English not well, 6% don't speak English at all).
2.2% of residents speak other Indo-European language at home (79% speak English very well, 20% speak English well, 1% speak English not well).
9.7% of residents speak Asian or Pacific Island language at home (64% speak English very well, 30% speak English well, 5% speak English not well, 1% don't speak English at all).
0.8% of residents speak other language at home (33% speak English very well, 29% speak English well, 38% speak English not well).
Foreign born population: 12,285 (26.8%)
(55.6% of them are naturalized citizens)
| Here: | 5.2 |
| State: | 6.0 |
| Here: | 4.4 |
| State: | 4.2 |
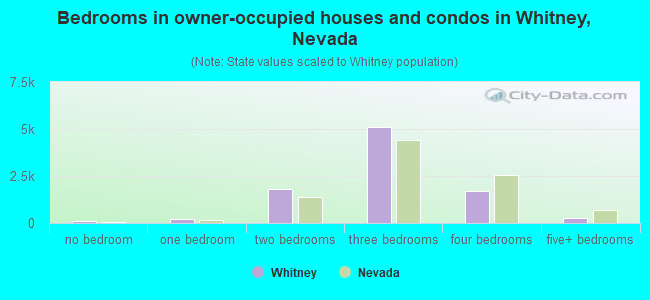
- Bedrooms in owner-occupied houses and condos in Whitney, Nevada
- 105no bedroom
- 2171 bedroom
- 1,8042 bedrooms
- 5,1113 bedrooms
- 1,7154 bedrooms
- 2735+ bedrooms
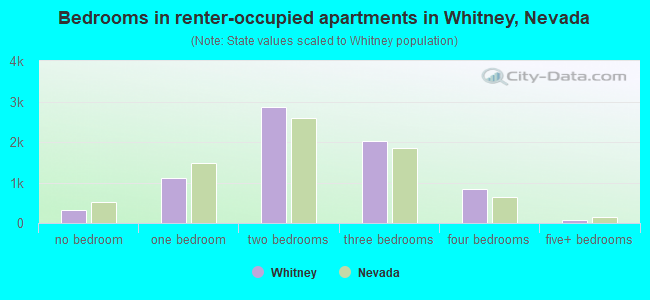
- Bedrooms in renter-occupied apartments in Whitney, Nevada
- 333no bedroom
- 1,1121 bedroom
- 2,8582 bedrooms
- 2,0223 bedrooms
- 8434 bedrooms
- 835+ bedrooms
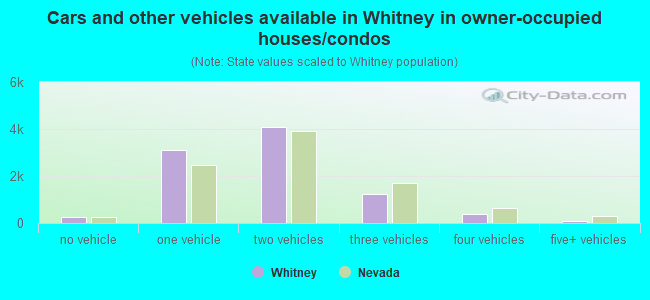
- Cars and other vehicles available in Whitney in owner-occupied houses/condos
- 251no vehicle
- 3,1201 vehicle
- 4,1012 vehicles
- 1,2553 vehicles
- 3964 vehicles
- 1035+ vehicles
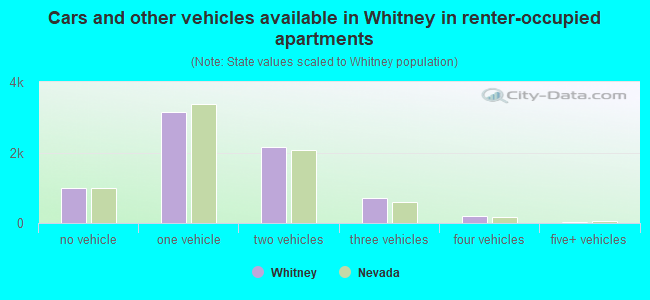
- Cars and other vehicles available in Whitney in renter-occupied apartments
- 1,005no vehicle
- 3,1441 vehicle
- 2,1662 vehicles
- 7073 vehicles
- 1934 vehicles
- 375+ vehicles
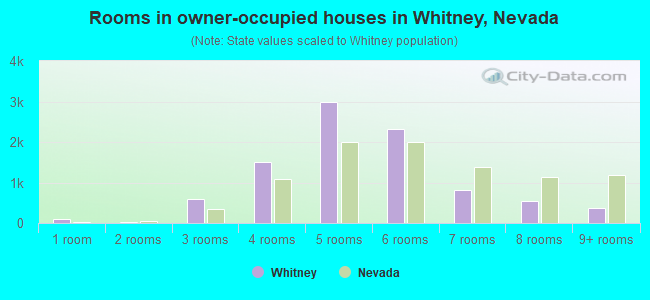
- Rooms in owner-occupied houses in Whitney, Nevada
- 881 room
- 132 rooms
- 5833 rooms
- 1,5184 rooms
- 2,9835 rooms
- 2,3126 rooms
- 8187 rooms
- 5348 rooms
- 3769+ rooms
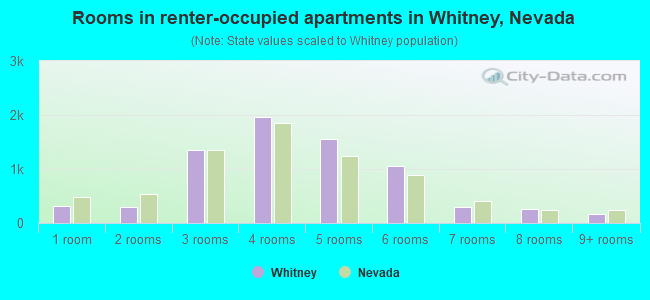
- Rooms in renter-occupied apartments in Whitney, Nevada
- 3141 room
- 2912 rooms
- 1,3503 rooms
- 1,9634 rooms
- 1,5495 rooms
- 1,0486 rooms
- 3047 rooms
- 2668 rooms
- 1669+ rooms
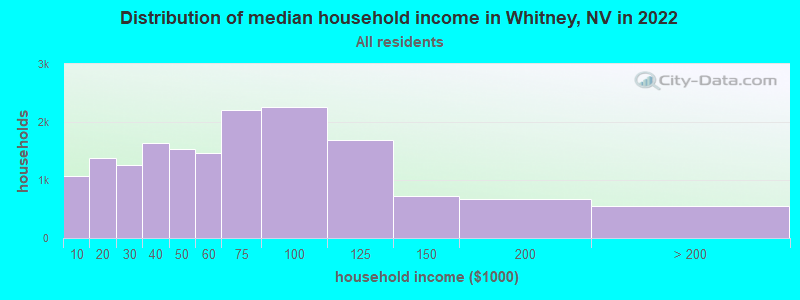
Whitney, NV household income distribution

- 1,077Less than $10,000
- 1,384$10,000 to $19,999
- 1,266$20,000 to $29,999
- 1,643$30,000 to $39,999
- 1,528$40,000 to $49,999
- 1,465$50,000 to $59,999
- 2,205$60,000 to $74,999
- 2,257$75,000 to $99,999
- 1,689$100,000 to $124,999
- 722$125,000 to $149,999
- 668$150,000 to $199,999
- 553$200,000 or more
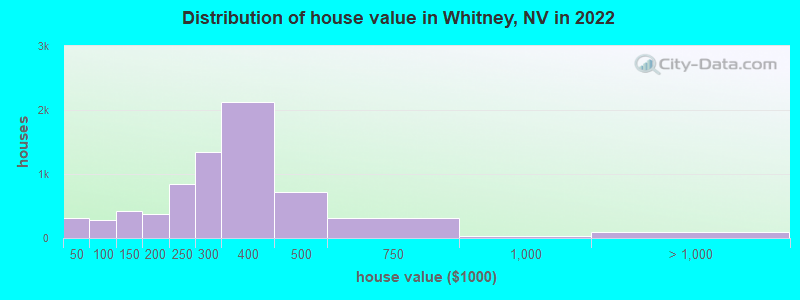
Home value of owner - occupied houses in 2022 in Whitney, NV
-
- 89Less than $10,000
- 31$15,000 to $19,999
- 17$20,000 to $24,999
- 43$25,000 to $29,999
- 28$30,000 to $34,999
- 83$35,000 to $39,999
- 12$40,000 to $49,999
- 100$50,000 to $59,999
- 16$60,000 to $69,999
- 27$70,000 to $79,999
- 76$80,000 to $89,999
- 51$90,000 to $99,999
- 268$100,000 to $124,999
- 156$125,000 to $149,999
- 162$150,000 to $174,999
- 204$175,000 to $199,999
- 842$200,000 to $249,999
- 1,349$250,000 to $299,999
- 2,126$300,000 to $399,999
- 715$400,000 to $499,999
- 308$500,000 to $749,999
- 29$750,000 to $999,999
- 33$1,000,000 to $1,499,999
- 60$2,000,000 or more
Rent paid by renters in 2022 in Whitney, NV
-
- 17$100 to $149
- 83$150 to $199
- 41$250 to $299
- 8$300 to $349
- 32$350 to $399
- 47$400 to $449
- 14$450 to $499
- 68$500 to $549
- 59$550 to $599
- 44$600 to $649
- 96$650 to $699
- 78$700 to $749
- 110$750 to $799
- 514$800 to $899
- 553$900 to $999
- 1,632$1,000 to $1,249
- 1,335$1,250 to $1,499
- 1,513$1,500 to $1,999
- 174$2,000 to $2,499
- 204No cash rent
Percentage of workers working in this county: 98.5%
Number of people working at home: 1,461 (6.8% of all workers)
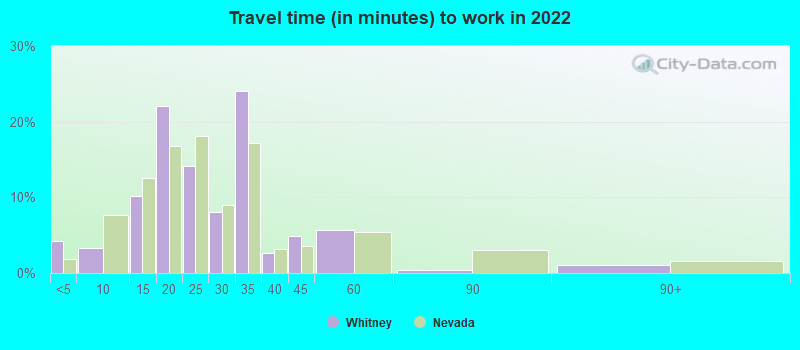
Travel time to work (commute)
- Less than 5 minutes: 259
- 5 to 9 minutes: 405
- 10 to 14 minutes: 1,820
- 15 to 19 minutes: 2,369
- 20 to 24 minutes: 4,206
- 25 to 29 minutes: 2,726
- 30 to 34 minutes: 4,674
- 35 to 39 minutes: 779
- 40 to 44 minutes: 989
- 45 to 59 minutes: 692
- 60 to 89 minutes: 225
- 90 or more minutes: 491
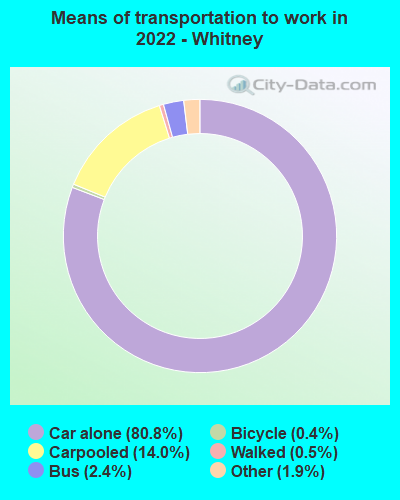
Means of transportation to work:
- Drove a car alone: 3,298 (61.6%)
- Carpooled: 620 (11.6%)
- Bus: 98 (1.8%)
- Taxi: 86 (1.6%)
- Bicycle: 20 (0.4%)
- Walked: 22 (0.4%)
- Worked at home: 1,461 (27.3%)

- Unemployment by race in 2022
- Unemployment rate for White non-Hispanic residents
- 7.4%Males
- 3.0%Females
- Unemployment rate for Black residents
- 8.5%Males
- 13.8%Females
- Unemployment rate for American Indian and Alaska Native residents
- 20.8%Males
- 4.3%Females
- Unemployment rate for Asian residents
- 0.8%Males
- 4.0%Females
- Unemployment rate for other race residents
- 10.8%Males
- 2.3%Females
- Unemployment rate for two or more race residents
- 1.1%Males
- 9.8%Females
- Unemployment rate for Hispanic or Latino residents
- 6.4%Males
- 5.6%Females
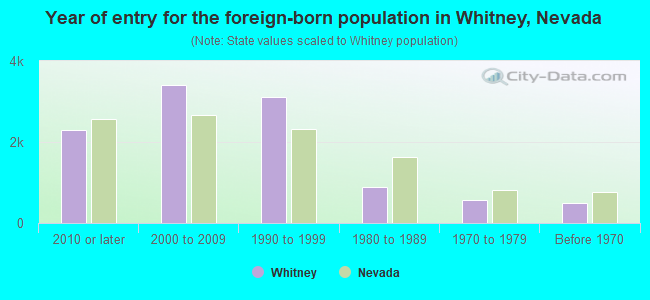
- Year of entry for the foreign-born population in Whitney, Nevada
- 2,2982010 or later
- 3,3992000 to 2009
- 3,1111990 to 1999
- 8981980 to 1989
- 5801970 to 1979
- 488Before 1970
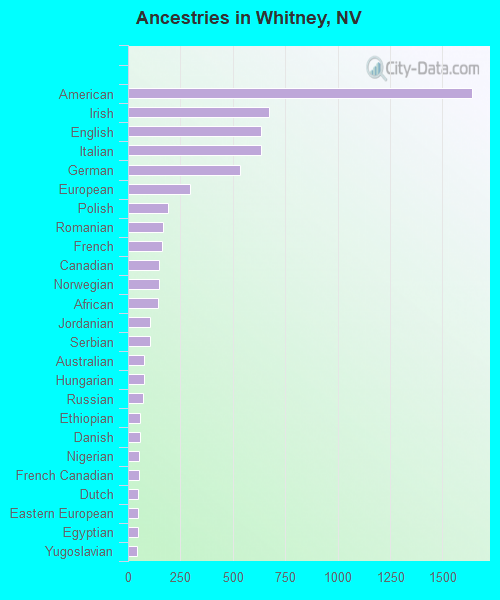
First ancestries reported:
- American: 1,640 (6.2%)
- Irish: 674 (2.5%)
- English: 636 (2.4%)
- Italian: 636 (2.4%)
- German: 533 (2.0%)
- European: 294 (1.1%)
- Polish: 191 (0.7%)
- Romanian: 169 (0.6%)
- French: 162 (0.6%)
- Canadian: 147 (0.6%)
- Norwegian: 146 (0.6%)
- African: 141 (0.5%)
- Jordanian: 104 (0.4%)
- Serbian: 103 (0.4%)
- Australian: 77 (0.3%)
- Hungarian: 74 (0.3%)
- Russian: 72 (0.3%)
- Ethiopian: 59 (0.2%)
- Danish: 58 (0.2%)
- Nigerian: 54 (0.2%)
- French Canadian: 52 (0.2%)
- Dutch: 50 (0.2%)
- Eastern European: 48 (0.2%)
- Egyptian: 47 (0.2%)
- Yugoslavian: 41 (0.2%)
- Jamaican: 39 (0.1%)
- Scottish: 33 (0.1%)
- Scandinavian: 29 (0.1%)
- Scotch-Irish: 29 (0.1%)
- Czech: 28 (0.1%)
- Liberian: 26 (0.10%)
- Welsh: 23 (0.09%)
- Swedish: 23 (0.09%)
- Armenian: 21 (0.08%)
- Iranian: 20 (0.08%)
- Haitian: 17 (0.06%)
- Finnish: 13 (0.05%)
- Lebanese: 10 (0.04%)
- Slovak: 10 (0.04%)
- British: 9 (0.03%)
- Brazilian: 8 (0.03%)
- Lithuanian: 8 (0.03%)
- Iraqi: 7 (0.03%)
- Austrian: 7 (0.03%)
- Portuguese: 7 (0.03%)
- Swiss: 6 (0.02%)
- Pennsylvania German: 5 (0.02%)
- Trinidadian and Tobagonian: 3 (0.01%)
Most common places of birth for foreign-born residents (%):
| Whitney: | 35.2% (4,322) |
| Nevada: | 36.8% (218,248) |
| Whitney: | 25.3% (3,105) |
| Nevada: | 15.5% (91,628) |
| Whitney: | 11.8% (1,446) |
| Nevada: | 4.2% (24,711) |
| Whitney: | 6.2% (761) |
| Nevada: | 4.0% (23,923) |
| Whitney: | 2.8% (349) |
| Nevada: | 0.7% (3,973) |
| Whitney: | 2.2% (272) |
| Nevada: | 0.8% (4,679) |
| Whitney: | 1.5% (190) |
| Nevada: | 1.8% (10,941) |
| Whitney: | 1.5% (188) |
| Nevada: | 2.4% (14,384) |
Place of birth for U.S.-born residents:
- This state: 10,337
- Other state: 21,952
- Northeast: 2,835
- Midwest: 4,543
- South: 2,432
- West: 12,127
87.9% of Whitney residents lived in the same house 1 years ago.
Out of people who lived in different houses, 40.9% lived in this county.
Out of people who lived in different counties, 0.0% lived in Nevada.
| Whitney: | 87.9% |
| State average: | 86.4% |
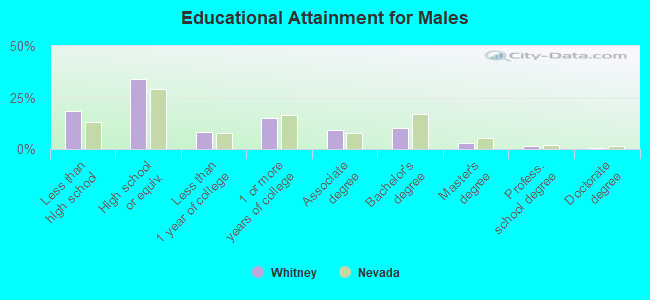
Education attainment for males 25 years and older:
- No schooling: 476
- Nursery to 4th grade: 253
- 5th and 6th grade: 282
- 7th and 8th grade: 120
- 9th grade: 107
- 10th grade: 112
- 11th grade: 406
- 12th grade, no diploma: 1,042
- High school graduate (or equivalency): 5,070
- Less than 1 year of college: 1,204
- Some college more than 1 year, no degree: 2,237
- Associate degree: 1,417
- Bachelor's degree: 1,533
- Master's degree: 450
- Professional school degree: 220
- Doctorate degree: 63
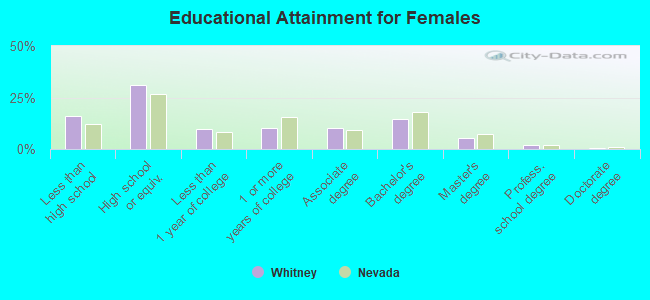
Education attainment for females 25 years and older:
- No schooling: 579
- Nursery to 4th grade: 123
- 5th and 6th grade: 346
- 7th and 8th grade: 41
- 9th grade: 111
- 10th grade: 158
- 11th grade: 303
- 12th grade, no diploma: 880
- High school graduate (or equivalency): 4,896
- Less than 1 year of college: 1,554
- Some college more than 1 year, no degree: 1,610
- Associate degree: 1,631
- Bachelor's degree: 2,282
- Master's degree: 827
- Professional school degree: 333
- Doctorate degree: 66
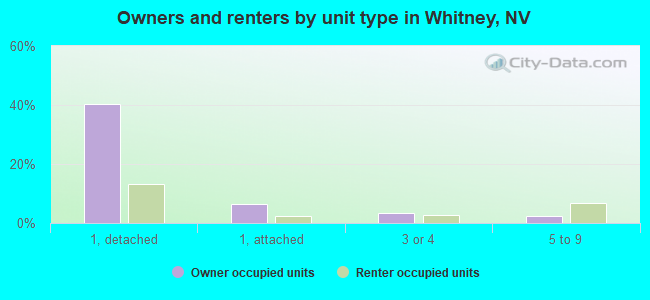
Housing units in structures:
- One, detached: 10,060
- One, attached: 1,515
- Two: 205
- 3 or 4: 1,537
- 5 to 9: 1,649
- 10 to 19: 1,002
- 20 to 49: 625
- 50 or more: 1,318
- Mobile homes: 670
- Boats, RVs, vans, etc.: 85
Median worth of mobile homes: $111,839
Housing units lacking complete kitchen facilities in 2022: 0.9%
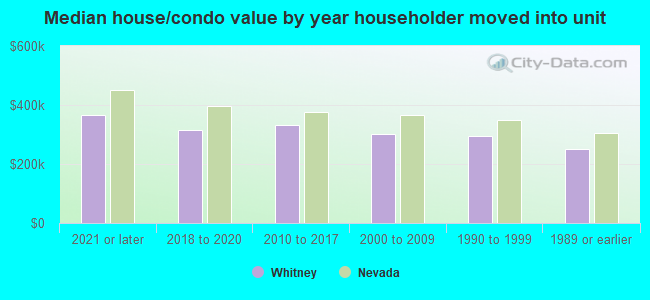
House/condo owner moved in on average 7 years ago
Renter moved in on average 4 years ago
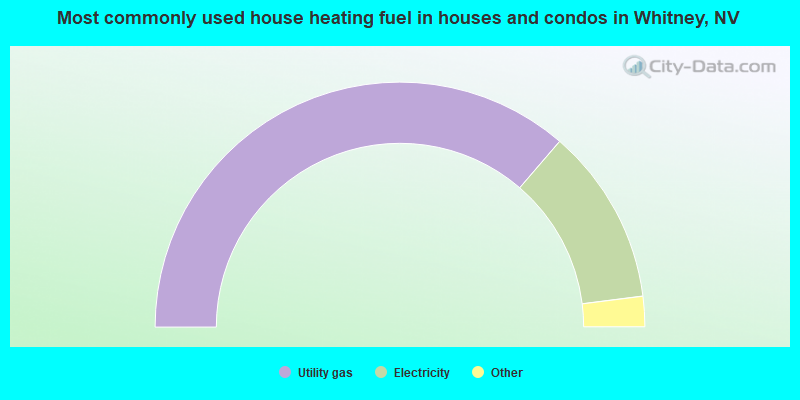
- 72.7%Utility gas
- 23.4%Electricity
- 1.5%Bottled, tank, or LP gas
- 1.2%Solar energy
- 1.0%No fuel used
- 0.2%Wood
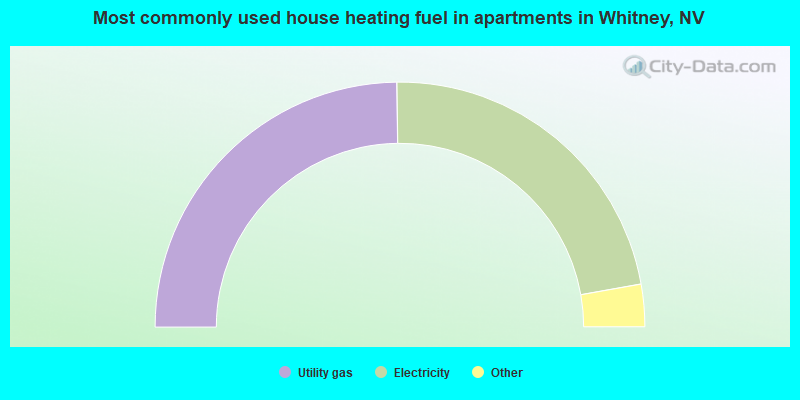
- 49.6%Utility gas
- 44.8%Electricity
- 3.5%Bottled, tank, or LP gas
- 1.5%No fuel used
- 0.2%Fuel oil, kerosene, etc.
- 0.2%Coal or coke
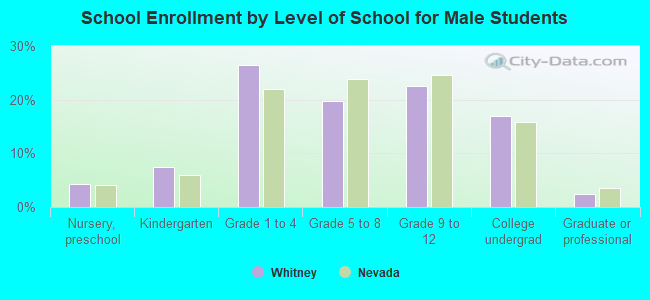
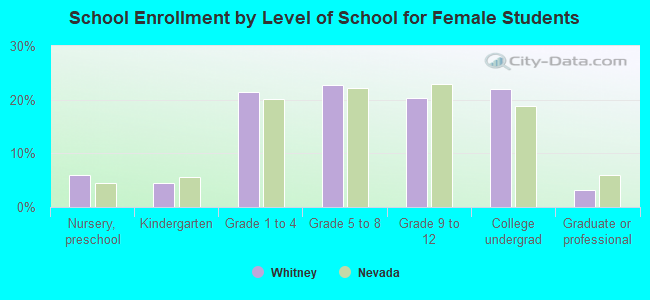
Private vs. public school enrollment:
| Here: | 13.9% |
| Nevada: | 12.9% |
| Here: | 8.9% |
| Nevada: | 6.9% |
| Here: | 14.0% |
| Nevada: | 16.0% |