Wilbraham, MA (Massachusetts) Houses and Residents
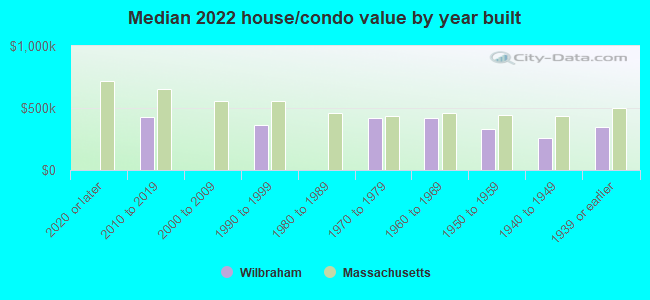
| Wilbraham: | $374,785 |
| Massachusetts: | $534,700 |
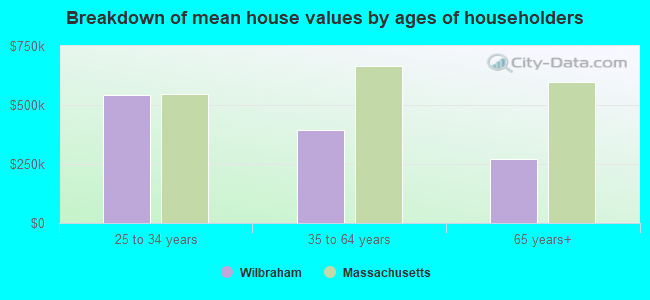
Mean price in 2022:
Detached houses: $363,925
Here: $363,925 State: $651,570 Townhouses or other attached units: $469,142
Here: $469,142 State: $617,749
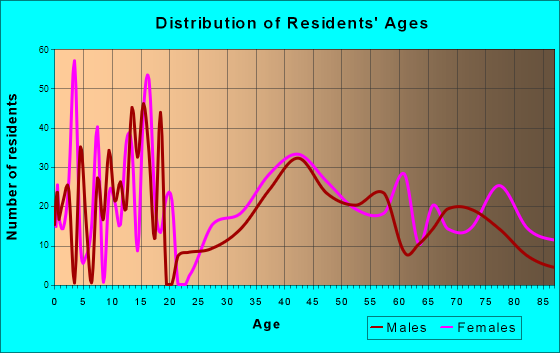
Total population: 3,915 (Urban population: 2,606, Rural population: 884 (all nonfarm))
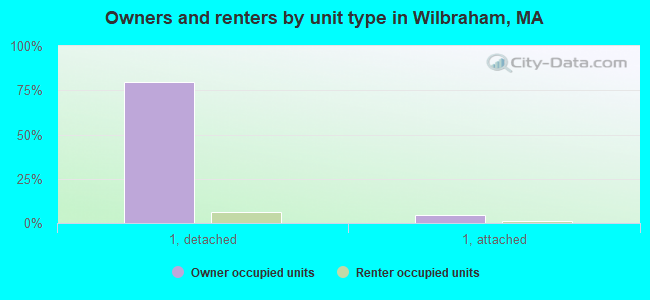
Houses: 1,480 (1,405 occupied: 1,194 owner occupied, 208 renter occupied)
| % of renters here: | 15% |
| State: | 38% |
Housing density: 262 houses/condos per square mile
Median price asked for vacant for-sale houses and condos in 2022 in this county: $294,896.
Median contract rent in 2022: $711 (lower quartile is $605, upper quartile is $1,366)
Median gross rent in Wilbraham, MA in 2022: $1,083
Housing units in Wilbraham with a mortgage: 667 (85 second mortgage, 0 home equity loan, 55 both second mortgage and home equity loan)
Houses without a mortgage: 54
Median household income for houses/condos with a mortgage: $115,028
Median monthly housing costs: $1,318
Compare current foreclosures near Wilbraham, MA:
| Photo | Address | Area | Beds / Baths | Price | Details |
|---|---|---|---|---|---|

|
#1
Bartlett Ave
Wilbraham, MA 01095
|
1,523 sq. feet
|
2 baths 4 beds |
show details | |

|
#2
Cherry Dr
Wilbraham, MA 01095
|
1,342 sq. feet
|
1 baths 1 beds |
show details | |

|
#3
Boston Rd
Wilbraham, MA 01095
|
1,288 sq. feet
|
1 baths 3 beds |
show details | |

|
#4
Pineywood Ave
Wilbraham, MA 01095
|
1,310 sq. feet
|
1 baths 4 beds |
show details | |

|
#5
Pidgeon Dr
Wilbraham, MA 01095
|
1,857 sq. feet
|
2 baths 4 beds |
show details | |

|
#6
Maple St
Wilbraham, MA 01095
|
59,700 sq. feet
|
4 baths 5 beds |
show details | |

|
#7
Pidgeon Dr
Wilbraham, MA 01095
|
1,572 sq. feet
|
2 baths 4 beds |
show details | |

|
#8
Pomeroy St
Wilbraham, MA 01095
|
1,455 sq. feet
|
2 baths 3 beds |
show details | |

|
#9
Manchonis Rd
Wilbraham, MA 01095
|
- sq. feet
|
- baths - beds |
show details | |

|
#10
Three Rivers Rd
Wilbraham, MA 01095
|
- sq. feet
|
- baths - beds |
show details |
| Photo | Address | Area | Beds / Baths | Price | Details |
|---|---|---|---|---|---|

|
#11
Juniper Dr
Wilbraham, MA 01095
|
- sq. feet
|
- baths - beds |
show details | |

|
#12
Boston Rd Apt N137
Wilbraham, MA 01095
|
- sq. feet
|
- baths - beds |
show details | |

|
#13
Mountain Rd
Stafford Springs, CT 06076
|
1,235 sq. feet
|
2 baths 3 beds |
$299,900
|
show details |

|
#14
Walnut Street
Springfield, MA 01105
|
2,850 sq. feet
|
2 baths 6 beds |
$110,000
|
show details |

|
#15
Daytona St
Springfield, MA 01108
|
1,825 sq. feet
|
2 baths 6 beds |
$166,400
|
show details |

|
#16
State St
Bondsville, MA 01009
|
1,381 sq. feet
|
1 baths 3 beds |
$135,000
|
show details |

|
#17
Jondot Dr
Enfield, CT 06082
|
1,385 sq. feet
|
1 baths 3 beds |
$299,900
|
show details |

|
#18
W Franklin St
Holyoke, MA 01040
|
1,558 sq. feet
|
1 baths 2 beds |
$234,900
|
show details |

|
#19
Sanford Ave
Enfield, CT 06082
|
21 sq. feet
|
1 baths 4 beds |
$225,000
|
show details |

|
#20
Tolland Ave
Stafford Springs, CT 06076
|
896 sq. feet
|
1 baths 3 beds |
$100,000
|
show details |
| Photo | Address | Area | Beds / Baths | Price | Details |
|---|---|---|---|---|---|

|
#21
Cold Spring Rd
Southampton, MA 01073
|
2,736 sq. feet
|
1 baths 3 beds |
$284,900
|
show details |

|
#22
Newman St
Springfield, MA 01105
|
1,676 sq. feet
|
2 baths 3 beds |
$45,900
|
show details |

|
#23
Poole Rd
Belchertown, MA 01007
|
800 sq. feet
|
1 baths 2 beds |
show details | |

|
#24
Woodland Dr
Hampden, MA 01036
|
972 sq. feet
|
1 baths 3 beds |
show details | |

|
#25
Ontario St
Springfield, MA 01104
|
1,260 sq. feet
|
1 baths 3 beds |
show details | |

|
#26
Newbury St
Springfield, MA 01104
|
1,308 sq. feet
|
1 baths 3 beds |
show details | |

|
#27
Finch Rd
Springfield, MA 01119
|
864 sq. feet
|
1 baths 3 beds |
show details | |

|
#28
Amber Rd
Holland, MA 01521
|
1,363 sq. feet
|
1 baths 3 beds |
show details | |

|
#29
Catherine St
Chicopee, MA 01013
|
1,073 sq. feet
|
1 baths 2 beds |
show details | |

|
#30
Laroche St
Ludlow, MA 01056
|
1,321 sq. feet
|
1 baths 3 beds |
show details |
| Photo | Address | Area | Beds / Baths | Price | Details |
|---|---|---|---|---|---|

|
#31
Dunn Rd
Longmeadow, MA 01106
|
2,400 sq. feet
|
3 baths 3 beds |
show details | |

|
#32
Royal St
Chicopee, MA 01020
|
3,296 sq. feet
|
4 baths 7 beds |
show details | |

|
#33
Worthy Ave
West Springfield, MA 01089
|
1,501 sq. feet
|
1 baths 3 beds |
show details | |

|
#34
Johnson St
Springfield, MA 01108
|
2,432 sq. feet
|
2 baths 6 beds |
show details | |

|
#35
Main St
Palmer, MA 01069
|
1,114 sq. feet
|
2 baths 3 beds |
show details | |

|
#36
Hovey Rd
Monson, MA 01057
|
2,256 sq. feet
|
1 baths 4 beds |
show details | |

|
#37
Wendover Rd
Suffield, CT 06078
|
3,204 sq. feet
|
2 baths 4 beds |
show details | |

|
#38
Stuart St
Springfield, MA 01119
|
864 sq. feet
|
1 baths 3 beds |
show details | |

|
#39
Eldbert Street
Springfield, MA 01109
|
1,218 sq. feet
|
1 baths 3 beds |
show details | |

|
#40
Fountain St
Springfield, MA 01108
|
1,540 sq. feet
|
1 baths 3 beds |
show details |
| Photo | Address | Area | Beds / Baths | Price | Details |
|---|---|---|---|---|---|

|
#41
Webber Rd
Brookfield, MA 01506
|
960 sq. feet
|
1 baths 3 beds |
show details | |

|
#42
Notre Dame St
Springfield, MA 01104
|
1,310 sq. feet
|
2 baths 4 beds |
show details | |

|
#43
Montgomery St
Westfield, MA 01085
|
1,714 sq. feet
|
2 baths 4 beds |
show details | |

|
#44
Fieldston St
Springfield, MA 01119
|
848 sq. feet
|
1 baths 1 beds |
show details | |

|
#45
Ontario St
Springfield, MA 01104
|
1,405 sq. feet
|
1 baths 3 beds |
show details | |

|
#46
Foster St
Springfield, MA 01105
|
1,512 sq. feet
|
2 baths 4 beds |
show details | |

|
#47
Colburn Rd
Stafford Springs, CT 06076
|
1,114 sq. feet
|
1 baths 2 beds |
show details | |

|
#48
Newbury St
Springfield, MA 01104
|
1,504 sq. feet
|
1 baths 3 beds |
show details | |

|
#49
Arthur St
Springfield, MA 01104
|
823 sq. feet
|
1 baths 2 beds |
show details | |

|
Check over 1 million property listings on Foreclosure.com!
|
browse all offers | |||

Latest news about housing in Wilbraham, MA collected exclusively by city-data.com from local newspapers, TV, and radio stations

 | How Much Massachusetts Households Make Per Year: Census Data (37 replies) |
| Can I get a decent sized house in a safe town in MA for $350k? (30 replies) |
| Oklahoma to (likely Western) Massachusetts - Beginning Research (274 replies) |
| Moving to Massachusetts (75 replies) |
| Could my young family be happy in MA? (152 replies) |
| Good and affordable Western Mass school districts? Where should we live? (37 replies) |
Median year apartment built: 1961
Household type by relationship:
Households: 3,809- Male householders: 687 (115 living alone), Female householders: 703 (207 living alone)
948 spouses (948 opposite-sex spouses), 51 unmarried partners, (51 opposite-sex unmarried partners), 909 children (753 natural, 67 adopted, 88 stepchildren), 57 grandchildren, 14 brothers or sisters, 68 parents, 0 foster children, 15 other relatives, 8 non-relatives
- In group quarters: 343
Size of family households: 485 2-persons, 300 3-persons, 139 4-persons, 57 5-persons, 11 6-persons.
Size of nonfamily households: 349 1-person, 59 2-persons.
613 married couples with children.
7 single-parent households (0 men, 7 women).
91.5% of residents of Wilbraham speak English at home.
2.6% of residents speak Spanish at home (96% speak English very well, 4% don't speak English at all).
3.1% of residents speak other Indo-European language at home (80% speak English very well, 20% speak English not well).
5.7% of residents speak Asian or Pacific Island language at home (22% speak English very well, 12% speak English well, 6% speak English not well, 60% don't speak English at all).
Foreign born population: 145 (3.8%)
(37.2% of them are naturalized citizens)
| Here: | 6.3 |
| State: | 6.5 |
| Here: | 3.5 |
| State: | 4.0 |
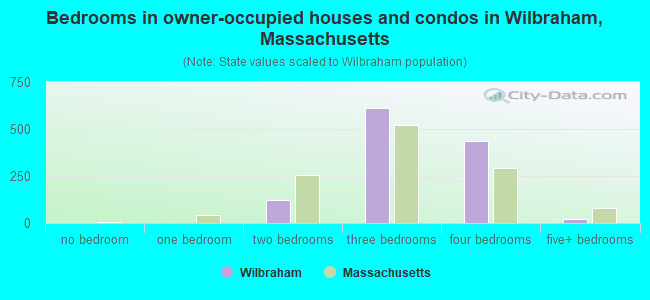
- Bedrooms in owner-occupied houses and condos in Wilbraham, Massachusetts
- 0no bedroom
- 01 bedroom
- 1242 bedrooms
- 6113 bedrooms
- 4384 bedrooms
- 215+ bedrooms
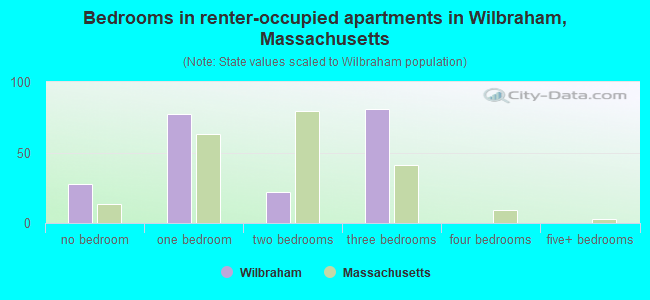
- Bedrooms in renter-occupied apartments in Wilbraham, Massachusetts
- 28no bedroom
- 771 bedroom
- 222 bedrooms
- 813 bedrooms
- 04 bedrooms
- 05+ bedrooms
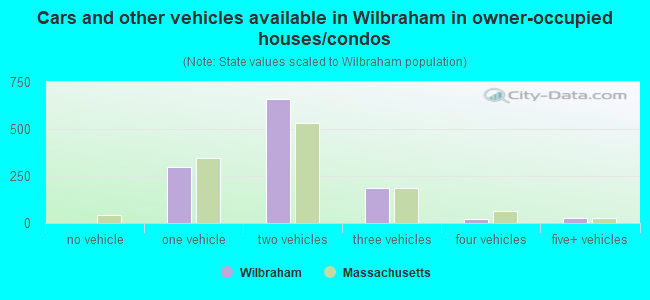
- Cars and other vehicles available in Wilbraham in owner-occupied houses/condos
- 0no vehicle
- 2991 vehicle
- 6622 vehicles
- 1873 vehicles
- 204 vehicles
- 265+ vehicles
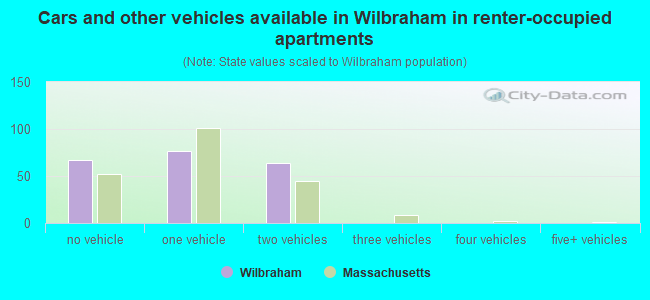
- Cars and other vehicles available in Wilbraham in renter-occupied apartments
- 67no vehicle
- 771 vehicle
- 642 vehicles
- 03 vehicles
- 04 vehicles
- 05+ vehicles
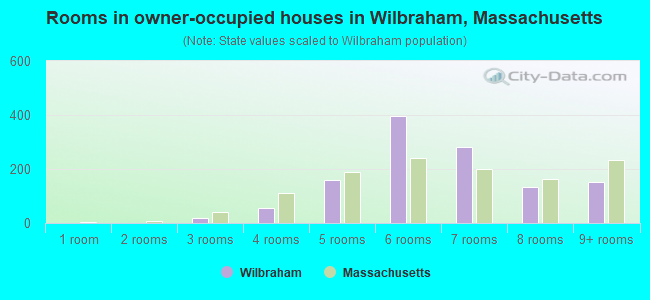
- Rooms in owner-occupied houses in Wilbraham, Massachusetts
- 01 room
- 02 rooms
- 203 rooms
- 544 rooms
- 1585 rooms
- 3956 rooms
- 2817 rooms
- 1348 rooms
- 1529+ rooms
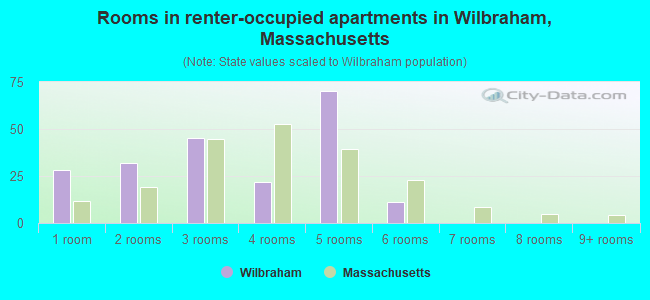
- Rooms in renter-occupied apartments in Wilbraham, Massachusetts
- 281 room
- 322 rooms
- 453 rooms
- 224 rooms
- 705 rooms
- 116 rooms
- 07 rooms
- 08 rooms
- 09+ rooms
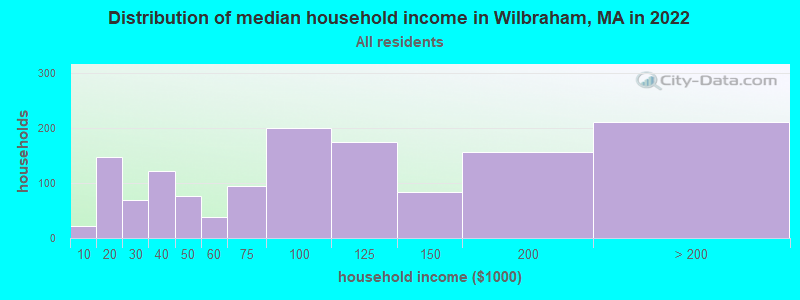
Wilbraham, MA household income distribution

- 21Less than $10,000
- 147$10,000 to $19,999
- 70$20,000 to $29,999
- 122$30,000 to $39,999
- 76$40,000 to $49,999
- 39$50,000 to $59,999
- 95$60,000 to $74,999
- 200$75,000 to $99,999
- 174$100,000 to $124,999
- 83$125,000 to $149,999
- 157$150,000 to $199,999
- 211$200,000 or more
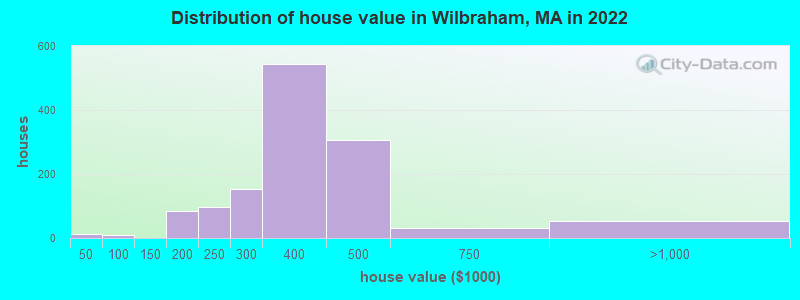
Home value of owner - occupied houses in 2022 in Wilbraham, MA
-
- 13$30,000 to $34,999
- 7$90,000 to $99,999
- 74$150,000 to $174,999
- 10$175,000 to $199,999
- 95$200,000 to $249,999
- 152$250,000 to $299,999
- 542$300,000 to $399,999
- 305$400,000 to $499,999
- 31$500,000 to $749,999
- 53$750,000 to $999,999
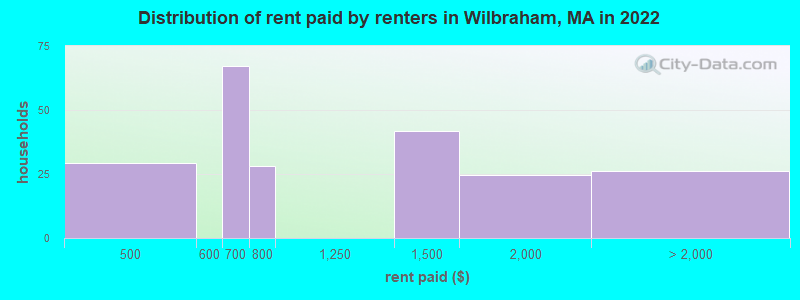
Rent paid by renters in 2022 in Wilbraham, MA
-
- 29$450 to $499
- 22$600 to $649
- 45$650 to $699
- 28$750 to $799
- 41$1,250 to $1,499
- 24$1,500 to $1,999
- 26No cash rent
Percentage of workers working in this county: 77.2%
Number of people working at home: 157 (9.9% of all workers)
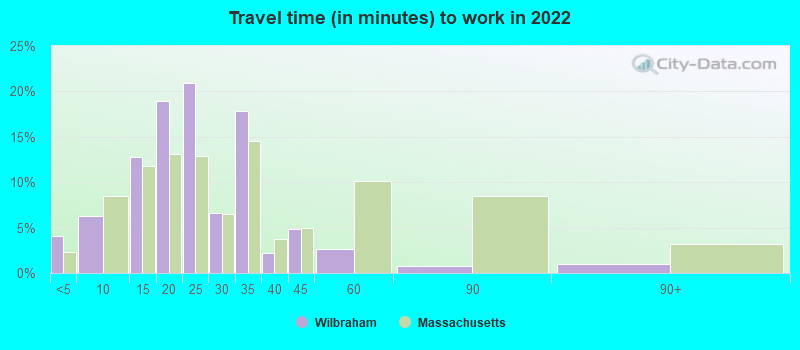
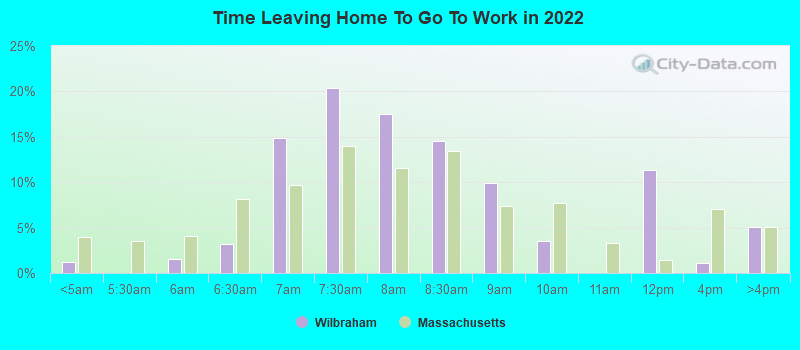
Travel time to work (commute)
- Less than 5 minutes: 30
- 5 to 9 minutes: 193
- 10 to 14 minutes: 151
- 15 to 19 minutes: 182
- 20 to 24 minutes: 256
- 25 to 29 minutes: 125
- 30 to 34 minutes: 259
- 35 to 39 minutes: 37
- 40 to 44 minutes: 27
- 45 to 59 minutes: 92
- 60 to 89 minutes: 8
- 90 or more minutes: 49
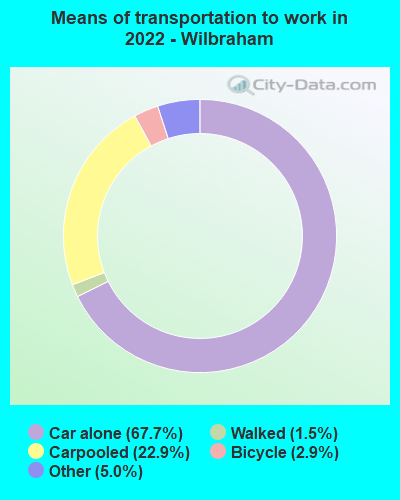
Means of transportation to work:
- Drove a car alone: 1,085 (59.4%)
- Carpooled: 506 (27.7%)
- Taxi: 140 (7.7%)
- Bicycle: 45 (2.5%)
- Walked: 28 (1.5%)
- Worked at home: 157 (8.6%)
- Unemployment by race in 2022
- Unemployment rate for White non-Hispanic residents
- 1.5%Males
- 4.4%Females
- Unemployment rate for other race residents
- 100.0%Males
- Unemployment rate for Hispanic or Latino residents
- 18.4%Males

- Year of entry for the foreign-born population in Wilbraham, Massachusetts
- 622010 or later
- 332000 to 2009
- 251990 to 1999
- 191980 to 1989
- 331970 to 1979
- 64Before 1970
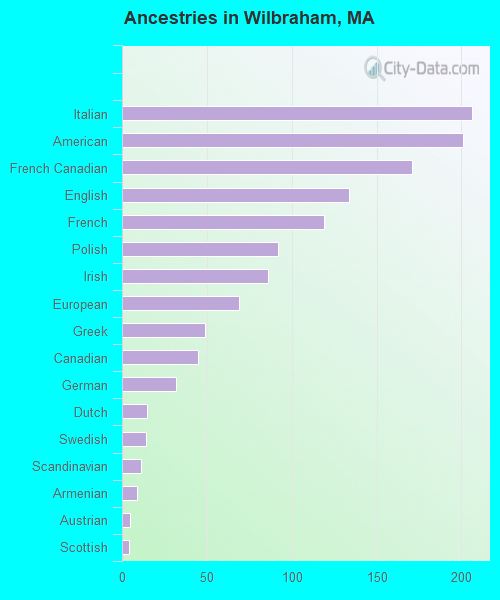
First ancestries reported:
- Italian: 206 (12.7%)
- American: 201 (12.4%)
- French Canadian: 171 (10.6%)
- English: 134 (8.3%)
- French: 119 (7.4%)
- Polish: 92 (5.7%)
- Irish: 86 (5.3%)
- European: 69 (4.3%)
- Greek: 49 (3.0%)
- Canadian: 45 (2.8%)
- German: 32 (2.0%)
- Dutch: 15 (0.9%)
- Swedish: 14 (0.9%)
- Scandinavian: 11 (0.7%)
- Armenian: 9 (0.6%)
- Austrian: 5 (0.3%)
- Scottish: 4 (0.2%)
Most common places of birth for foreign-born residents (%):
| Wilbraham: | 51.4% (75) |
| Massachusetts: | 8.4% (103,233) |
| Wilbraham: | 22.6% (33) |
| Massachusetts: | 3.0% (37,197) |
| Wilbraham: | 17.1% (25) |
| Massachusetts: | 2.3% (28,158) |
Place of birth for U.S.-born residents:
- This state: 2,848
- Other state: 695
- Northeast: 441
- Midwest: 159
- South: 103
- West: 4
96.8% of Wilbraham residents lived in the same house 1 years ago.
Out of people who lived in different houses, 43.2% lived in this county.
Out of people who lived in different counties, 100.0% lived in Massachusetts.
| Wilbraham: | 96.8% |
| State average: | 87.7% |
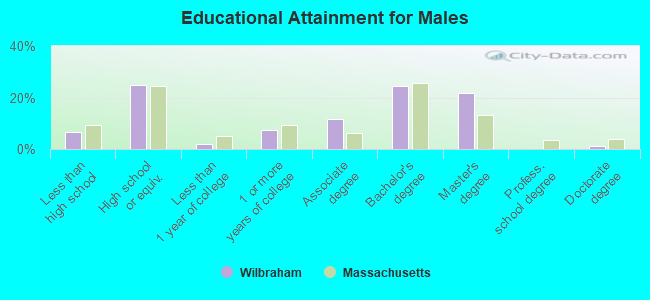
Education attainment for males 25 years and older:
- No schooling: 31
- Nursery to 4th grade: 3
- 5th and 6th grade: 0
- 7th and 8th grade: 23
- 9th grade: 0
- 10th grade: 0
- 11th grade: 9
- 12th grade, no diploma: 19
- High school graduate (or equivalency): 315
- Less than 1 year of college: 25
- Some college more than 1 year, no degree: 93
- Associate degree: 148
- Bachelor's degree: 308
- Master's degree: 272
- Professional school degree: 0
- Doctorate degree: 15
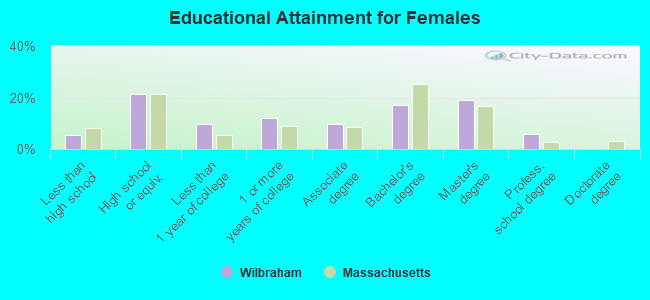
Education attainment for females 25 years and older:
- No schooling: 27
- Nursery to 4th grade: 0
- 5th and 6th grade: 0
- 7th and 8th grade: 9
- 9th grade: 44
- 10th grade: 11
- 11th grade: 0
- 12th grade, no diploma: 0
- High school graduate (or equivalency): 368
- Less than 1 year of college: 169
- Some college more than 1 year, no degree: 205
- Associate degree: 168
- Bachelor's degree: 294
- Master's degree: 326
- Professional school degree: 101
- Doctorate degree: 0

Housing units in structures:
- One, detached: 1,277
- One, attached: 81
- 3 or 4: 47
- 50 or more: 75
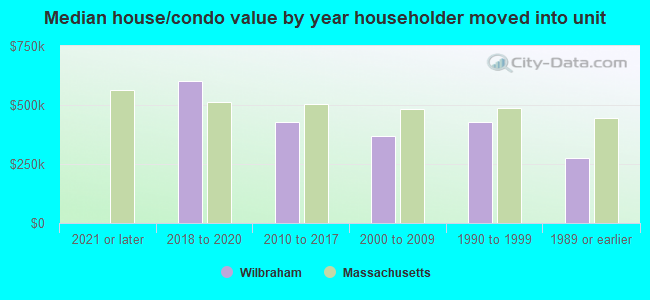
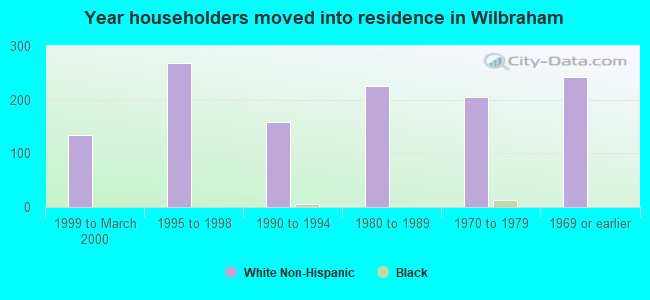
House/condo owner moved in on average 17 years ago
Renter moved in on average 2 years ago
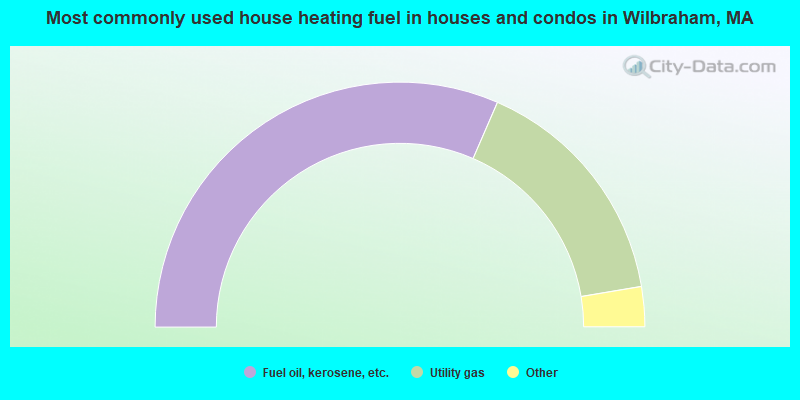
- 63.1%Fuel oil, kerosene, etc.
- 31.7%Utility gas
- 3.9%Bottled, tank, or LP gas
- 1.3%Other fuel
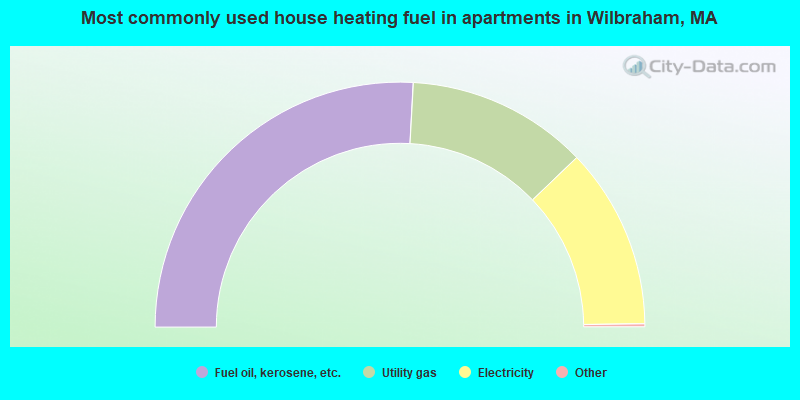
- 51.9%Fuel oil, kerosene, etc.
- 24.0%Utility gas
- 24.0%Electricity
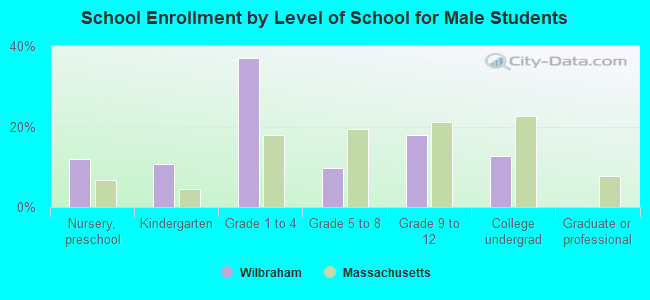
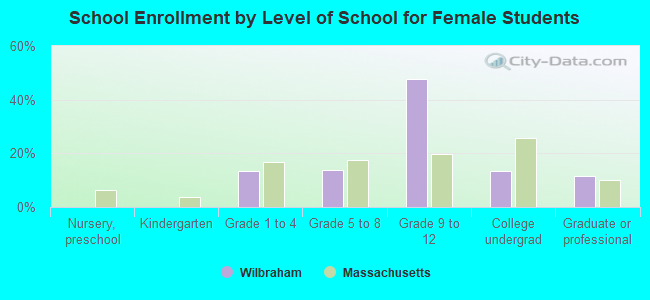
Private vs. public school enrollment:
| Here: | 0.0% |
| Massachusetts: | 10.3% |
| Here: | 20.9% |
| Massachusetts: | 12.3% |
| Here: | 47.5% |
| Massachusetts: | 51.2% |