Williamston, NC (North Carolina) Houses and Residents
| Williamston: | $123,994 |
| North Carolina: | $280,600 |
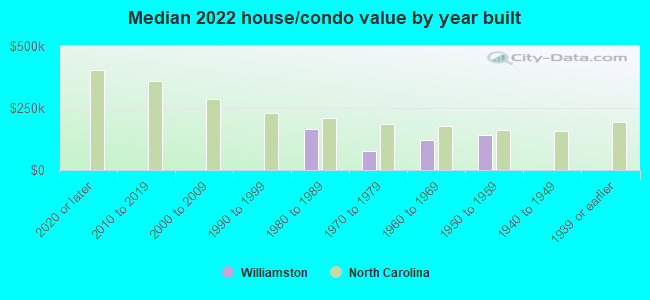
Mean price in 2022:
Detached houses: $151,619
Here: $151,619 State: $375,326 Townhouses or other attached units: $128,654
Here: $128,654 State: $317,935 Mobile homes: $45,532
Here: $45,532 State: $124,933
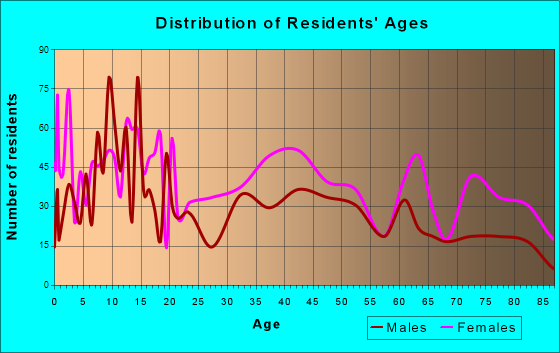
Total population: 5,322 (All urban)
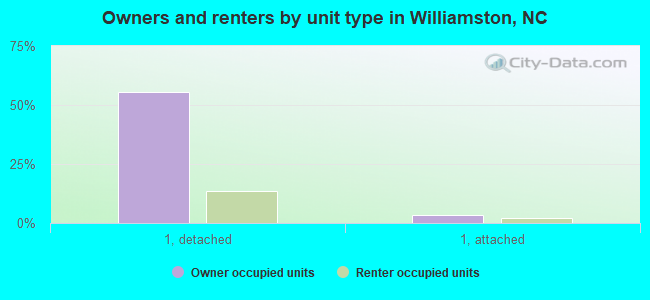
Houses: 2,938 (2,540 occupied: 1,289 owner occupied, 1,288 renter occupied)
| % of renters here: | 50% |
| State: | 33% |
Housing density: 795 houses/condos per square mile
Median price asked for vacant for-sale houses and condos in 2022 in this county: $70,196.
Median contract rent in 2022: $554 (lower quartile is $406, upper quartile is $637)
Median rent asked for vacant for-rent units in 2022: $557
Median gross rent in Williamston, NC in 2022: $719
Housing units in Williamston with a mortgage: 778 (41 second mortgage, 0 home equity loan, 43 both second mortgage and home equity loan)
Houses without a mortgage: 316
Median household income for houses/condos with a mortgage: $67,794
Median household income for apartments without a mortgage: $70,827
Median monthly housing costs: $726
Compare current foreclosures near Williamston, NC:
| Photo | Address | Area | Beds / Baths | Price | Details |
|---|---|---|---|---|---|

|
#1
Poplar Point Rd
Williamston, NC 27892
|
1,137 sq. feet
|
2 baths 3 beds |
show details | |

|
#2
Abbitt Rd
Williamston, NC 27892
|
1,368 sq. feet
|
1 baths 3 beds |
show details | |

|
#3
Williams Rd
Williamston, NC 27892
|
2,260 sq. feet
|
2 baths 3 beds |
show details | |

|
#4
Prison Camp Rd
Williamston, NC 27892
|
1,144 sq. feet
|
1 baths 2 beds |
show details | |

|
#5
Bonnie Best Rd
Williamston, NC 27892
|
1,056 sq. feet
|
1 baths 3 beds |
show details | |

|
#6
Bear Grass Rd
Williamston, NC 27892
|
2,057 sq. feet
|
2 baths 3 beds |
show details | |

|
#7
Hatton St
Williamston, NC 27892
|
1,075 sq. feet
|
2 baths 3 beds |
show details | |

|
#8
W Main St
Williamston, NC 27892
|
1,534 sq. feet
|
2 baths 3 beds |
show details | |

|
#9
Everetts Rd
Williamston, NC 27892
|
1,836 sq. feet
|
2 baths 3 beds |
show details | |

|
#10
N Haines St
Williamston, NC 27892
|
1,000 sq. feet
|
1 baths 3 beds |
show details |
| Photo | Address | Area | Beds / Baths | Price | Details |
|---|---|---|---|---|---|

|
#11
Sunset Dr
Williamston, NC 27892
|
1,348 sq. feet
|
1 baths 3 beds |
show details | |

|
#12
Bailey Rd
Williamston, NC 27892
|
1,792 sq. feet
|
2 baths 3 beds |
show details | |

|
#13
Us Highway 64
Williamston, NC 27892
|
1,512 sq. feet
|
2 baths 3 beds |
show details | |

|
#14
Mccaskey Rd
Williamston, NC 27892
|
1,680 sq. feet
|
2 baths 3 beds |
show details | |

|
#15
W Church St
Williamston, NC 27892
|
1,344 sq. feet
|
2 baths - beds |
show details | |

|
#16
Gatling St, Apt 18
Williamston, NC 27892
|
- sq. feet
|
- baths - beds |
show details | |

|
#17
Allen Williams Rd
Williamston, NC 27892
|
- sq. feet
|
- baths - beds |
show details | |

|
#18
Reddicks Grove Church Rd
Williamston, NC 27892
|
- sq. feet
|
- baths - beds |
show details | |

|
#19
W Bear Grass Rd
Williamston, NC 27892
|
- sq. feet
|
- baths - beds |
show details | |

|
#20
Harrison Rd
Williamston, NC 27892
|
- sq. feet
|
- baths - beds |
show details |
| Photo | Address | Area | Beds / Baths | Price | Details |
|---|---|---|---|---|---|

|
#21
Melbourne Ave
Williamston, NC 27892
|
- sq. feet
|
- baths - beds |
show details | |

|
#22
Smith Ln
Williamston, NC 27892
|
- sq. feet
|
- baths - beds |
show details | |

|
#23
Gatling St, Apt 7
Williamston, NC 27892
|
- sq. feet
|
- baths - beds |
show details | |

|
#24
Daniels Ln
Williamston, NC 27892
|
- sq. feet
|
- baths - beds |
show details | |

|
#25
Eds Grocery Rd # 23
Williamston, NC 27892
|
- sq. feet
|
- baths - beds |
show details | |

|
#26
E Main St # 282
Williamston, NC 27892
|
- sq. feet
|
- baths - beds |
show details | |

|
#27
Garys Ln
Williamston, NC 27892
|
- sq. feet
|
- baths - beds |
show details | |

|
#28
Nc-125 N
Williamston, NC 27892
|
- sq. feet
|
- baths - beds |
show details | |

|
#29
Allen Williams Rd
Williamston, NC 27892
|
- sq. feet
|
- baths - beds |
show details | |

|
#30
Park Ave
Plymouth, NC 27962
|
1,536 sq. feet
|
1 baths - beds |
$22,900
|
show details |
| Photo | Address | Area | Beds / Baths | Price | Details |
|---|---|---|---|---|---|

|
#31
Mount Olive Rd
Windsor, NC 27983
|
1,488 sq. feet
|
2 baths 3 beds |
show details | |

|
#32
Us 13 N
Windsor, NC 27983
|
1,800 sq. feet
|
2 baths 3 beds |
show details | |

|
#33
Cooper Hill Road
Windsor, NC 27983
|
2,112 sq. feet
|
2 baths 3 beds |
show details | |

|
#34
Horace Ward Ave
Windsor, NC 27983
|
1,196 sq. feet
|
2 baths 3 beds |
show details | |

|
#35
Robert Everett Rd
Robersonville, NC 27871
|
2,136 sq. feet
|
1 baths 3 beds |
show details | |

|
#36
S King St
Windsor, NC 27983
|
1,050 sq. feet
|
1 baths 2 beds |
show details | |

|
#37
Claude Green Rd
Robersonville, NC 27871
|
1,347 sq. feet
|
2 baths 3 beds |
show details | |

|
#38
Nc 903
Robersonville, NC 27871
|
1,666 sq. feet
|
2 baths 6 beds |
show details | |

|
#39
S King St
Windsor, NC 27983
|
720 sq. feet
|
1 baths 2 beds |
show details | |

|
#40
Hale St
Windsor, NC 27983
|
1,155 sq. feet
|
1 baths 3 beds |
show details |
| Photo | Address | Area | Beds / Baths | Price | Details |
|---|---|---|---|---|---|

|
#41
Wilson Bunch Ave
Windsor, NC 27983
|
1,296 sq. feet
|
2 baths 3 beds |
show details | |

|
#42
Wilson Street Ext
Plymouth, NC 27962
|
1,756 sq. feet
|
2 baths - beds |
show details | |

|
#43
Rogerson Rd
Robersonville, NC 27871
|
1,344 sq. feet
|
2 baths - beds |
show details | |

|
#44
Country Club Dr
Plymouth, NC 27962
|
1,474 sq. feet
|
2 baths - beds |
show details | |

|
#45
Thoroughfare Rd
Washington, NC 27889
|
- sq. feet
|
- baths - beds |
show details | |

|
#46
S Cherry Ln
Windsor, NC 27983
|
- sq. feet
|
- baths - beds |
show details | |

|
#47
Quitsna Rd
Windsor, NC 27983
|
- sq. feet
|
- baths - beds |
show details | |

|
#48
Morning Rd
Windsor, NC 27983
|
- sq. feet
|
- baths - beds |
show details | |

|
#49
Mcnair Rd
Plymouth, NC 27962
|
- sq. feet
|
- baths - beds |
show details | |

|
Check over 1 million property listings on Foreclosure.com!
|
browse all offers | |||

Latest news about housing in Williamston, NC collected exclusively by city-data.com from local newspapers, TV, and radio stations

 | Help finding an apartment near Williamston NC (2 replies) |
| Areas in NC that are up and coming like Apex was but less expensive (18 replies) |
| I-42 and I-87 (676 replies) |
| Road Construction/Projects in Coastal NC (429 replies) |
| Snowday from hell (16 replies) |
| Proposed I-795 Quad East loop (719 replies) |
Median year apartment built: 1967
Household type by relationship:
Households: 5,338- Male householders: 765 (380 living alone), Female householders: 1,749 (550 living alone)
696 spouses (683 opposite-sex spouses), 123 unmarried partners, (85 opposite-sex unmarried partners), 1,383 children (1,371 natural, 12 adopted, 0 stepchildren), 272 grandchildren, 82 brothers or sisters, 12 parents, 0 foster children, 94 other relatives, 24 non-relatives
- In group quarters: 132
Size of family households: 980 2-persons, 105 3-persons, 111 4-persons, 281 5-persons, 12 7-or-more-persons.
Size of nonfamily households: 947 1-person, 136 2-persons, 8 3-persons.
304 married couples with children.
434 single-parent households (0 men, 434 women).
88.7% of residents of Williamston speak English at home.
9.4% of residents speak Spanish at home (66% speak English very well, 15% speak English well, 19% speak English not well).
0.3% of residents speak other Indo-European language at home (100% speak English not well).
1.8% of residents speak Asian or Pacific Island language at home (10% speak English very well, 50% speak English well, 40% speak English not well).
Foreign born population: 164 (3.1%)
(89.6% of them are naturalized citizens)
| Here: | 6.4 |
| State: | 6.4 |
| Here: | 4.4 |
| State: | 4.4 |
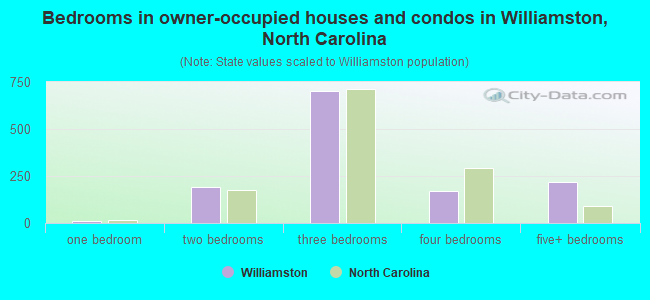
- Bedrooms in owner-occupied houses and condos in Williamston, North Carolina
- 0no bedroom
- 91 bedroom
- 1892 bedrooms
- 7043 bedrooms
- 1724 bedrooms
- 2165+ bedrooms
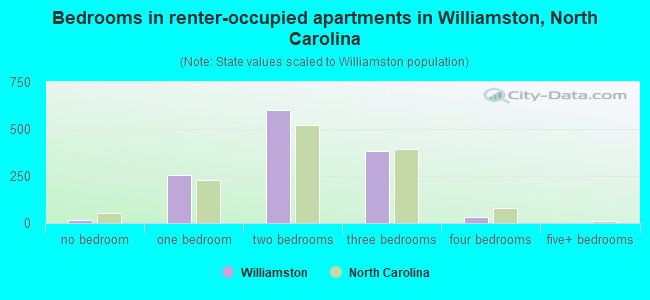
- Bedrooms in renter-occupied apartments in Williamston, North Carolina
- 17no bedroom
- 2561 bedroom
- 6012 bedrooms
- 3833 bedrooms
- 314 bedrooms
- 05+ bedrooms
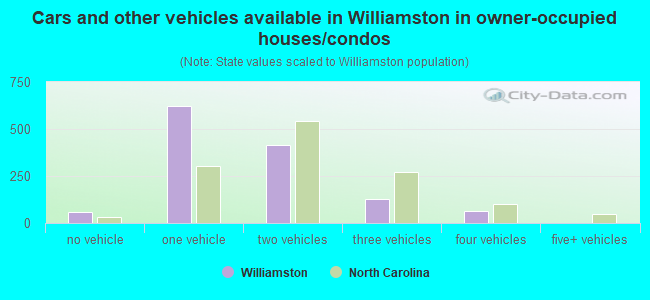
- Cars and other vehicles available in Williamston in owner-occupied houses/condos
- 59no vehicle
- 6251 vehicle
- 4132 vehicles
- 1293 vehicles
- 644 vehicles
- 05+ vehicles
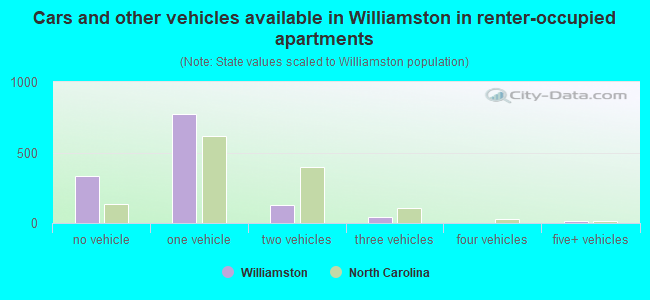
- Cars and other vehicles available in Williamston in renter-occupied apartments
- 334no vehicle
- 7711 vehicle
- 1282 vehicles
- 423 vehicles
- 04 vehicles
- 145+ vehicles
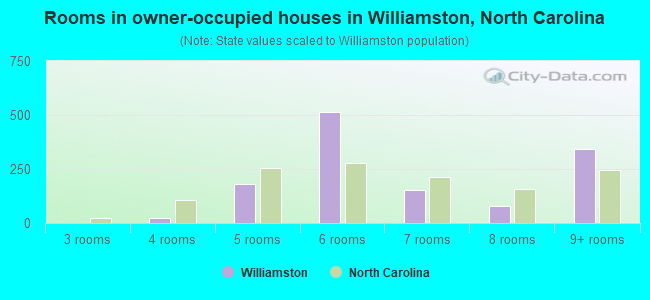
- Rooms in owner-occupied houses in Williamston, North Carolina
- 01 room
- 02 rooms
- 03 rooms
- 244 rooms
- 1795 rooms
- 5156 rooms
- 1517 rooms
- 798 rooms
- 3419+ rooms
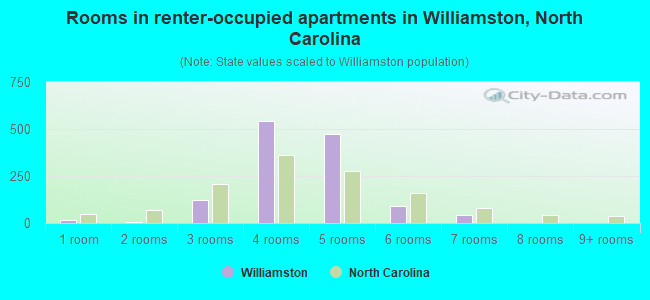
- Rooms in renter-occupied apartments in Williamston, North Carolina
- 171 room
- 52 rooms
- 1233 rooms
- 5404 rooms
- 4725 rooms
- 896 rooms
- 427 rooms
- 08 rooms
- 09+ rooms
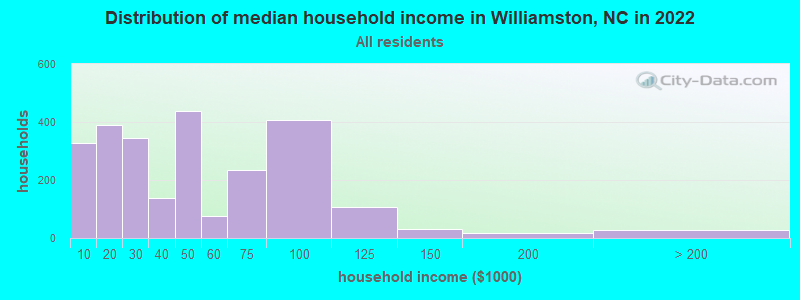
Williamston, NC household income distribution

- 328Less than $10,000
- 391$10,000 to $19,999
- 346$20,000 to $29,999
- 138$30,000 to $39,999
- 439$40,000 to $49,999
- 76$50,000 to $59,999
- 234$60,000 to $74,999
- 408$75,000 to $99,999
- 106$100,000 to $124,999
- 31$125,000 to $149,999
- 17$150,000 to $199,999
- 28$200,000 or more
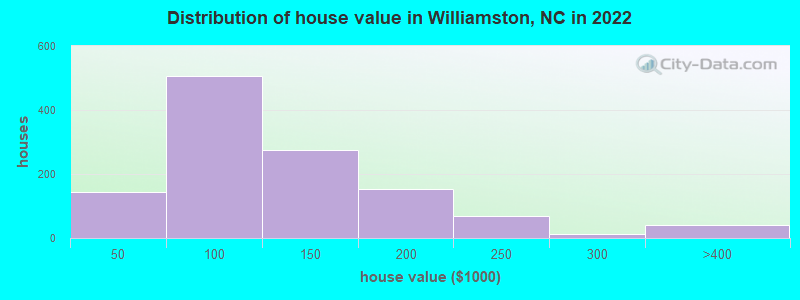
Home value of owner - occupied houses in 2022 in Williamston, NC
-
- 18$10,000 to $14,999
- 10$15,000 to $19,999
- 116$40,000 to $49,999
- 41$50,000 to $59,999
- 248$60,000 to $69,999
- 51$70,000 to $79,999
- 48$90,000 to $99,999
- 172$100,000 to $124,999
- 102$125,000 to $149,999
- 115$150,000 to $174,999
- 37$175,000 to $199,999
- 68$200,000 to $249,999
- 10$250,000 to $299,999
- 32$300,000 to $399,999
- 8$400,000 to $499,999
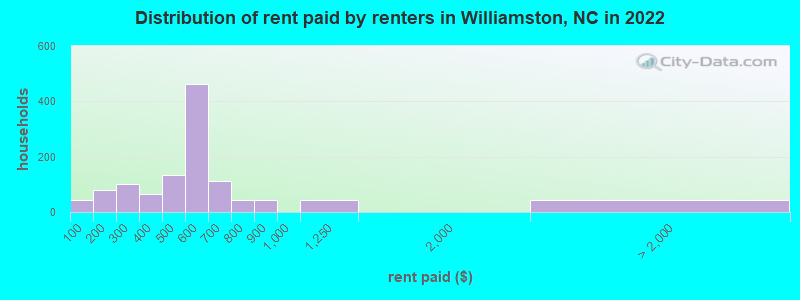
Rent paid by renters in 2022 in Williamston, NC
-
- 43Less than $100
- 53$100 to $149
- 24$150 to $199
- 48$200 to $249
- 51$250 to $299
- 12$300 to $349
- 52$350 to $399
- 39$400 to $449
- 93$450 to $499
- 335$500 to $549
- 127$550 to $599
- 91$600 to $649
- 20$650 to $699
- 44$700 to $749
- 43$800 to $899
- 45$1,000 to $1,249
- 41No cash rent
Percentage of workers working in this county: 58.4%
Number of people working at home: 301 (12.9% of all workers)
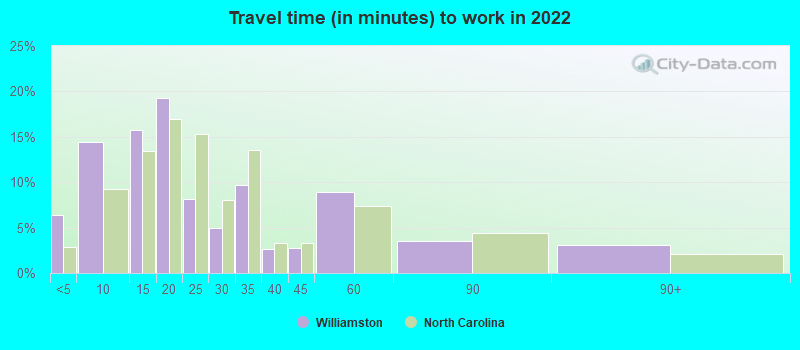
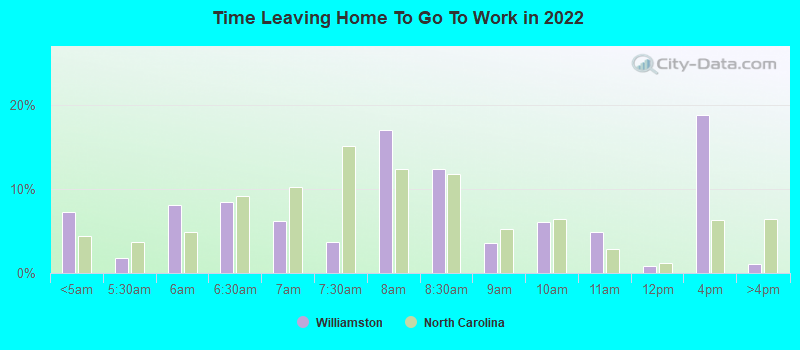
Travel time to work (commute)
- Less than 5 minutes: 471
- 5 to 9 minutes: 365
- 10 to 14 minutes: 199
- 15 to 19 minutes: 140
- 20 to 24 minutes: 38
- 25 to 29 minutes: 86
- 30 to 34 minutes: 137
- 35 to 39 minutes: 55
- 40 to 44 minutes: 102
- 45 to 59 minutes: 353
- 60 to 89 minutes: 46
- 90 or more minutes: 0
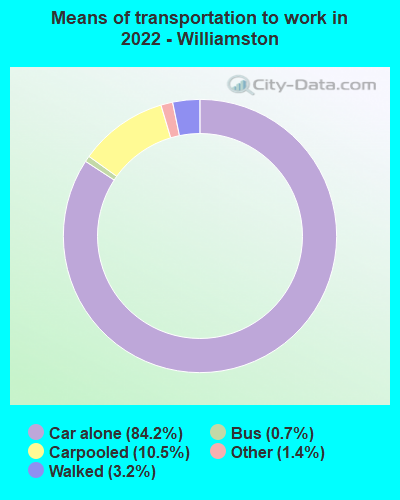
Means of transportation to work:
- Drove a car alone: 3,042 (75.3%)
- Carpooled: 394 (9.8%)
- Bus: 18 (0.4%)
- Taxi: 52 (1.3%)
- Walked: 124 (3.1%)
- Worked at home: 301 (7.4%)
- Unemployment by race in 2022
- Unemployment rate for Black residents
- 10.8%Males
- 28.6%Females
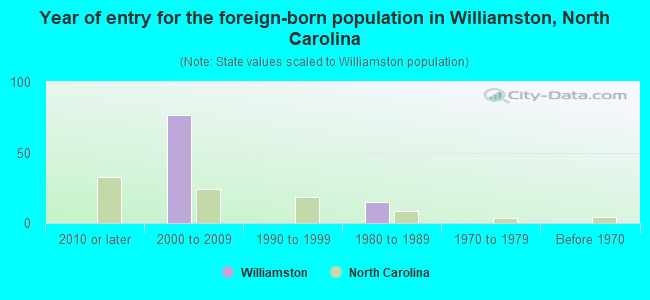
- Year of entry for the foreign-born population in Williamston, North Carolina
- 02010 or later
- 772000 to 2009
- 01990 to 1999
- 151980 to 1989
- 01970 to 1979
- 0Before 1970
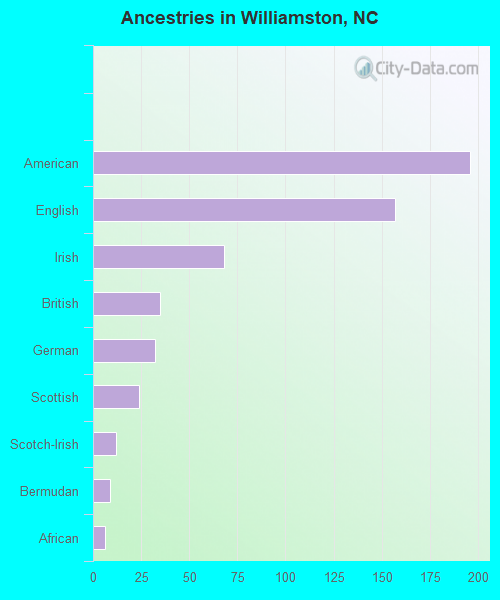
First ancestries reported:
- American: 196 (7.5%)
- English: 157 (6.0%)
- Irish: 68 (2.6%)
- British: 35 (1.3%)
- German: 32 (1.2%)
- Scottish: 24 (0.9%)
- Scotch-Irish: 12 (0.5%)
- Bermudan: 9 (0.3%)
- African: 6 (0.2%)
Most common places of birth for foreign-born residents (%):
| Williamston: | 34.8% (57) |
| North Carolina: | 3.2% (27,477) |
| Williamston: | 17.7% (29) |
| North Carolina: | 1.8% (15,988) |
| Williamston: | 16.5% (27) |
| North Carolina: | 0.5% (4,032) |
| Williamston: | 12.8% (21) |
| North Carolina: | 0.0% (326) |
Place of birth for U.S.-born residents:
- This state: 3,775
- Other state: 1,190
- Northeast: 674
- Midwest: 39
- South: 427
- West: 47
91.6% of Williamston residents lived in the same house 1 years ago.
Out of people who lived in different houses, 13.4% lived in this county.
Out of people who lived in different counties, 99.5% lived in North Carolina.
| Williamston: | 91.6% |
| State average: | 87.3% |
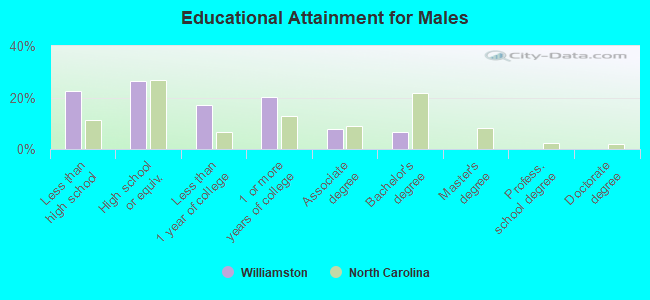
Education attainment for males 25 years and older:
- No schooling: 115
- Nursery to 4th grade: 5
- 5th and 6th grade: 0
- 7th and 8th grade: 23
- 9th grade: 82
- 10th grade: 11
- 11th grade: 68
- 12th grade, no diploma: 25
- High school graduate (or equivalency): 386
- Less than 1 year of college: 248
- Some college more than 1 year, no degree: 294
- Associate degree: 115
- Bachelor's degree: 95
- Master's degree: 0
- Professional school degree: 0
- Doctorate degree: 0
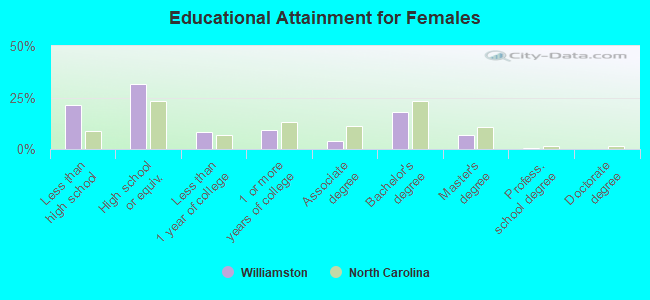
Education attainment for females 25 years and older:
- No schooling: 168
- Nursery to 4th grade: 0
- 5th and 6th grade: 11
- 7th and 8th grade: 19
- 9th grade: 173
- 10th grade: 33
- 11th grade: 93
- 12th grade, no diploma: 10
- High school graduate (or equivalency): 755
- Less than 1 year of college: 197
- Some college more than 1 year, no degree: 219
- Associate degree: 97
- Bachelor's degree: 436
- Master's degree: 168
- Professional school degree: 12
- Doctorate degree: 4
Housing units in structures:
- One, detached: 2,163
- Two: 177
- 3 or 4: 243
- 5 to 9: 70
- 10 to 19: 66
- 20 to 49: 196
- 50 or more: 10
- Mobile homes: 11
Housing units lacking complete kitchen facilities in 2022: 3.6%
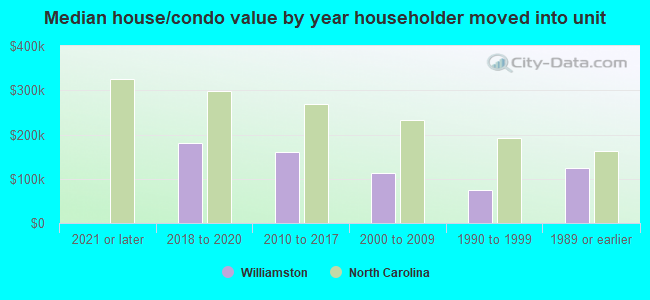
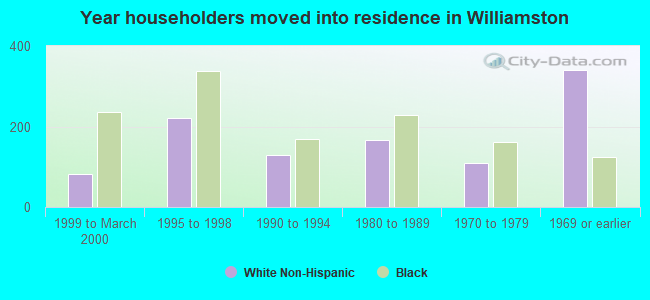
House/condo owner moved in on average 19 years ago
Renter moved in on average 5 years ago
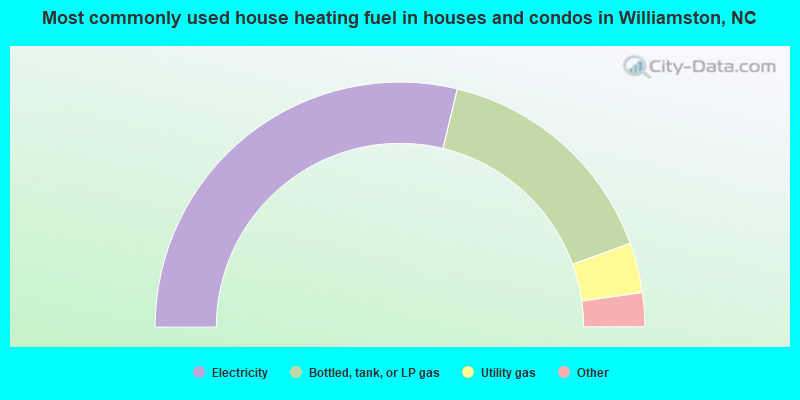
- 57.6%Electricity
- 31.4%Bottled, tank, or LP gas
- 6.6%Utility gas
- 3.5%Fuel oil, kerosene, etc.
- 0.9%Wood

- 80.0%Electricity
- 13.7%No fuel used
- 3.3%Bottled, tank, or LP gas
- 2.1%Utility gas
- 0.9%Fuel oil, kerosene, etc.
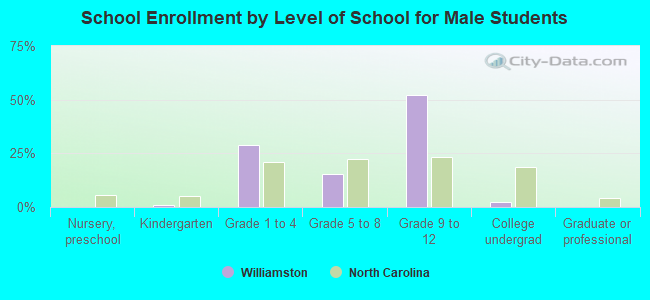
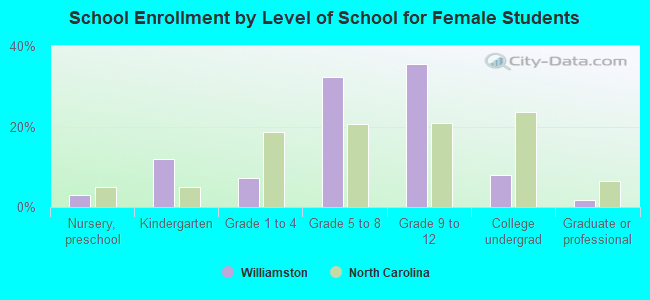
Private vs. public school enrollment:
| Here: | 2.1% |
| North Carolina: | 13.8% |
| Here: | 6.7% |
| North Carolina: | 11.9% |
| Here: | 0.0% |
| North Carolina: | 19.3% |