Woodville, CA (California) Houses and Residents
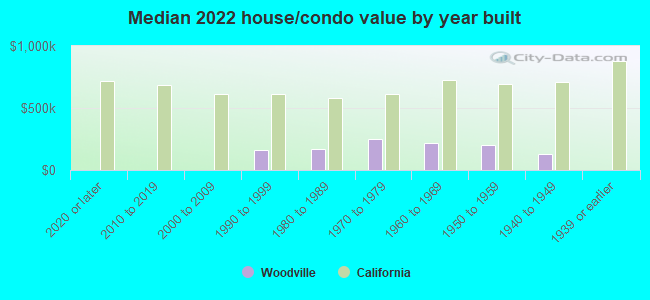
| Woodville: | $188,033 |
| California: | $715,900 |
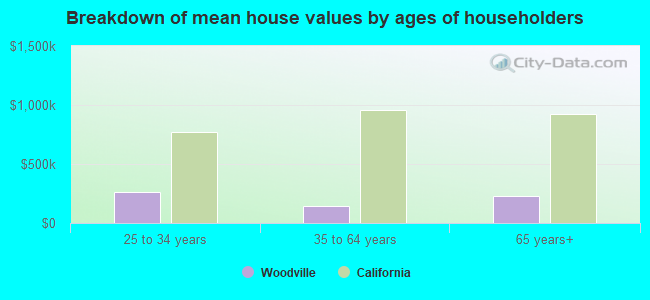
Mean price in 2022:
Detached houses: $176,549
Here: $176,549 State: $988,808 Mobile homes: $131,689
Here: $131,689 State: $184,506
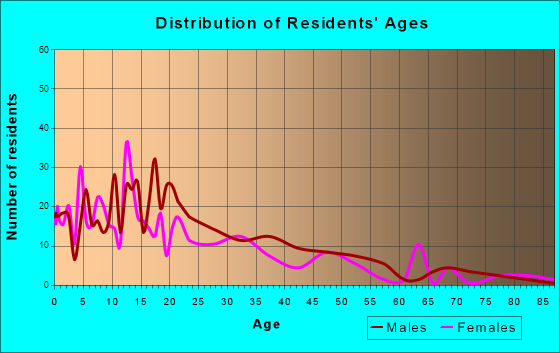
Total population: 1,740 (Urban population: 0, Rural population: 1,638 (60 farm, 1,578 nonfarm))
Houses: 457 (446 occupied: 260 owner occupied, 185 renter occupied)
| % of renters here: | 42% |
| State: | 44% |
Housing density: 105 houses/condos per square mile
Median price asked for vacant for-sale houses and condos in 2022 in this county: $413,164.
Median contract rent in 2022: $782 (lower quartile is $515, upper quartile is $911)
Median rent asked for vacant for-rent units in 2022: $706
Median gross rent in Woodville, CA in 2022: $1,043
Housing units in Woodville with a mortgage: 145 (0 second mortgage, 0 home equity loan, 0 both second mortgage and home equity loan)
Houses without a mortgage: 0
Median household income for houses/condos with a mortgage: $39,016
Median household income for apartments without a mortgage: $31,172
Median monthly housing costs: $942
Compare current foreclosures near Woodville, CA:
| Photo | Address | Area | Beds / Baths | Price | Details |
|---|---|---|---|---|---|

|
#1
S Kessing St
Porterville, CA 93257
|
1,436 sq. feet
|
1 baths 4 beds |
show details | |

|
#2
E Yew St
Farmersville, CA 93223
|
1,316 sq. feet
|
1 baths 3 beds |
show details | |

|
#3
E Lindmore St
Lindsay, CA 93247
|
4,083 sq. feet
|
2 baths 3 beds |
show details | |

|
#4
Lenox Ave
Exeter, CA 93221
|
1,502 sq. feet
|
2 baths 3 beds |
show details | |

|
#5
N Elmwood Ave
Lindsay, CA 93247
|
1,255 sq. feet
|
1 baths 3 beds |
show details | |

|
#6
N Mariposa Rd
Earlimart, CA 93219
|
1,232 sq. feet
|
2 baths 4 beds |
show details | |

|
#7
S Verde Vista St
Visalia, CA 93277
|
1,580 sq. feet
|
2 baths 3 beds |
show details | |

|
#8
Santa Maria Ave
Porterville, CA 93257
|
1,932 sq. feet
|
2 baths 4 beds |
show details | |

|
#9
W Whitendale Ave
Visalia, CA 93277
|
1,885 sq. feet
|
2 baths 3 beds |
show details | |

|
#10
S C St
Exeter, CA 93221
|
868 sq. feet
|
1 baths 2 beds |
show details |
| Photo | Address | Area | Beds / Baths | Price | Details |
|---|---|---|---|---|---|

|
#11
W Oakland Ave
Tulare, CA 93274
|
1,066 sq. feet
|
1 baths 3 beds |
show details | |

|
#12
Whittier Ct
Exeter, CA 93221
|
1,240 sq. feet
|
2 baths 3 beds |
show details | |

|
#13
Capistrano Ave
Tulare, CA 93274
|
1,825 sq. feet
|
2 baths 5 beds |
show details | |

|
#14
Delaware Ct
Tulare, CA 93274
|
1,242 sq. feet
|
2 baths 3 beds |
show details | |

|
#15
W Thurman Ave
Porterville, CA 93257
|
3,157 sq. feet
|
3 baths 3 beds |
show details | |

|
#16
Willow St
Exeter, CA 93221
|
1,101 sq. feet
|
2 baths 3 beds |
show details | |

|
#17
W Thurman Ave
Porterville, CA 93257
|
2,195 sq. feet
|
2 baths 3 beds |
show details | |

|
#18
E Monte Verde Ave
Visalia, CA 93292
|
1,815 sq. feet
|
2 baths 3 beds |
show details | |

|
#19
E Costner St
Farmersville, CA 93223
|
1,370 sq. feet
|
2 baths 3 beds |
show details | |

|
#20
W Willow St
Exeter, CA 93221
|
680 sq. feet
|
1 baths 2 beds |
show details |
| Photo | Address | Area | Beds / Baths | Price | Details |
|---|---|---|---|---|---|

|
#21
N Virginia Ave
Farmersville, CA 93223
|
1,070 sq. feet
|
2 baths 3 beds |
show details | |

|
#22
N Kemp Ave
Farmersville, CA 93223
|
1,257 sq. feet
|
2 baths 4 beds |
show details | |

|
#23
W Ashland Ave
Visalia, CA 93277
|
2,474 sq. feet
|
2 baths 4 beds |
show details | |

|
#24
S Kern Ave
Farmersville, CA 93223
|
810 sq. feet
|
1 baths 2 beds |
show details | |

|
#25
W Maple St
Exeter, CA 93221
|
1,000 sq. feet
|
2 baths 3 beds |
show details | |

|
#26
Road 248
Terra Bella, CA 93270
|
1,014 sq. feet
|
1 baths 2 beds |
show details | |

|
#27
Hannah Ave
Exeter, CA 93221
|
1,158 sq. feet
|
2 baths 3 beds |
show details | |

|
#28
W Firebaugh Ave
Exeter, CA 93221
|
1,375 sq. feet
|
2 baths 3 beds |
show details | |

|
#29
Warren St
Tulare, CA 93274
|
1,297 sq. feet
|
2 baths 3 beds |
show details | |

|
#30
Anderson Ave
Tulare, CA 93274
|
1,881 sq. feet
|
2 baths 5 beds |
show details |
| Photo | Address | Area | Beds / Baths | Price | Details |
|---|---|---|---|---|---|

|
#31
Serr Ct
Tulare, CA 93274
|
2,944 sq. feet
|
4 baths 3 beds |
show details | |

|
#32
N M St
Tulare, CA 93274
|
2,738 sq. feet
|
2 baths 3 beds |
show details | |

|
#33
State St
Porterville, CA 93257
|
1,506 sq. feet
|
2 baths 3 beds |
show details | |

|
#34
Chardonnay Ct
Tulare, CA 93274
|
2,018 sq. feet
|
2 baths 4 beds |
show details | |

|
#35
N G St
Tulare, CA 93274
|
840 sq. feet
|
1 baths - beds |
show details | |

|
#36
Hannah Ave
Exeter, CA 93221
|
1,410 sq. feet
|
2 baths 3 beds |
show details | |

|
#37
E Victor Ave
Visalia, CA 93292
|
2,652 sq. feet
|
2 baths 4 beds |
show details | |

|
#38
N Farmersville Blvd
Farmersville, CA 93223
|
1,504 sq. feet
|
2 baths 3 beds |
show details | |

|
#39
E Iris Ave
Visalia, CA 93292
|
1,706 sq. feet
|
2 baths 3 beds |
show details | |

|
#40
W Cornell Ave
Visalia, CA 93277
|
1,380 sq. feet
|
2 baths 3 beds |
show details |
| Photo | Address | Area | Beds / Baths | Price | Details |
|---|---|---|---|---|---|

|
#41
S Fontana St
Visalia, CA 93277
|
1,272 sq. feet
|
2 baths 3 beds |
show details | |

|
#42
W Sunnyside Ct
Visalia, CA 93277
|
1,266 sq. feet
|
2 baths 3 beds |
show details | |

|
#43
W Monte Vista Ave
Visalia, CA 93277
|
1,976 sq. feet
|
2 baths 4 beds |
show details | |

|
#44
E Oak Ct
Visalia, CA 93292
|
1,300 sq. feet
|
2 baths 3 beds |
show details | |

|
#45
N Sumter St
Visalia, CA 93292
|
1,990 sq. feet
|
2 baths 4 beds |
show details | |

|
#46
W Cambridge Ave
Visalia, CA 93277
|
1,332 sq. feet
|
2 baths 3 beds |
show details | |

|
#47
E Willow Ave
Visalia, CA 93292
|
1,880 sq. feet
|
2 baths 3 beds |
show details | |

|
#48
W Howard Ave
Visalia, CA 93277
|
1,535 sq. feet
|
2 baths 3 beds |
show details | |

|
#49
S Liberty St
Visalia, CA 93292
|
810 sq. feet
|
1 baths 2 beds |
show details | |

|
Check over 1 million property listings on Foreclosure.com!
|
browse all offers | |||

Latest news about housing in Woodville, CA collected exclusively by city-data.com from local newspapers, TV, and radio stations

 | Nonwhite youth population growing in California and nation, report finds (30 replies) |
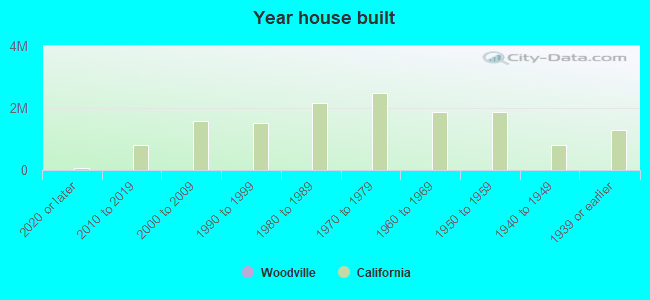
Median year apartment built: 1969
Household type by relationship:
Households: 1,845- Male householders: 266 (13 living alone), Female householders: 175 (23 living alone)
254 spouses (254 opposite-sex spouses), 61 unmarried partners, (61 opposite-sex unmarried partners), 771 children (756 natural, 0 adopted, 15 stepchildren), 140 grandchildren, 5 brothers or sisters, 60 parents, 0 foster children, 84 other relatives, 26 non-relatives
Size of family households: 56 2-persons, 62 3-persons, 110 4-persons, 66 5-persons, 49 6-persons, 32 7-or-more-persons.
Size of nonfamily households: 38 1-person, 16 2-persons, 17 3-persons.
315 married couples with children.
105 single-parent households (58 men, 47 women).
18.5% of residents of Woodville speak English at home.
72.4% of residents speak Spanish at home (34% speak English very well, 26% speak English well, 19% speak English not well, 21% don't speak English at all).
3.0% of residents speak other language at home (30% speak English well, 70% don't speak English at all).
Foreign born population: 781 (42.3%)
(33.9% of them are naturalized citizens)
| Here: | 5.0 |
| State: | 6.0 |
| Here: | 5.0 |
| State: | 3.9 |
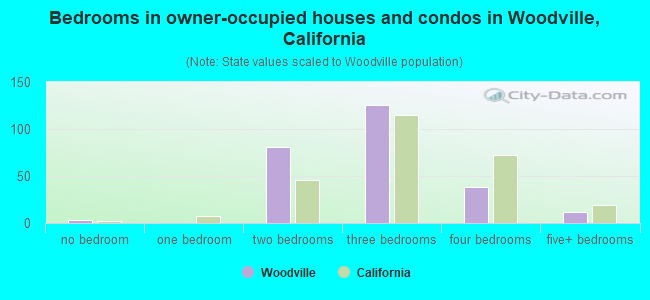
- Bedrooms in owner-occupied houses and condos in Woodville, California
- 3no bedroom
- 01 bedroom
- 812 bedrooms
- 1263 bedrooms
- 384 bedrooms
- 125+ bedrooms
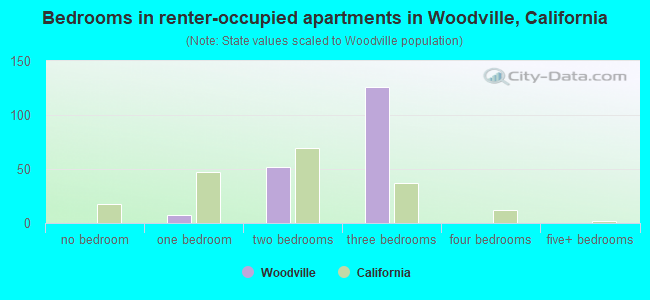
- Bedrooms in renter-occupied apartments in Woodville, California
- 0no bedroom
- 71 bedroom
- 522 bedrooms
- 1263 bedrooms
- 04 bedrooms
- 05+ bedrooms
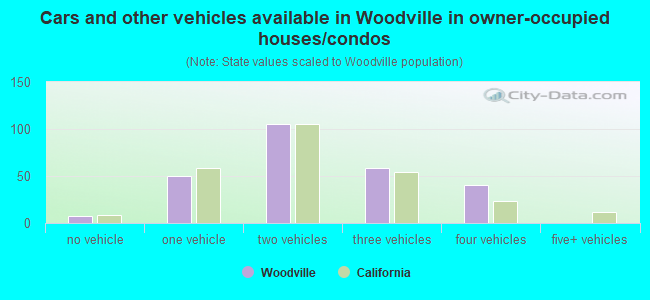
- Cars and other vehicles available in Woodville in owner-occupied houses/condos
- 7no vehicle
- 501 vehicle
- 1052 vehicles
- 593 vehicles
- 404 vehicles
- 05+ vehicles
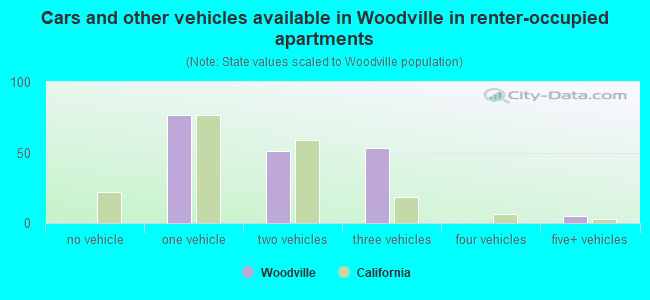
- Cars and other vehicles available in Woodville in renter-occupied apartments
- 0no vehicle
- 761 vehicle
- 512 vehicles
- 533 vehicles
- 04 vehicles
- 55+ vehicles
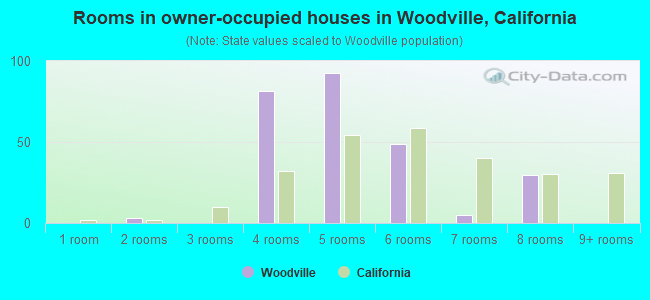
- Rooms in owner-occupied houses in Woodville, California
- 01 room
- 32 rooms
- 03 rooms
- 814 rooms
- 935 rooms
- 496 rooms
- 57 rooms
- 308 rooms
- 09+ rooms
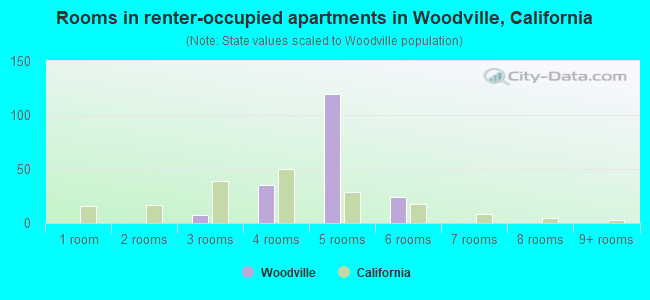
- Rooms in renter-occupied apartments in Woodville, California
- 01 room
- 02 rooms
- 73 rooms
- 354 rooms
- 1195 rooms
- 246 rooms
- 07 rooms
- 08 rooms
- 09+ rooms
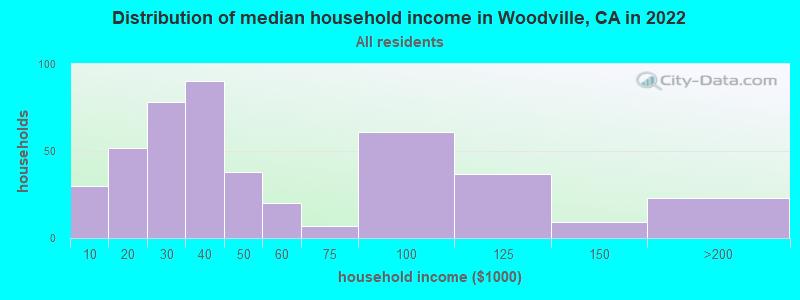
Woodville, CA household income distribution

- 30Less than $10,000
- 52$10,000 to $19,999
- 78$20,000 to $29,999
- 90$30,000 to $39,999
- 38$40,000 to $49,999
- 20$50,000 to $59,999
- 7$60,000 to $74,999
- 61$75,000 to $99,999
- 37$100,000 to $124,999
- 9$125,000 to $149,999
- 23$150,000 to $199,999
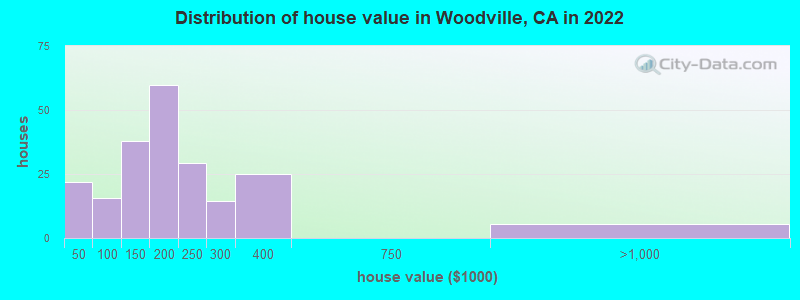
Home value of owner - occupied houses in 2022 in Woodville, CA
-
- 4Less than $10,000
- 5$10,000 to $14,999
- 5$15,000 to $19,999
- 5$25,000 to $29,999
- 0$40,000 to $49,999
- 7$60,000 to $69,999
- 7$80,000 to $89,999
- 7$100,000 to $124,999
- 29$125,000 to $149,999
- 38$150,000 to $174,999
- 21$175,000 to $199,999
- 29$200,000 to $249,999
- 14$250,000 to $299,999
- 24$300,000 to $399,999
- 5$750,000 to $999,999
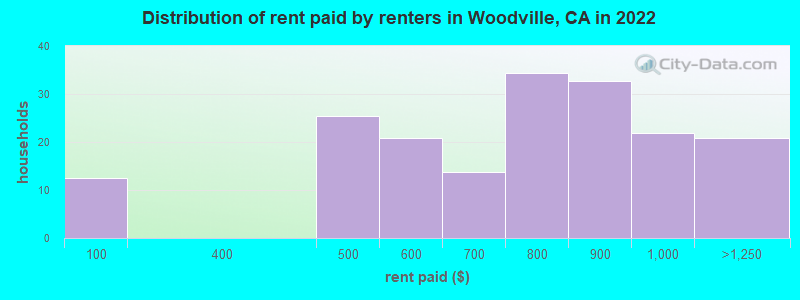
Rent paid by renters in 2022 in Woodville, CA
-
- 12Less than $100
- 25$450 to $499
- 20$500 to $549
- 13$600 to $649
- 17$700 to $749
- 16$750 to $799
- 32$800 to $899
- 21$900 to $999
- 20$1,000 to $1,249
Percentage of workers working in this county: 88.4%
Number of people working at home: 11 (1.6% of all workers)
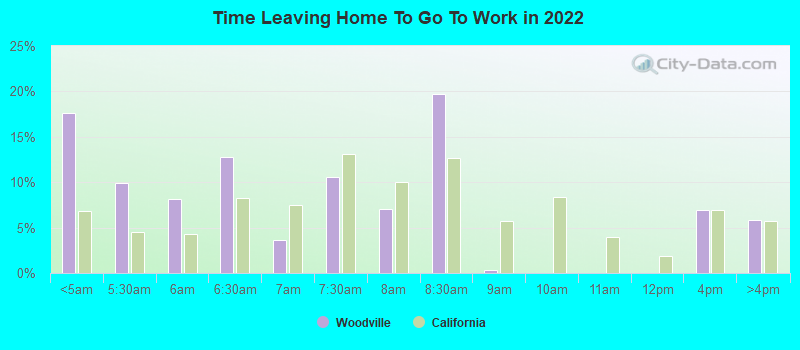
Travel time to work (commute)
- Less than 5 minutes: 12
- 5 to 9 minutes: 28
- 10 to 14 minutes: 49
- 15 to 19 minutes: 118
- 20 to 24 minutes: 131
- 25 to 29 minutes: 96
- 30 to 34 minutes: 70
- 35 to 39 minutes: 6
- 40 to 44 minutes: 14
- 45 to 59 minutes: 74
- 60 to 89 minutes: 103
- 90 or more minutes: 17
Means of transportation to work:
- Drove a car alone: 319 (57.9%)
- Carpooled: 188 (34.1%)
- Bicycle: 3 (0.5%)
- Walked: 10 (1.8%)
- Other means: 10 (1.8%)
- Worked at home: 21 (3.8%)
- Unemployment by race in 2022
- Unemployment rate for Black residents
- 100.0%Females
- Unemployment rate for other race residents
- 14.3%Males
- 18.8%Females
- Unemployment rate for two or more race residents
- 2.6%Males
- 8.5%Females
- Unemployment rate for Hispanic or Latino residents
- 6.9%Males
- 9.5%Females
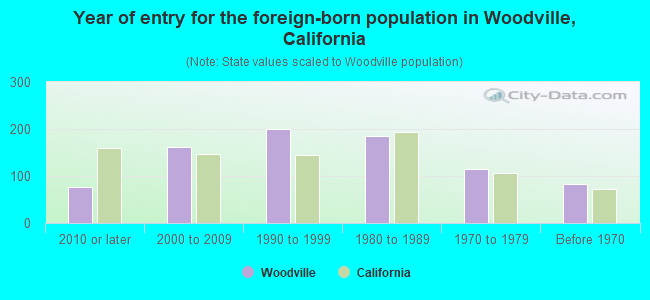
- Year of entry for the foreign-born population in Woodville, California
- 762010 or later
- 1622000 to 2009
- 2011990 to 1999
- 1851980 to 1989
- 1151970 to 1979
- 84Before 1970
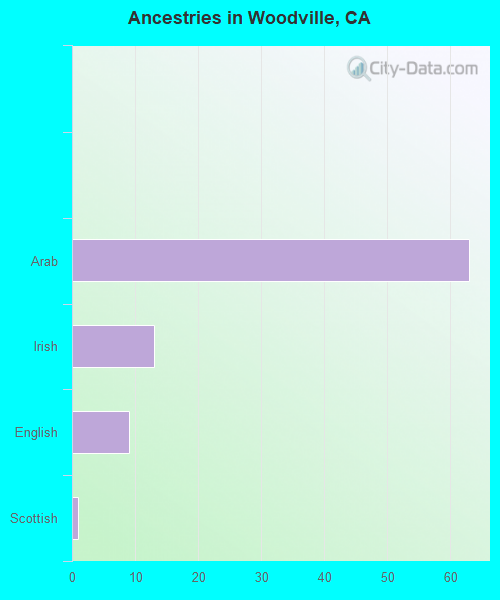
First ancestries reported:
- Arab: 63 (4.2%)
- Irish: 13 (0.9%)
- English: 9 (0.6%)
- Scottish: 1 (0.07%)
Most common places of birth for foreign-born residents (%):
| Woodville: | 87.6% (649) |
| California: | 37.2% (3,881,193) |
| Woodville: | 4.9% (36) |
| California: | 0.6% (66,590) |
| Woodville: | 3.2% (24) |
| California: | 0.1% (11,122) |
Place of birth for U.S.-born residents:
- This state: 1,061
- Other state: 12
- Northeast: 0
- Midwest: 2
- South: 4
- West: 6
92.4% of Woodville residents lived in the same house 1 years ago.
Out of people who lived in different houses, 49.6% lived in this county.
| Woodville: | 92.4% |
| State average: | 88.9% |
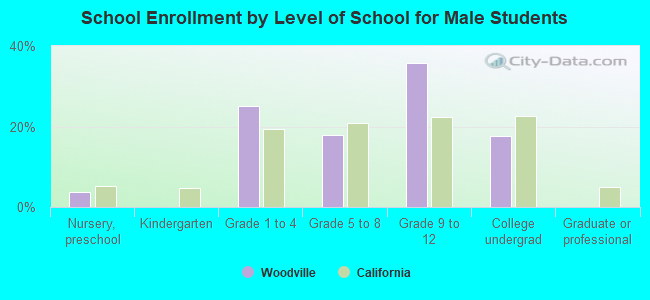
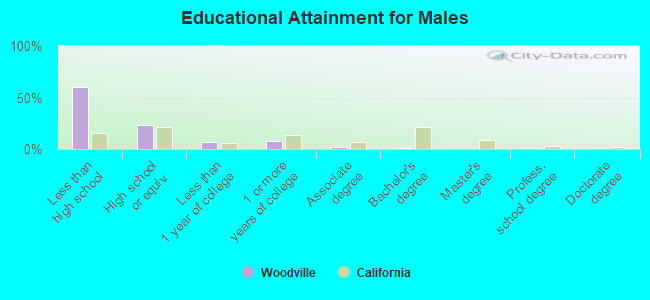
Education attainment for males 25 years and older:
- No schooling: 47
- Nursery to 4th grade: 54
- 5th and 6th grade: 134
- 7th and 8th grade: 26
- 9th grade: 14
- 10th grade: 15
- 11th grade: 0
- 12th grade, no diploma: 26
- High school graduate (or equivalency): 122
- Less than 1 year of college: 35
- Some college more than 1 year, no degree: 39
- Associate degree: 11
- Bachelor's degree: 6
- Master's degree: 0
- Professional school degree: 0
- Doctorate degree: 0
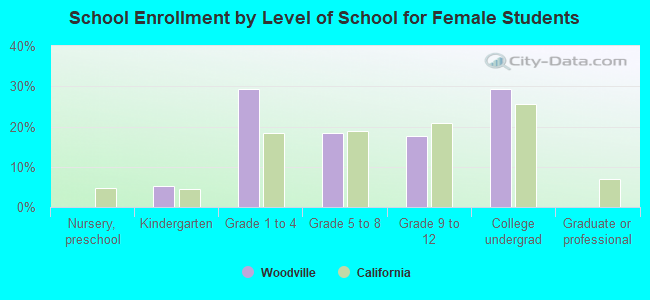
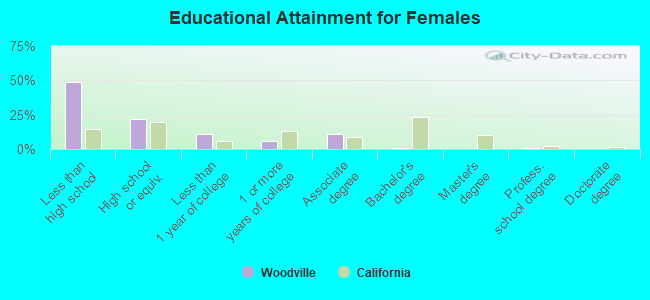
Education attainment for females 25 years and older:
- No schooling: 41
- Nursery to 4th grade: 51
- 5th and 6th grade: 56
- 7th and 8th grade: 10
- 9th grade: 16
- 10th grade: 0
- 11th grade: 16
- 12th grade, no diploma: 20
- High school graduate (or equivalency): 92
- Less than 1 year of college: 47
- Some college more than 1 year, no degree: 26
- Associate degree: 48
- Bachelor's degree: 2
- Master's degree: 0
- Professional school degree: 3
- Doctorate degree: 0
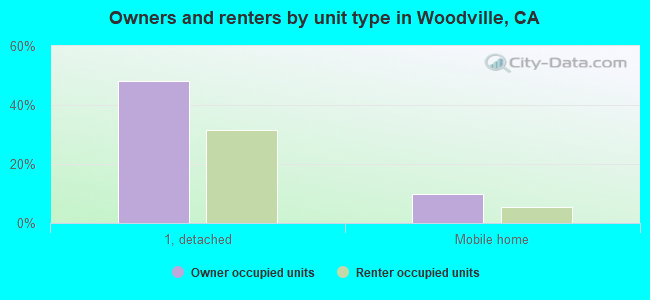
Housing units in structures:
- One, detached: 376
- One, attached: 12
- Two: 11
- Mobile homes: 58
Median worth of mobile homes: $201,784
Housing units lacking complete kitchen facilities in 2022: 5.6%
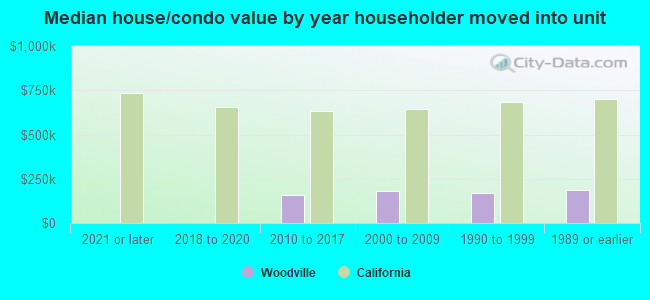
House/condo owner moved in on average 14 years ago
Renter moved in on average 10 years ago
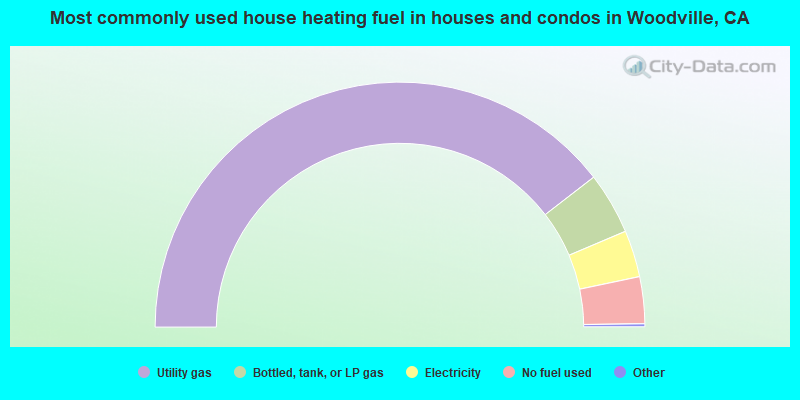
- 79.3%Utility gas
- 8.2%Bottled, tank, or LP gas
- 6.2%Electricity
- 6.2%No fuel used
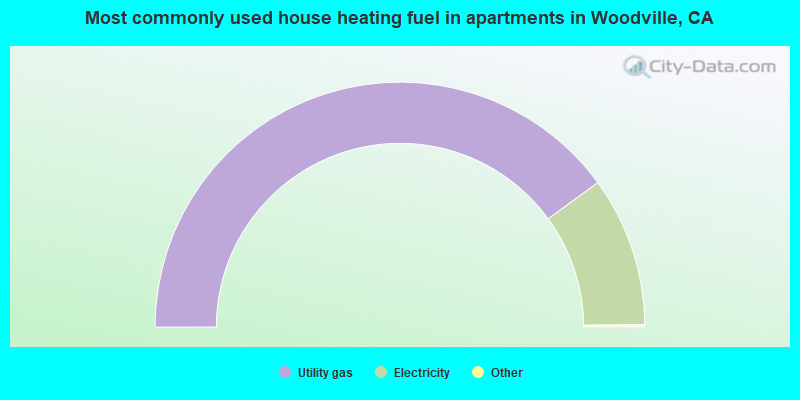
- 80.2%Utility gas
- 19.8%Electricity
Private vs. public school enrollment:
| Here: | 6.7% |
| California: | 10.5% |
| Here: | 7.3% |
| California: | 8.5% |
| Here: | 20.5% |
| California: | 15.9% |