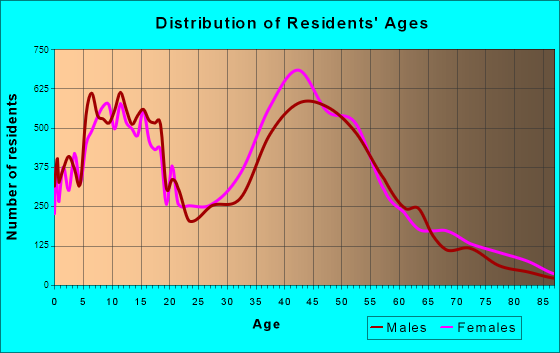
Yorba Linda, CA (California) Houses and Residents
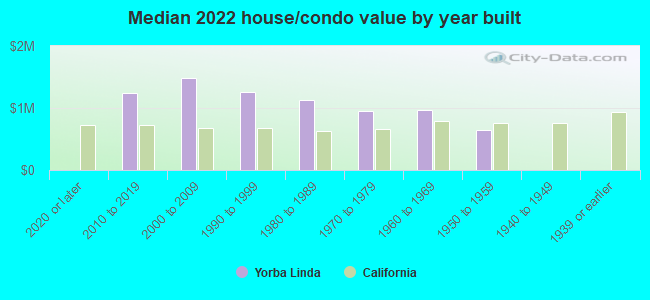
| Yorba Linda: | $1,139,500 |
| California: | $715,900 |
Mean price in 2022:
Detached houses: $1,393,861
Here: $1,393,861 State: $988,808 Townhouses or other attached units: $852,135
Here: $852,135 State: $838,546 In 2-unit structures: $1,245,763
Here: $1,245,763 State: $1,138,100 In 3-to-4-unit structures: $607,055
Here: $607,055 State: $824,253 In 5-or-more-unit structures: $638,083
Here: $638,083 State: $730,996 Mobile homes: $610,618
Here: $610,618 State: $184,506
Total population: 67,826 (Urban population: 58,075, Rural population: 520 (all nonfarm))
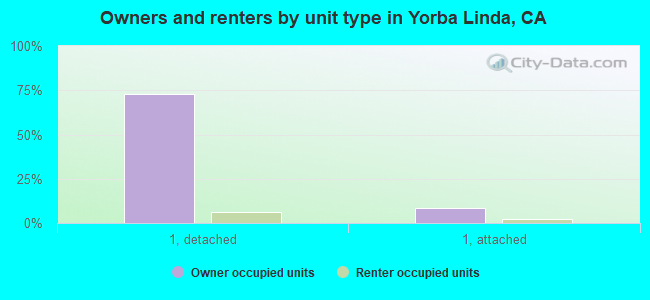
Houses: 25,136 (23,691 occupied: 20,159 owner occupied, 3,532 renter occupied)
| % of renters here: | 15% |
| State: | 44% |
Housing density: 1,298 houses/condos per square mile
Median price asked for vacant for-sale houses and condos in 2022: $1,188,947.
Median contract rent in 2022: over $2,000 (lower quartile is $1,399, upper quartile is over $2,000)
Median rent asked for vacant for-rent units in 2022: $2,825
Median gross rent in Yorba Linda, CA in 2022: over $2,000
Housing units in Yorba Linda with a mortgage: 14,228 (1,720 second mortgage, 0 home equity loan, 1,667 both second mortgage and home equity loan)
Houses without a mortgage: 314
Median household income for houses/condos with a mortgage: $175,239
Median household income for apartments without a mortgage: $124,726
Median monthly housing costs: $2,846
Compare current foreclosures near Yorba Linda, CA:
| Photo | Address | Area | Beds / Baths | Price | Details |
|---|---|---|---|---|---|

|
#1
Olana Plz
Yorba Linda, CA 92886
|
1,375 sq. feet
|
3 baths 3 beds |
show details | |

|
#2
Calle Sonora
Yorba Linda, CA 92887
|
1,960 sq. feet
|
2 baths 3 beds |
show details | |

|
#3
Via Mariano
Yorba Linda, CA 92887
|
1,562 sq. feet
|
2 baths 3 beds |
show details | |

|
#4
Orange Dr
Yorba Linda, CA 92886
|
1,550 sq. feet
|
2 baths 4 beds |
show details | |

|
#5
Via Maria
Yorba Linda, CA 92886
|
1,864 sq. feet
|
3 baths 3 beds |
show details | |

|
#6
Chateau Ave
Yorba Linda, CA 92886
|
1,586 sq. feet
|
2 baths 3 beds |
show details | |

|
#7
Orange Dr
Yorba Linda, CA 92886
|
1,695 sq. feet
|
2 baths 4 beds |
show details | |

|
#8
Avocado Ave
Yorba Linda, CA 92886
|
1,590 sq. feet
|
2 baths 4 beds |
show details | |

|
#9
Mimosa Dr
Yorba Linda, CA 92886
|
1,308 sq. feet
|
1 baths 3 beds |
show details | |

|
#10
Via Espana
Yorba Linda, CA 92886
|
1,950 sq. feet
|
- baths 3 beds |
show details |
| Photo | Address | Area | Beds / Baths | Price | Details |
|---|---|---|---|---|---|

|
#11
Via Fonte
Yorba Linda, CA 92886
|
2,403 sq. feet
|
- baths 3 beds |
show details | |

|
#12
Cambridge Rd
Yorba Linda, CA 92887
|
- sq. feet
|
2 baths 2 beds |
show details | |

|
#13
Portsmouth Rd
Yorba Linda, CA 92887
|
- sq. feet
|
2 baths 2 beds |
show details | |

|
#14
Herbshey Cir
Yorba Linda, CA 92887
|
- sq. feet
|
- baths - beds |
show details | |

|
#15
Calle Mirador
Yorba Linda, CA 92886
|
- sq. feet
|
- baths - beds |
show details | |

|
#16
Babbling Brook Way # 32f
Yorba Linda, CA 92887
|
- sq. feet
|
- baths - beds |
show details | |

|
#17
Oakcrest Cir # 1206
Yorba Linda, CA 92887
|
- sq. feet
|
- baths - beds |
show details | |

|
#18
Lake Knoll Ln
Yorba Linda, CA 92886
|
- sq. feet
|
- baths - beds |
show details | |

|
#19
Amberwood Ln
Yorba Linda, CA 92886
|
- sq. feet
|
- baths - beds |
show details | |

|
#20
Alamo Ln
Yorba Linda, CA 92886
|
- sq. feet
|
- baths - beds |
show details |
| Photo | Address | Area | Beds / Baths | Price | Details |
|---|---|---|---|---|---|

|
#21
River Bend Dr Apt A
Yorba Linda, CA 92887
|
- sq. feet
|
- baths - beds |
show details | |

|
#22
Hidden Hills Rd
Yorba Linda, CA 92887
|
- sq. feet
|
- baths - beds |
show details | |

|
#23
Hidden Oaks Dr
Yorba Linda, CA 92886
|
- sq. feet
|
- baths 5 beds |
show details | |

|
#24
Millbury Ave
Baldwin Park, CA 91706
|
1,632 sq. feet
|
2 baths 4 beds |
$869,000
|
show details |

|
#25
Hawkstone Ave
Whittier, CA 90605
|
1,444 sq. feet
|
2 baths 4 beds |
$674,900
|
show details |

|
#26
E Norma Ave
West Covina, CA 91791
|
1,134 sq. feet
|
2 baths 3 beds |
$599,000
|
show details |

|
#27
E G St
Ontario, CA 91764
|
1,036 sq. feet
|
1 baths 3 beds |
$577,200
|
show details |

|
#28
Maple Leaf Ln
Yorba Linda, CA 92886
|
- sq. feet
|
- baths - beds |
show details | |

|
#29
E Holton St
West Covina, CA 91791
|
- sq. feet
|
2 baths 3 beds |
$450,000
|
show details |

|
#30
View Ln
Corona, CA 92881
|
2,420 sq. feet
|
3 baths 3 beds |
$30,425
|
show details |
| Photo | Address | Area | Beds / Baths | Price | Details |
|---|---|---|---|---|---|

|
#31
Apple Court
Upland, CA 91786
|
1,655 sq. feet
|
2 baths 2 beds |
show details | |

|
#32
E Jackson Ave Unit C
Anaheim, CA 92806
|
1,266 sq. feet
|
2 baths 3 beds |
show details | |

|
#33
Celebration St
Chino, CA 91708
|
1,644 sq. feet
|
2 baths 3 beds |
show details | |

|
#34
Norwalk Blvd Apt
Hawaiian Gardens, CA 90716
|
800 sq. feet
|
2 baths 1 beds |
show details | |

|
#35
Prairie Run Rd
Mira Loma, CA 91752
|
1,985 sq. feet
|
3 baths 3 beds |
show details | |

|
#36
Calendula Ave
Fountain Valley, CA 92708
|
1,615 sq. feet
|
2 baths 4 beds |
show details | |

|
#37
Mount Elena Cir
Corona, CA 92882
|
2,715 sq. feet
|
2 baths 5 beds |
show details | |

|
#38
Topaz Ave
La Habra, CA 90631
|
2,481 sq. feet
|
3 baths 5 beds |
show details | |

|
#39
Sunny Brook Ln
Chino Hills, CA 91709
|
1,833 sq. feet
|
2 baths 4 beds |
show details | |

|
#40
Claretta Ave
Lakewood, CA 90715
|
1,074 sq. feet
|
1 baths 3 beds |
show details |
| Photo | Address | Area | Beds / Baths | Price | Details |
|---|---|---|---|---|---|

|
#41
S Dancove Dr
West Covina, CA 91791
|
1,956 sq. feet
|
3 baths 3 beds |
show details | |

|
#42
Main St.
West Covina, CA 91790
|
- sq. feet
|
- baths - beds |
$575,000
|
show details |

|
#43
Basetdale Ave
La Puente, CA 91746
|
1,328 sq. feet
|
2 baths 4 beds |
show details | |

|
#44
Pamela Ln
La Habra, CA 90631
|
2,848 sq. feet
|
3 baths 5 beds |
show details | |

|
#45
Greenmoor
Irvine, CA 92614
|
1,171 sq. feet
|
2 baths 2 beds |
show details | |

|
#46
W Calora St
San Dimas, CA 91773
|
1,178 sq. feet
|
2 baths 3 beds |
show details | |

|
#47
Wedgewood
Irvine, CA 92620
|
2,804 sq. feet
|
3 baths 5 beds |
show details | |

|
#48
Van Wig Ave
Baldwin Park, CA 91706
|
1,330 sq. feet
|
2 baths 3 beds |
show details | |

|
#49
E Pinehurst Ave
La Habra, CA 90631
|
1,125 sq. feet
|
1 baths 3 beds |
show details | |

|
Check over 1 million property listings on Foreclosure.com!
|
browse all offers | |||


Median year apartment built: 1990
Household type by relationship:
Households: 67,077- Male householders: 12,409 (1,588 living alone), Female householders: 11,282 (2,147 living alone)
17,142 spouses (16,907 opposite-sex spouses), 374 unmarried partners, (374 opposite-sex unmarried partners), 20,090 children (19,232 natural, 364 adopted, 494 stepchildren), 889 grandchildren, 304 brothers or sisters, 2,440 parents, 0 foster children, 912 other relatives, 716 non-relatives
- In group quarters: 519
Size of family households: 7,689 2-persons, 4,905 3-persons, 4,424 4-persons, 1,927 5-persons, 433 6-persons, 95 7-or-more-persons.
Size of nonfamily households: 3,735 1-person, 425 2-persons, 58 3-persons.
11,671 married couples with children.
1,947 single-parent households (920 men, 1,027 women).
70.1% of residents of Yorba Linda speak English at home.
6.8% of residents speak Spanish at home (68% speak English very well, 22% speak English well, 10% speak English not well, 1% don't speak English at all).
6.1% of residents speak other Indo-European language at home (75% speak English very well, 19% speak English well, 5% speak English not well, 2% don't speak English at all).
15.3% of residents speak Asian or Pacific Island language at home (59% speak English very well, 24% speak English well, 13% speak English not well, 5% don't speak English at all).
1.1% of residents speak other language at home (83% speak English very well, 9% speak English well, 4% speak English not well, 4% don't speak English at all).
Foreign born population: 19,828 (29.6%)
(70.7% of them are naturalized citizens)
| Here: | 7.0 |
| State: | 6.0 |
| Here: | 4.2 |
| State: | 3.9 |
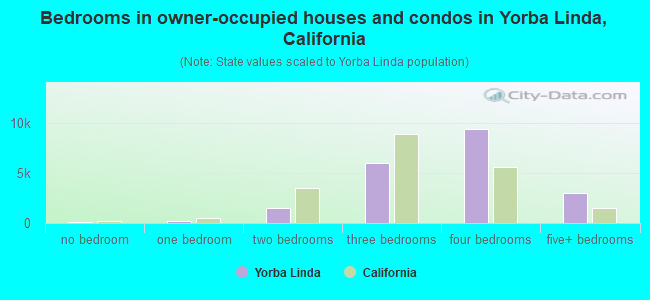
- Bedrooms in owner-occupied houses and condos in Yorba Linda, California
- 96no bedroom
- 1871 bedroom
- 1,4932 bedrooms
- 6,0263 bedrooms
- 9,3984 bedrooms
- 2,9595+ bedrooms
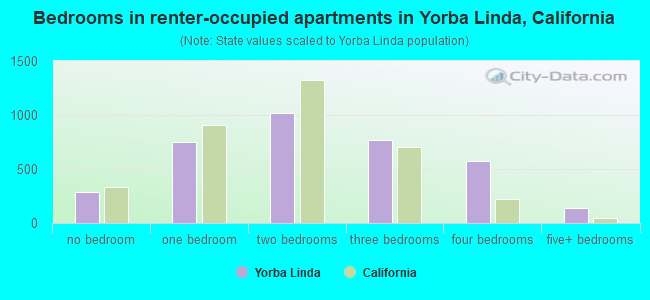
- Bedrooms in renter-occupied apartments in Yorba Linda, California
- 286no bedroom
- 7521 bedroom
- 1,0172 bedrooms
- 7683 bedrooms
- 5714 bedrooms
- 1385+ bedrooms
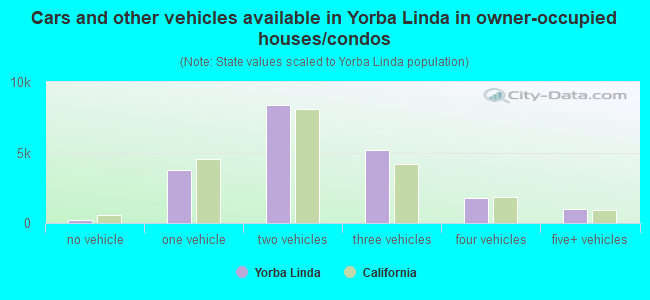
- Cars and other vehicles available in Yorba Linda in owner-occupied houses/condos
- 185no vehicle
- 3,7511 vehicle
- 8,3532 vehicles
- 5,1723 vehicles
- 1,7404 vehicles
- 9585+ vehicles
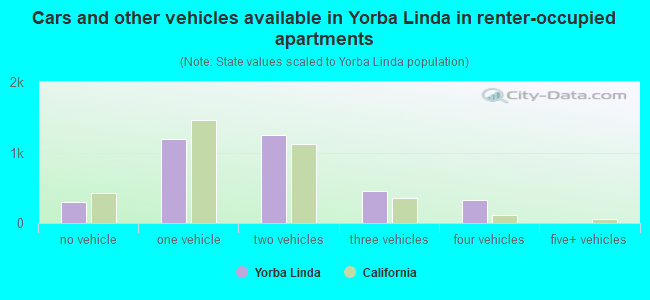
- Cars and other vehicles available in Yorba Linda in renter-occupied apartments
- 303no vehicle
- 1,1871 vehicle
- 1,2522 vehicles
- 4603 vehicles
- 3304 vehicles
- 05+ vehicles
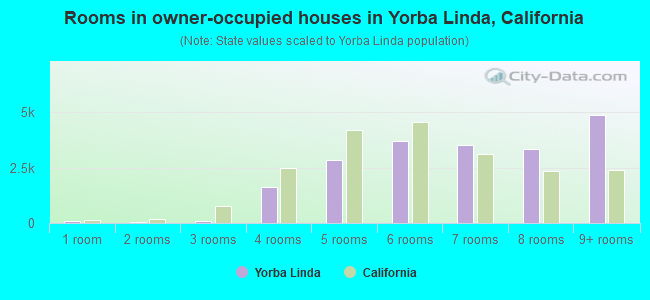
- Rooms in owner-occupied houses in Yorba Linda, California
- 961 room
- 482 rooms
- 1093 rooms
- 1,6404 rooms
- 2,8395 rooms
- 3,6786 rooms
- 3,5267 rooms
- 3,3558 rooms
- 4,8689+ rooms
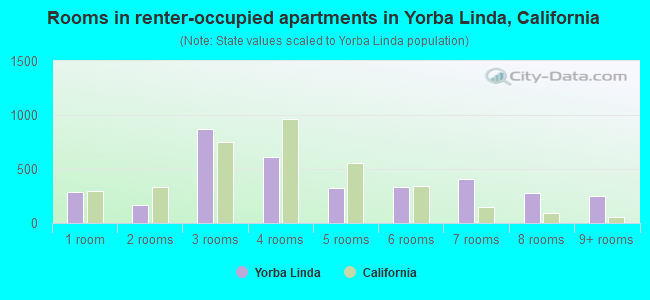
- Rooms in renter-occupied apartments in Yorba Linda, California
- 2861 room
- 1632 rooms
- 8753 rooms
- 6094 rooms
- 3265 rooms
- 3376 rooms
- 4057 rooms
- 2798 rooms
- 2529+ rooms
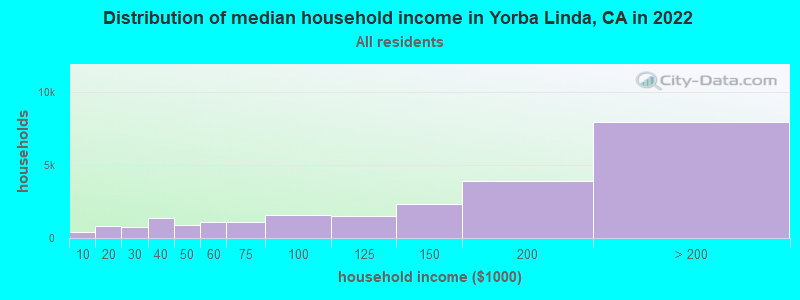
Yorba Linda, CA household income distribution

- 385Less than $10,000
- 831$10,000 to $19,999
- 741$20,000 to $29,999
- 1,360$30,000 to $39,999
- 874$40,000 to $49,999
- 1,106$50,000 to $59,999
- 1,103$60,000 to $74,999
- 1,569$75,000 to $99,999
- 1,506$100,000 to $124,999
- 2,311$125,000 to $149,999
- 3,945$150,000 to $199,999
- 7,960$200,000 or more
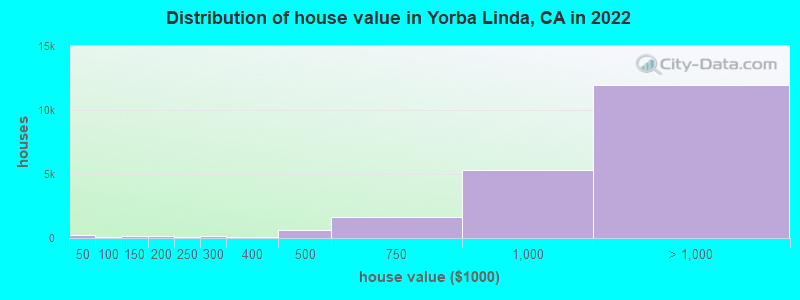
Home value of owner - occupied houses in 2022 in Yorba Linda, CA
-
- 177Less than $10,000
- 26$10,000 to $14,999
- 15$25,000 to $29,999
- 34$60,000 to $69,999
- 16$70,000 to $79,999
- 18$80,000 to $89,999
- 34$90,000 to $99,999
- 95$100,000 to $124,999
- 47$125,000 to $149,999
- 71$150,000 to $174,999
- 93$175,000 to $199,999
- 58$200,000 to $249,999
- 129$250,000 to $299,999
- 100$300,000 to $399,999
- 623$400,000 to $499,999
- 1,661$500,000 to $749,999
- 5,318$750,000 to $999,999
- 7,389$1,000,000 to $1,499,999
- 3,027$1,500,000 to $1,999,999
- 1,502$2,000,000 or more
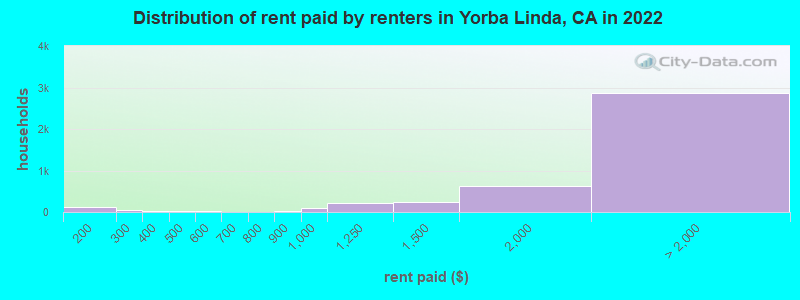
Rent paid by renters in 2022 in Yorba Linda, CA
-
- 64$100 to $149
- 64$150 to $199
- 37$200 to $249
- 5$250 to $299
- 12$350 to $399
- 14$400 to $449
- 3$450 to $499
- 14$500 to $549
- 9$600 to $649
- 16$800 to $899
- 95$900 to $999
- 225$1,000 to $1,249
- 229$1,250 to $1,499
- 620$1,500 to $1,999
- 768$2,000 to $2,499
- 482$2,500 to $2,999
- 813$3,000 to $3,499
- 647$3,500 or more
- 164No cash rent
Percentage of workers working in this county: 74.4%
Number of people working at home: 7,158 (22.4% of all workers)
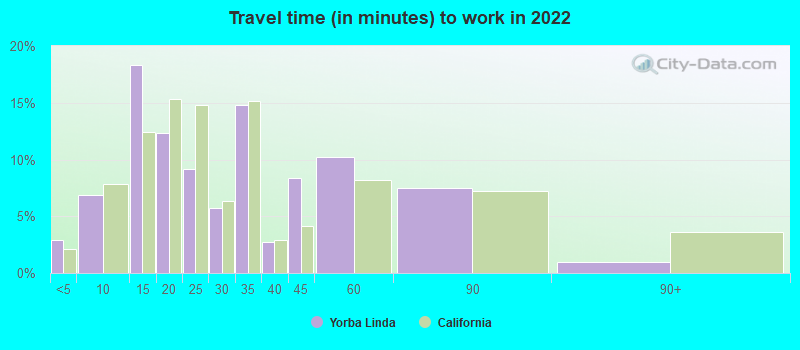
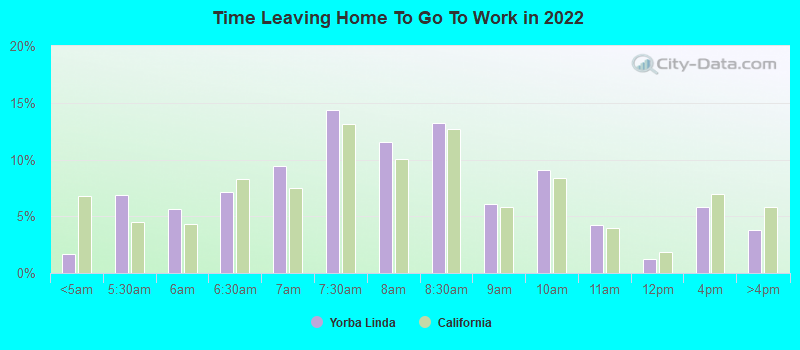
Travel time to work (commute)
- Less than 5 minutes: 261
- 5 to 9 minutes: 950
- 10 to 14 minutes: 2,377
- 15 to 19 minutes: 2,535
- 20 to 24 minutes: 2,722
- 25 to 29 minutes: 1,772
- 30 to 34 minutes: 4,191
- 35 to 39 minutes: 1,264
- 40 to 44 minutes: 2,320
- 45 to 59 minutes: 2,683
- 60 to 89 minutes: 3,236
- 90 or more minutes: 358
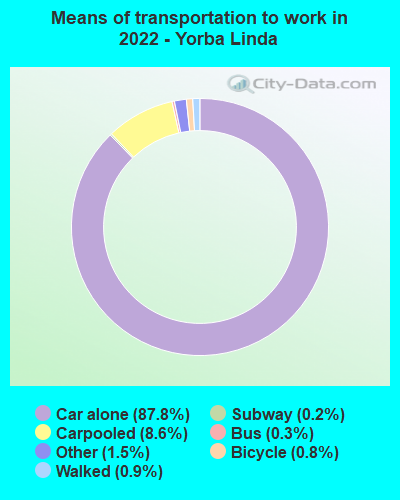
Means of transportation to work:
- Drove a car alone: 12,747 (60.5%)
- Carpooled: 1,346 (6.4%)
- Bus: 40 (0.2%)
- Long-distance train or commuter rail: 29 (0.1%)
- Taxi: 244 (1.2%)
- Bicycle: 129 (0.6%)
- Walked: 123 (0.6%)
- Worked at home: 7,158 (34.0%)
- Unemployment by race in 2022
- Unemployment rate for White non-Hispanic residents
- 4.7%Males
- 3.7%Females
- Unemployment rate for Black residents
- 17.6%Females
- Unemployment rate for Asian residents
- 1.6%Males
- 5.6%Females
- Unemployment rate for other race residents
- 3.7%Males
- 8.2%Females
- Unemployment rate for two or more race residents
- 12.0%Males
- 3.5%Females
- Unemployment rate for Hispanic or Latino residents
- 7.7%Males
- 8.4%Females
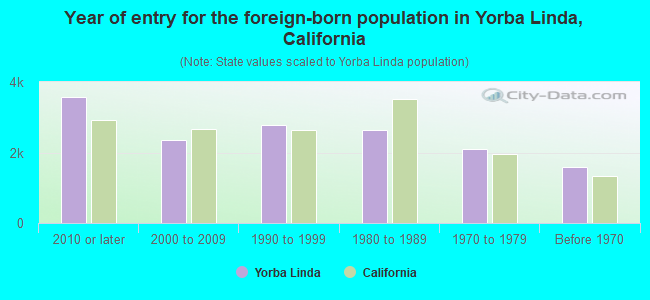
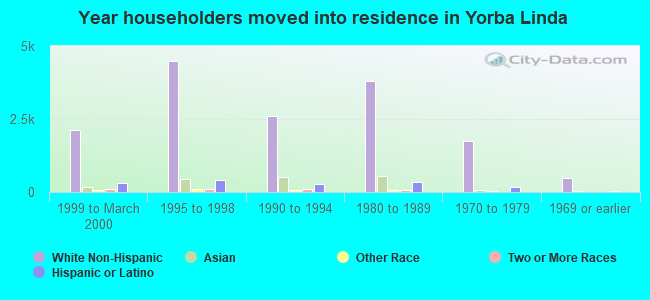
- Year of entry for the foreign-born population in Yorba Linda, California
- 3,5882010 or later
- 2,3462000 to 2009
- 2,7661990 to 1999
- 2,6451980 to 1989
- 2,1031970 to 1979
- 1,587Before 1970
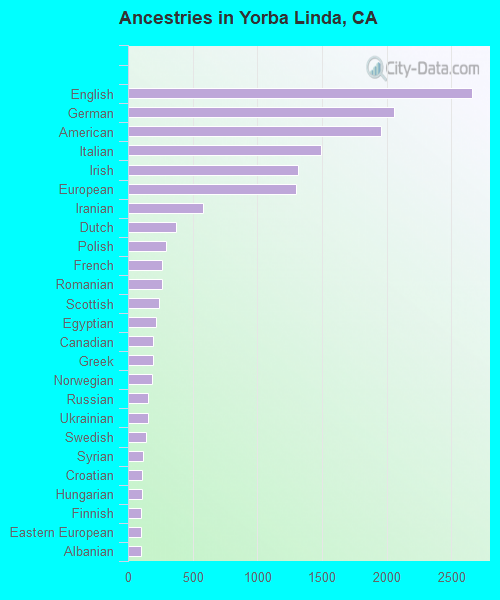
First ancestries reported:
- English: 2,659 (7.0%)
- German: 2,056 (5.4%)
- American: 1,956 (5.2%)
- Italian: 1,492 (3.9%)
- Irish: 1,314 (3.5%)
- European: 1,301 (3.4%)
- Iranian: 583 (1.5%)
- Dutch: 375 (1.0%)
- Polish: 294 (0.8%)
- French: 265 (0.7%)
- Romanian: 264 (0.7%)
- Scottish: 238 (0.6%)
- Egyptian: 219 (0.6%)
- Canadian: 196 (0.5%)
- Greek: 196 (0.5%)
- Norwegian: 187 (0.5%)
- Russian: 157 (0.4%)
- Ukrainian: 155 (0.4%)
- Swedish: 143 (0.4%)
- Syrian: 115 (0.3%)
- Croatian: 110 (0.3%)
- Hungarian: 107 (0.3%)
- Finnish: 104 (0.3%)
- Eastern European: 98 (0.3%)
- Albanian: 97 (0.3%)
- Northern European: 87 (0.2%)
- Lebanese: 84 (0.2%)
- Scotch-Irish: 70 (0.2%)
- Portuguese: 65 (0.2%)
- Danish: 63 (0.2%)
- Estonian: 62 (0.2%)
- Ethiopian: 57 (0.2%)
- Scandinavian: 56 (0.1%)
- Serbian: 56 (0.1%)
- British: 48 (0.1%)
- French Canadian: 47 (0.1%)
- Armenian: 46 (0.1%)
- Czechoslovakian: 44 (0.1%)
- Nigerian: 43 (0.1%)
- Slovak: 40 (0.1%)
- Jamaican: 31 (0.08%)
- Swiss: 30 (0.08%)
- Austrian: 28 (0.07%)
- Welsh: 28 (0.07%)
- Palestinian: 14 (0.04%)
- Czech: 11 (0.03%)
- Israeli: 10 (0.03%)
- Luxembourger: 8 (0.02%)
- Lithuanian: 7 (0.02%)
- Moroccan: 5 (0.01%)
- Belgian: 4 (0.01%)
Most common places of birth for foreign-born residents (%):
| Yorba Linda: | 17.4% (2,604) |
| California: | 6.6% (684,672) |
| Yorba Linda: | 10.4% (1,556) |
| California: | 3.0% (315,248) |
| Yorba Linda: | 9.3% (1,393) |
| California: | 5.2% (539,184) |
| Yorba Linda: | 7.4% (1,102) |
| California: | 37.2% (3,881,193) |
| Yorba Linda: | 6.5% (978) |
| California: | 1.7% (176,274) |
| Yorba Linda: | 6.2% (930) |
| California: | 4.9% (512,335) |
| Yorba Linda: | 6.0% (898) |
| California: | 7.8% (818,297) |
| Yorba Linda: | 3.3% (494) |
| California: | 2.0% (206,004) |
| Yorba Linda: | 3.3% (489) |
| California: | 1.2% (127,477) |
| Yorba Linda: | 1.8% (267) |
| California: | 1.0% (103,575) |
| Yorba Linda: | 1.7% (249) |
| California: | 1.0% (105,215) |
| Yorba Linda: | 1.6% (241) |
| California: | 0.3% (31,439) |
| Yorba Linda: | 1.6% (238) |
| California: | 0.7% (74,025) |
Place of birth for U.S.-born residents:
- This state: 34,012
- Other state: 12,276
- Northeast: 3,688
- Midwest: 4,862
- South: 2,319
- West: 1,407
89.6% of Yorba Linda residents lived in the same house 1 years ago.
Out of people who lived in different houses, 40.5% lived in this county.
Out of people who lived in different counties, 77.5% lived in California.
| Yorba Linda: | 89.6% |
| State average: | 88.9% |
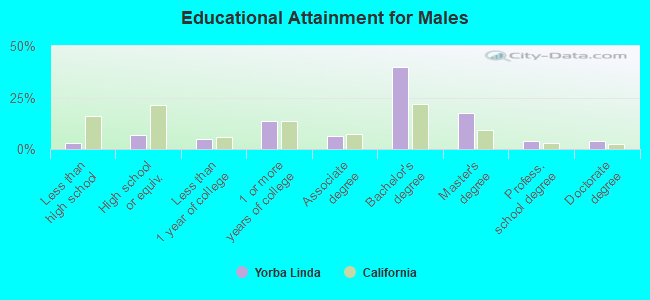
Education attainment for males 25 years and older:
- No schooling: 125
- Nursery to 4th grade: 0
- 5th and 6th grade: 358
- 7th and 8th grade: 102
- 9th grade: 0
- 10th grade: 24
- 11th grade: 0
- 12th grade, no diploma: 107
- High school graduate (or equivalency): 1,691
- Less than 1 year of college: 1,227
- Some college more than 1 year, no degree: 3,320
- Associate degree: 1,521
- Bachelor's degree: 9,675
- Master's degree: 4,228
- Professional school degree: 908
- Doctorate degree: 996
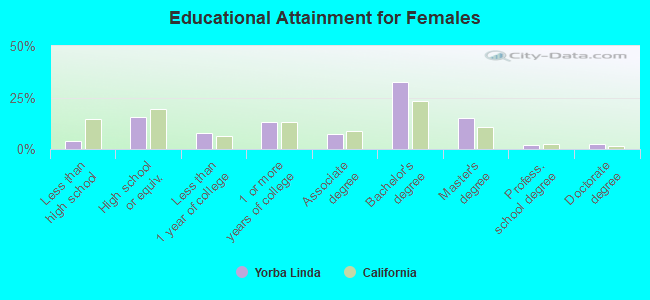
Education attainment for females 25 years and older:
- No schooling: 256
- Nursery to 4th grade: 0
- 5th and 6th grade: 94
- 7th and 8th grade: 287
- 9th grade: 49
- 10th grade: 89
- 11th grade: 0
- 12th grade, no diploma: 243
- High school graduate (or equivalency): 3,906
- Less than 1 year of college: 1,936
- Some college more than 1 year, no degree: 3,321
- Associate degree: 1,781
- Bachelor's degree: 8,179
- Master's degree: 3,772
- Professional school degree: 459
- Doctorate degree: 634
Housing units in structures:
- One, detached: 19,892
- One, attached: 2,568
- 3 or 4: 591
- 5 to 9: 380
- 10 to 19: 411
- 20 to 49: 45
- 50 or more: 822
- Mobile homes: 427
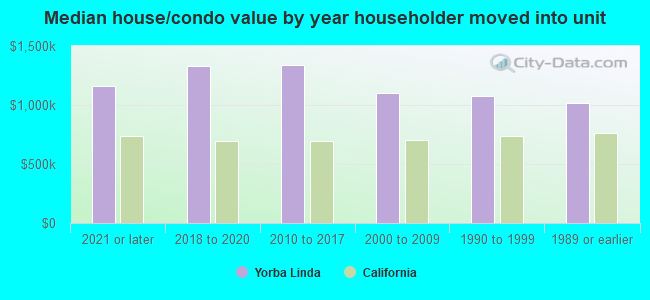
House/condo owner moved in on average 12 years ago
Renter moved in on average 1 years ago
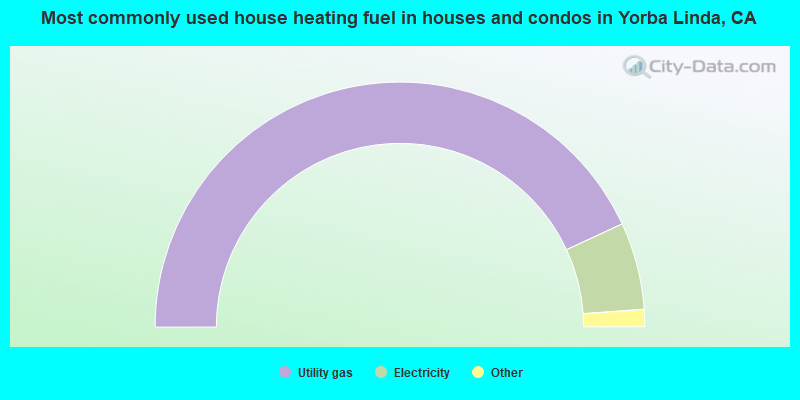
- 86.2%Utility gas
- 11.5%Electricity
- 1.0%Solar energy
- 0.7%Bottled, tank, or LP gas
- 0.4%Wood
- 0.2%No fuel used

- 71.4%Utility gas
- 22.8%Electricity
- 3.6%No fuel used
- 2.0%Bottled, tank, or LP gas
- 0.2%Solar energy
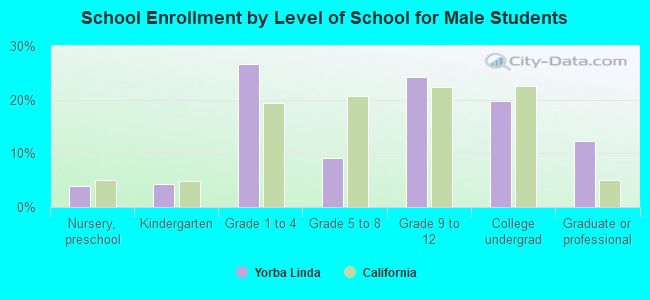
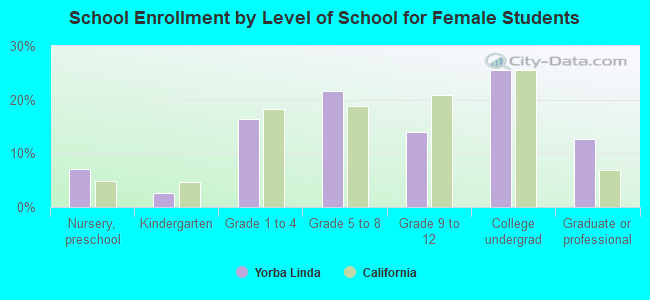
Private vs. public school enrollment:
| Here: | 23.6% |
| California: | 10.5% |
| Here: | 5.5% |
| California: | 8.5% |
| Here: | 15.4% |
| California: | 15.9% |