Zanesville, OH (Ohio) Houses and Residents
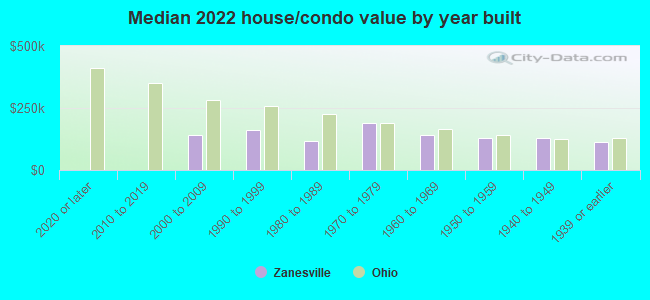
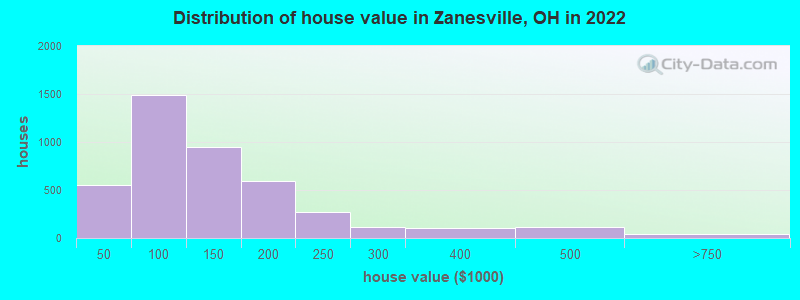
Estimated median house or condo value in 2022: $111,021 (it was $60,300 in 2000 )
Zanesville:
$111,021Ohio:
$204,100
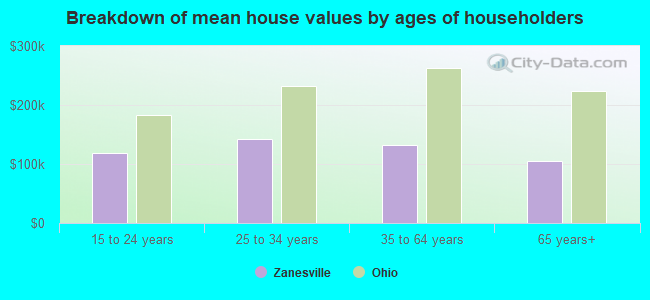
Lower value quartile - upper value quartile: $75,122 - $170,510Mean price in 2022: Detached houses: $131,901 Here:
$131,901State:
$254,366
Townhouses or other attached units: $202,734 Here:
$202,734State:
$225,733
In 2-unit structures: $271,054 Here:
$271,054State:
$144,384
In 3-to-4-unit structures: $148,651 Here:
$148,651State:
$203,002
In 5-or-more-unit structures: $170,373 Here:
$170,373State:
$211,593
Mobile homes: $171,270 Here:
$171,270State:
$62,719
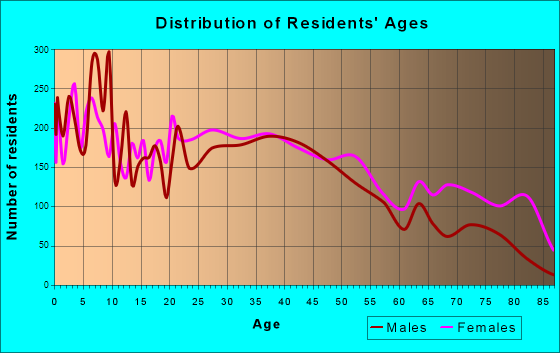
Total population: 25,372 (Urban population: 25,275 (all inside urban clusters), Rural population: 415 (all nonfarm) )
Houses: 12,170 (10,655 occupied: 4,663 owner occupied, 6,403 renter occupied )
% of renters here:
58%State:
33%
Housing density: 1,083 houses/condos per square mile
Median price asked for vacant for-sale houses and condos in 2022: $121,899.
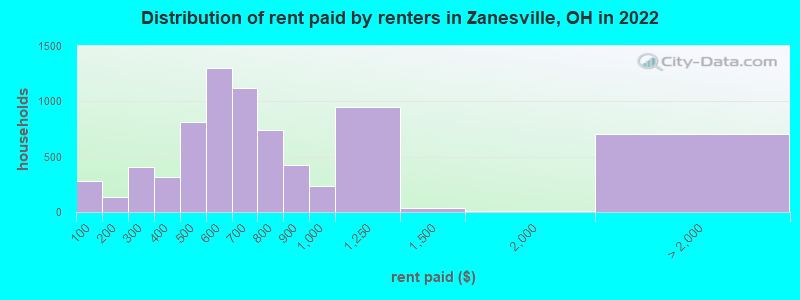
Median contract rent in 2022: $626 (lower quartile is $501, upper quartile is $845)
Median rent asked for vacant for-rent units in 2022: $666
Median gross rent in Zanesville, OH in 2022: $795
Housing units in Zanesville with a mortgage: 2,612 (260 second mortgage, 0 home equity loan, 205 both second mortgage and home equity loan )Houses without a mortgage: 46
Median household income for houses/condos with a mortgage: $70,528
Median household income for apartments without a mortgage: $48,268
Median monthly housing costs: $748
Data:
Median house or condo value ($)
Median house or condo value ($ change since 2000)
Median house or condo value ($) - White
Median house or condo value ($) - Black or African American
Median house or condo value ($) - Asian
Median house or condo value ($) - Hispanic or Latino
Median house or condo value ($) - American Indian and Alaska Native
Median house or condo value ($) - Multirace
Median house or condo value ($) - Other Race
Median price asked for mobile homes ($)
Household density (households per square mile)
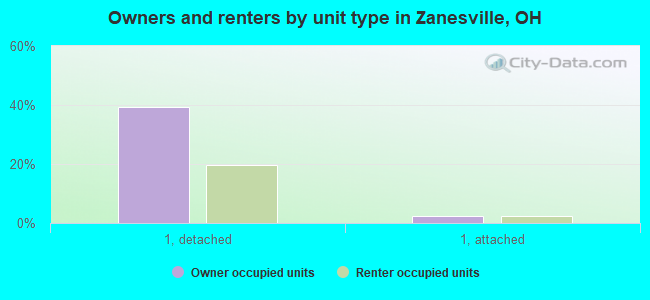
Mean house or condo value by units in structure - 1, detached ($)
Mean house or condo value by units in structure - 1, attached ($)
Mean house or condo value by units in structure - 2 ($)
Mean house or condo value by units in structure by units in structure - 3 or 4 ($)
Mean house or condo value by units in structure - 5 or more ($)
Mean house or condo value by units in structure - Boat, RV, van, etc. ($)
Mean house or condo value by units in structure - Mobile home ($)
Median contract rent ($)
Median contract rent - Lower quartile ($)
Median contract rent - Upper quartile ($)
Median gross rent ($)
Urban houses (%)
Rural houses (%)
Houses occupied (%)
Houses occupied (% change since 2000)
Houses owner occupied (%)
Houses owner occupied (% change since 2000)
Houses renter occupied (%)
Houses renter occupied (% change since 2000)
Vacant housing units - For rent (%)
Vacant housing units - For rent (% change since 2000)
Vacant housing units - For sale only (%)
Vacant housing units - For sale only (% change since 2000)
Vacant housing units - Rented or sold, not occupied (%)
Vacant housing units - Rented or sold, not occupied (% change since 2000)
Vacant housing units - For seasonal, recreational, or occasional use (%)
Vacant housing units - For seasonal, recreational, or occasional use (% change since 2000)
Vacant housing units - For migrant workers (%)
Vacant housing units - For migrant workers (% change since 2000)
Vacant housing units - Other vacant (%)
Vacant housing units - Other vacant (% change since 2000)
Median monthly housing costs ($)
Median household income for houses/condos with a mortgage ($)
Median household income for houses/condos without a mortgage ($)
Median household income ($)
Median household income ($) - White
Median household income ($) - Black or African American
Median household income ($) - Asian
Median household income ($) - Hispanic or Latino
Median household income ($) - American Indian and Alaska Native
Median household income ($) - Multirace
Median household income ($) - Other Race
Mortgage status - with mortgage (%)
Mortgage status - with second mortgage (%)
Mortgage status - with home equity loan (%)
Mortgage status - with both second mortgage and home equity loan (%)
Mortgage status - without a mortgage (%)
Median year house/condo built
Median year apartment built
Household type by relationship - Male householder living alone (%)
Household type by relationship - Male householder not living alone (%)
Household type by relationship - Female householder living alone (%)
Household type by relationship - Female householder not living alone (%)
Household type by relationship - Opposite-Sex spouse (%)
Household type by relationship - Same-Sex spouse (%)
Household type by relationship - Opposite-Sex unmarried partner (%)
Household type by relationship - Same-Sex unmarried partner (%)
Household type by relationship - In group quarters (%)
Size of family households - 2-person household (%)
Size of family households - 3-person household (%)
Size of family households - 4-person household (%)
Size of family households - 5-person household (%)
Size of family households - 6-person household (%)
Size of family households - 7-or-more-person household (%)
Size of nonfamily households - 1-person household (%)
Size of nonfamily households - 2-person household (%)
Size of nonfamily households - 3-person household (%)
Size of nonfamily households - 4-person household (%)
Size of nonfamily households - 5-person household (%)
Size of nonfamily households - 6-person household (%)
Size of nonfamily households - 7-or-moreperson household (%)
Year house built - Built 2010 or later (%)
Year house built - Built 2000 to 2009 (%)
Year house built - Built 1990 to 1999 (%)
Year house built - Built 1980 to 1989 (%)
Year house built - Built 1970 to 1979 (%)
Year house built - Built 1960 to 1969 (%)
Year house built - Built 1950 to 1959 (%)
Year house built - Built 1940 to 1949 (%)
Year house built - Built 1939 or earlier (%)
Median number of rooms in houses and condos
Median number of rooms in apartments
Median number of bedrooms in owner occupied houses
Mean number of bedrooms in owner occupied houses
Median number of bedrooms in renter occupied houses
Mean number of bedrooms in renter occupied houses
Median number of vehichles in owner occupied houses
Mean number of vehichles in owner occupied houses
Median number of vehichles in renter occupied houses
Mean number of vehichles in renter occupied houses
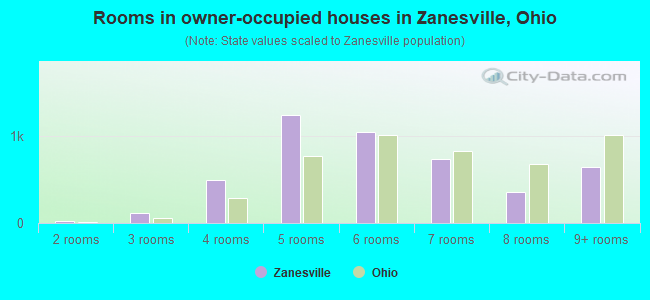
Rooms in owner-occupied houses - 1 room (%)
Rooms in owner-occupied houses - 2 rooms (%)
Rooms in owner-occupied houses - 3 rooms (%)
Rooms in owner-occupied houses - 4 rooms (%)
Rooms in owner-occupied houses - 5 rooms (%)
Rooms in owner-occupied houses - 6 rooms (%)
Rooms in owner-occupied houses - 7 rooms (%)
Rooms in owner-occupied houses - 8 rooms (%)
Rooms in owner-occupied houses - 9+ rooms (%)
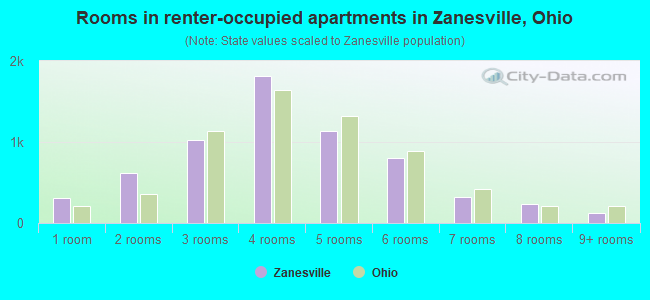
Rooms in renter-occupied houses - 1 room (%)
Rooms in renter-occupied houses - 2 rooms (%)
Rooms in renter-occupied houses - 3 rooms (%)
Rooms in renter-occupied houses - 4 rooms (%)
Rooms in renter-occupied houses - 5 rooms (%)
Rooms in renter-occupied houses - 6 rooms (%)
Rooms in renter-occupied houses - 7 rooms (%)
Rooms in renter-occupied houses - 8 rooms (%)
Rooms in renter-occupied houses - 9+ rooms (%)
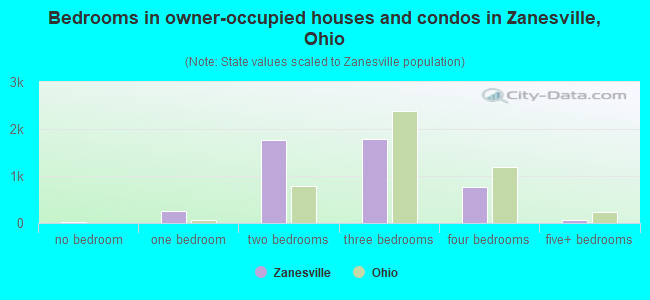
Bedrooms in owner-occupied houses - no bedrooms (%)
Bedrooms in owner-occupied houses - 1 bedroom (%)
Bedrooms in owner-occupied houses - 2 bedrooms (%)
Bedrooms in owner-occupied houses - 3 bedrooms (%)
Bedrooms in owner-occupied houses - 4 bedrooms (%)
Bedrooms in owner-occupied houses - 5+ bedrooms (%)
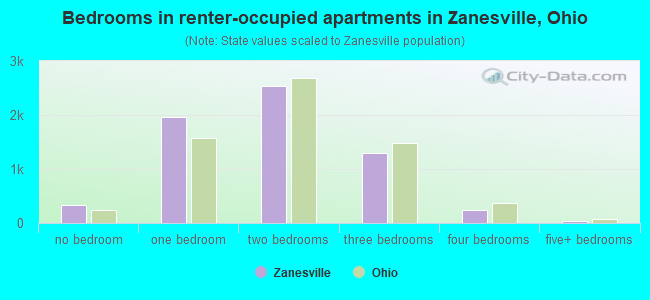
Bedrooms in renter-occupied houses - no bedrooms (%)
Bedrooms in renter-occupied houses - 1 bedroom (%)
Bedrooms in renter-occupied houses - 2 bedrooms (%)
Bedrooms in renter-occupied houses - 3 bedrooms (%)
Bedrooms in renter-occupied houses - 4 bedrooms (%)
Bedrooms in renter-occupied houses - 5+ bedrooms (%)
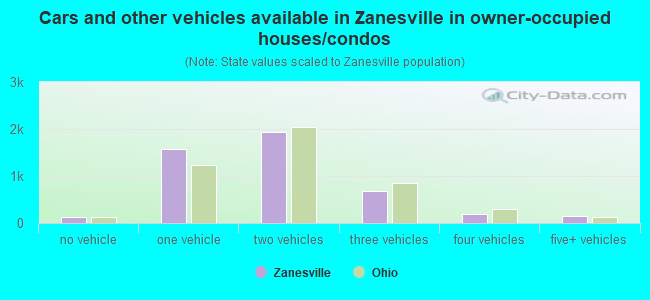
Vehicles available in owner-occupied houses - no vehicle available (%)
Vehicles available in owner-occupied houses - 1 vehicle available(%)
Vehicles available in owner-occupied houses - 2 Vehicles available (%)
Vehicles available in owner-occupied houses - 3 Vehicles available (%)
Vehicles available in owner-occupied houses - 4 Vehicles available (%)
Vehicles available in owner-occupied houses - 5+ Vehicles available (%)
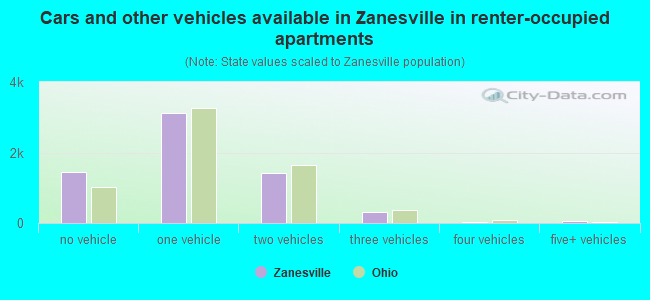
Vehicles available in renter-occupied houses - no vehicle available (%)
Vehicles available in renter-occupied houses - 1 vehicle available (%)
Vehicles available in renter-occupied houses - 2 Vehicles available (%)
Vehicles available in renter-occupied houses - 3 Vehicles available (%)
Vehicles available in renter-occupied houses - 4 Vehicles available (%)
Vehicles available in renter-occupied houses - 5+ Vehicles available (%)
Housing units in structures - 1, detached (%)
Housing units in structures - 1, attached (%)
Housing units in structures - 2 (%)
Housing units in structures - 3 or 4 (%)
Housing units in structures - 5 to 9 (%)
Housing units in structures - 10 to 19 (%)
Housing units in structures - 20 to 49 (%)
Housing units in structures - 50 or more (%)
Housing units in structures - Mobile home (%)
Housing units in structures - Boat, RV, van, etc. (%)
Housing units in structures - Owners - 1, detached (%)
Housing units in structures - Owners - 1, attached (%)
Housing units in structures - Owners - 2 (%)
Housing units in structures - Owners - 3 or 4 (%)
Housing units in structures - Owners - 5 to 9 (%)
Housing units in structures - Owners - 10 to 19 (%)
Housing units in structures - Owners - 20 to 49 (%)
Housing units in structures - Owners - 50 or more (%)
Housing units in structures - Owners - Mobile home (%)
Housing units in structures - Owners - Boat, RV, van, etc. (%)
Housing units in structures - Renters - 1, detached (%)
Housing units in structures - Renters - 1, attached (%)
Housing units in structures - Renters - 2 (%)
Housing units in structures - Renters - 3 or 4 (%)
Housing units in structures - Renters - 5 to 9 (%)
Housing units in structures - Renters - 10 to 19 (%)
Housing units in structures - Renters - 20 to 49 (%)
Housing units in structures - Renters - 50 or more (%)
Housing units in structures - Renters - Mobile home (%)
Housing units in structures - Renters - Boat, RV, van, etc. (%)
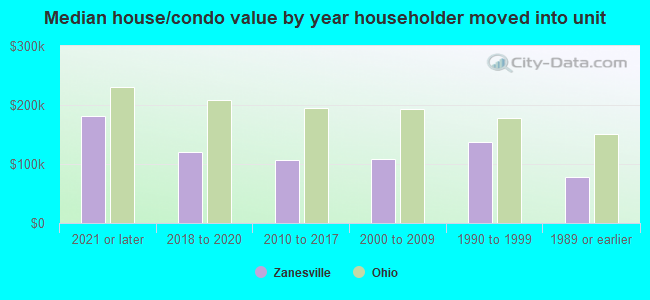
House/condo owner moved in on average (years ago)
Renter moved in on average (years ago)
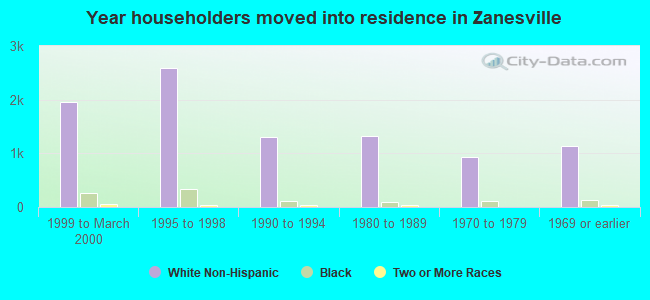
Year householder moved into unit - Moved in 1999 to March 2000 (%)
Year householder moved into unit - Moved in 1999 to March 2000 (%) - White
Year householder moved into unit - Moved in 1999 to March 2000 (%) - Black or African American
Year householder moved into unit - Moved in 1999 to March 2000 (%) - Asian
Year householder moved into unit - Moved in 1999 to March 2000 (%) - Hispanic or Latino
Year householder moved into unit - Moved in 1999 to March 2000 (%) - American Indian and Alaska Native
Year householder moved into unit - Moved in 1999 to March 2000 (%) - Multirace
Year householder moved into unit - Moved in 1999 to March 2000 (%) - Other Race
Year householder moved into unit - Moved in 1995 to 1998 (%)
Year householder moved into unit - Moved in 1995 to 1998 (%) - White
Year householder moved into unit - Moved in 1995 to 1998 (%) - Black or African American
Year householder moved into unit - Moved in 1995 to 1998 (%) - Asian
Year householder moved into unit - Moved in 1995 to 1998 (%) - Hispanic or Latino
Year householder moved into unit - Moved in 1995 to 1998 (%) - American Indian and Alaska Native
Year householder moved into unit - Moved in 1995 to 1998 (%) - Multirace
Year householder moved into unit - Moved in 1995 to 1998 (%) - Other Race
Year householder moved into unit - Moved in 1990 to 1994 (%)
Year householder moved into unit - Moved in 1990 to 1994 (%) - White
Year householder moved into unit - Moved in 1990 to 1994 (%) - Black or African American
Year householder moved into unit - Moved in 1990 to 1994 (%) - Asian
Year householder moved into unit - Moved in 1990 to 1994 (%) - Hispanic or Latino
Year householder moved into unit - Moved in 1990 to 1994 (%) - American Indian and Alaska Native
Year householder moved into unit - Moved in 1990 to 1994 (%) - Multirace
Year householder moved into unit - Moved in 1990 to 1994 (%) - Other Race
Year householder moved into unit - Moved in 1980 to 1989 (%)
Year householder moved into unit - Moved in 1980 to 1989 (%) - White
Year householder moved into unit - Moved in 1980 to 1989 (%) - Black or African American
Year householder moved into unit - Moved in 1980 to 1989 (%) - Asian
Year householder moved into unit - Moved in 1980 to 1989 (%) - Hispanic or Latino
Year householder moved into unit - Moved in 1980 to 1989 (%) - American Indian and Alaska Native
Year householder moved into unit - Moved in 1980 to 1989 (%) - Multirace
Year householder moved into unit - Moved in 1980 to 1989 (%) - Other Race
Year householder moved into unit - Moved in 1970 to 1979 (%)
Year householder moved into unit - Moved in 1970 to 1979 (%) - White
Year householder moved into unit - Moved in 1970 to 1979 (%) - Black or African American
Year householder moved into unit - Moved in 1970 to 1979 (%) - Asian
Year householder moved into unit - Moved in 1970 to 1979 (%) - Hispanic or Latino
Year householder moved into unit - Moved in 1970 to 1979 (%) - American Indian and Alaska Native
Year householder moved into unit - Moved in 1970 to 1979 (%) - Multirace
Year householder moved into unit - Moved in 1970 to 1979 (%) - Other Race
Year householder moved into unit - Moved in 1969 or earlier (%)
Year householder moved into unit - Moved in 1969 or earlier (%) - White
Year householder moved into unit - Moved in 1969 or earlier (%) - Black or African American
Year householder moved into unit - Moved in 1969 or earlier (%) - Asian
Year householder moved into unit - Moved in 1969 or earlier (%) - Hispanic or Latino
Year householder moved into unit - Moved in 1969 or earlier (%) - American Indian and Alaska Native
Year householder moved into unit - Moved in 1969 or earlier (%) - Multirace
Year householder moved into unit - Moved in 1969 or earlier (%) - Other Race
Housing units lacking complete plumbing facilities (%)
Housing units lacking complete kitchen facilities (%)
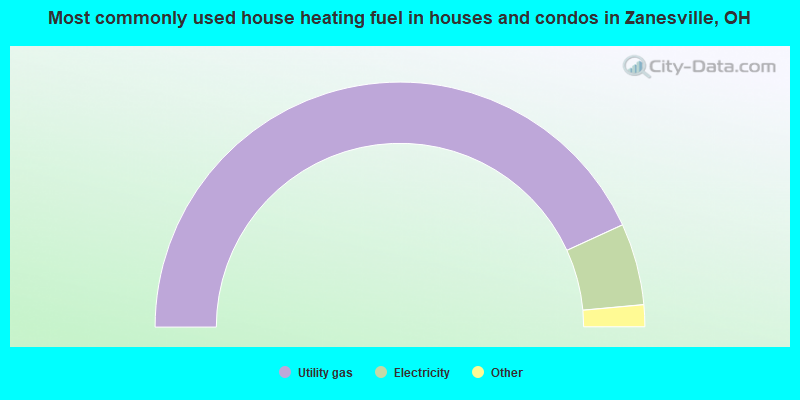
House heating fuel used in houses and condos - Utility gas (%)
House heating fuel used in houses and condos - Bottled, tank, or LP gas (%)
House heating fuel used in houses and condos - Electricity (%)
House heating fuel used in houses and condos - Fuel oil, kerosene, etc. (%)
House heating fuel used in houses and condos - Coal or coke (%)
House heating fuel used in houses and condos - Wood (%)
House heating fuel used in houses and condos - Solar energy (%)
House heating fuel used in houses and condos - Other fuel (%)
House heating fuel used in houses and condos - No fuel used (%)
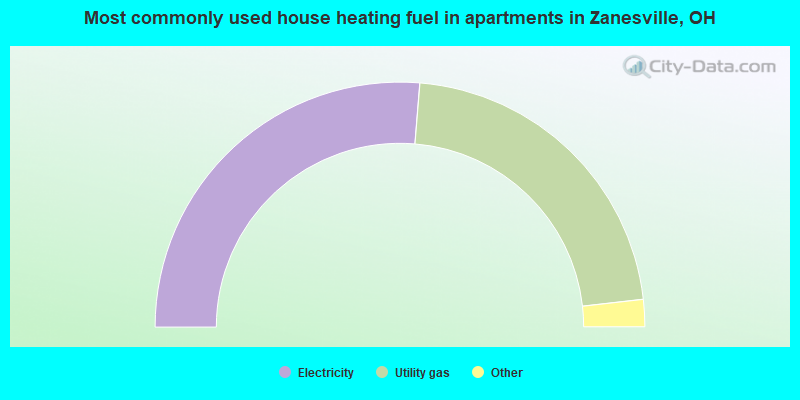
House heating fuel used in apartments - Utility gas (%)
House heating fuel used in apartments - Bottled, tank, or LP gas (%)
House heating fuel used in apartments - Electricity (%)
House heating fuel used in apartments - Fuel oil, kerosene, etc. (%)
House heating fuel used in apartments - Coal or coke (%)
House heating fuel used in apartments - Wood (%)
House heating fuel used in apartments - Solar energy (%)
House heating fuel used in apartments - Other fuel (%)
House heating fuel used in apartments - No fuel used (%)
Latest news about housing in Zanesville, OH collected exclusively by city-data.com from local newspapers, TV, and radio stations
Median year house/condo built: 1944Median year apartment built: 1964Household type by relationship:
Households: 24,691
Male householders: 4,317 (1,741 living alone ), Female householders: 6,309 (2,354 living alone )2,853 spouses (2,845 opposite-sex spouses ), 1,479 unmarried partners , (1,438 opposite-sex unmarried partners ), 6,619 children (6,051 natural , 53 adopted , 514 stepchildren ), 656 grandchildren , 467 brothers or sisters , 159 parents , 11 foster children , 362 other relatives , 891 non-relatives In group quarters: 562
Size of family households: 2,435 2-persons , 1,730 3-persons , 824 4-persons , 658 5-persons , 102 6-persons , 32 7-or-more-persons .
Size of nonfamily households: 4,316 1-person , 1,064 2-persons , 77 3-persons .
1,394 married couples with children. single-parent households (774 men , 2,360 women ).
96.7% of residents of Zanesville speak English at home. of residents speak Spanish at home (38% speak English very well , 62% speak English well ).of residents speak other Indo-European language at home (96% speak English very well , 4% speak English not well ).of residents speak Asian or Pacific Island language at home (32% speak English very well , 35% speak English well , 14% speak English not well , 18% don't speak English at all ).
Foreign born population: 425 (1.7%)of them are naturalized citizens )
Median number of rooms in houses and condos:
Median number of rooms in apartments
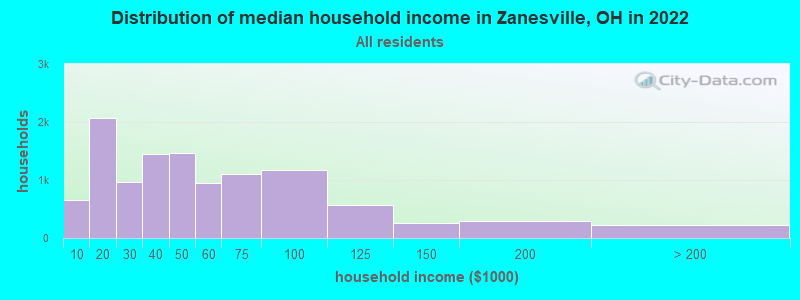
Zanesville, OH household income distribution 651 Less than $10,0002,075 $10,000 to $19,999969 $20,000 to $29,9991,443 $30,000 to $39,9991,461 $40,000 to $49,999942 $50,000 to $59,9991,105 $60,000 to $74,9991,175 $75,000 to $99,999573 $100,000 to $124,999252 $125,000 to $149,999290 $150,000 to $199,999219 $200,000 or more
Home value of owner - occupied houses in 2022 in Zanesville, OH 44 Less than $10,00018 $10,000 to $14,999125 $15,000 to $19,99910 $20,000 to $24,99947 $25,000 to $29,999120 $30,000 to $34,99955 $35,000 to $39,999125 $40,000 to $49,999243 $50,000 to $59,999351 $60,000 to $69,999162 $70,000 to $79,999313 $80,000 to $89,999291 $90,000 to $99,999568 $100,000 to $124,999380 $125,000 to $149,999336 $150,000 to $174,999251 $175,000 to $199,999274 $200,000 to $249,999116 $250,000 to $299,99998 $300,000 to $399,999119 $400,000 to $499,99928 $500,000 to $749,99915 $750,000 to $999,999Rent paid by renters in 2022 in Zanesville, OH 283 Less than $100101 $100 to $14931 $150 to $199292 $200 to $249111 $250 to $29923 $300 to $349291 $350 to $399239 $400 to $449570 $450 to $499527 $500 to $549773 $550 to $599774 $600 to $649345 $650 to $699221 $700 to $749516 $750 to $799423 $800 to $899236 $900 to $999944 $1,000 to $1,24939 $1,250 to $1,4999 $1,500 to $1,99917 $2,000 to $2,49955 $3,000 to $3,499320 $3,500 or more311 No cash rent
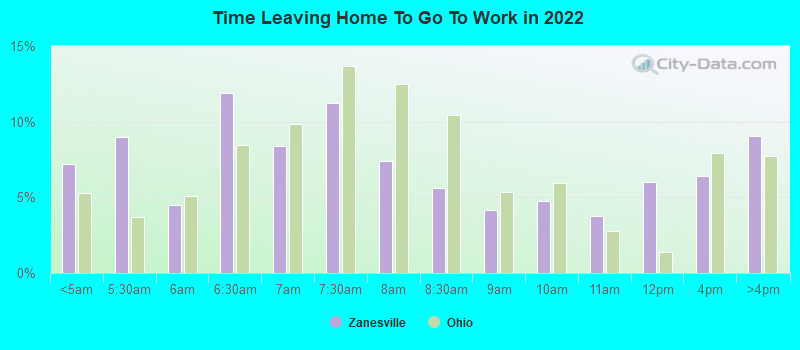
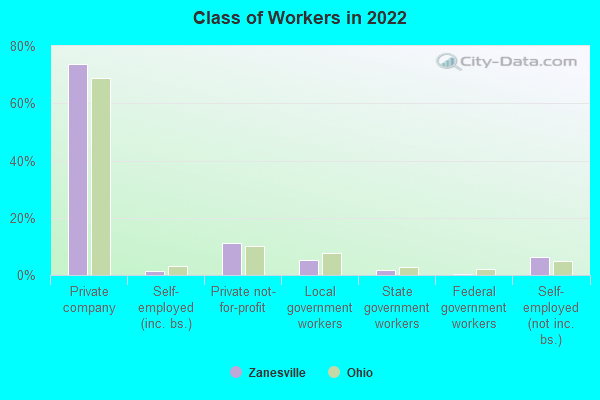
Percentage of workers working in this county: 80.6%Number of people working at home: 661 (6.6% of all workers )
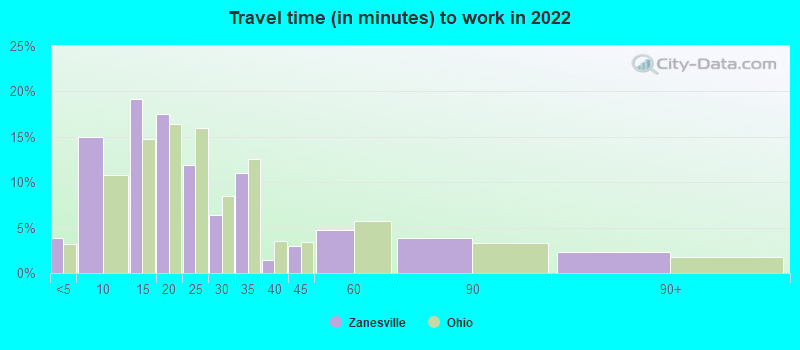
Travel time to work (commute)
Less than 5 minutes: 5645 to 9 minutes: 1,90210 to 14 minutes: 2,27115 to 19 minutes: 1,41120 to 24 minutes: 60925 to 29 minutes: 33530 to 34 minutes: 59135 to 39 minutes: 20540 to 44 minutes: 25145 to 59 minutes: 39660 to 89 minutes: 48890 or more minutes: 303
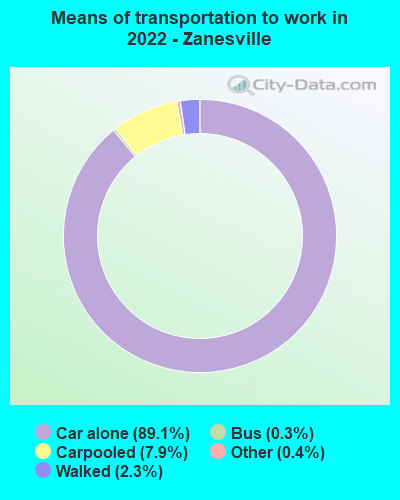
Means of transportation to work:
Drove a car alone: 17,062 (83.2%)Carpooled: 1,629 (7.9%)Bus : 45 (0.2%)Taxi: 88 (0.4%)Walked: 444 (2.2%)Worked at home: 661 (3.2%)
Unemployment by race in 2022
Unemployment rate for White non-Hispanic residents 8.6% Males4.8% FemalesUnemployment rate for Black residents 21.6% MalesUnemployment rate for American Indian and Alaska Native residents 100.0% FemalesUnemployment rate for other race residents 64.9% FemalesUnemployment rate for two or more race residents 11.3% Males10.0% FemalesUnemployment rate for Hispanic or Latino residents 46.0% Females
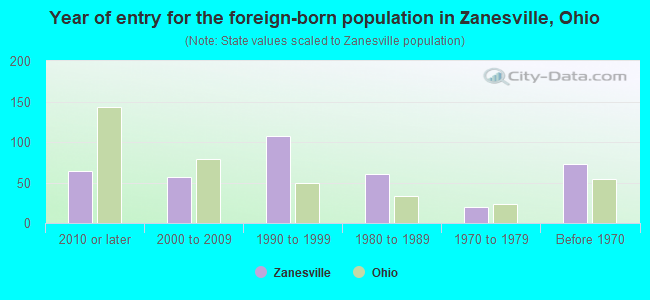
Year of entry for the foreign-born population in Zanesville, Ohio
64 2010 or later 57 2000 to 2009 108 1990 to 1999 61 1980 to 1989 20 1970 to 1979 73 Before 1970
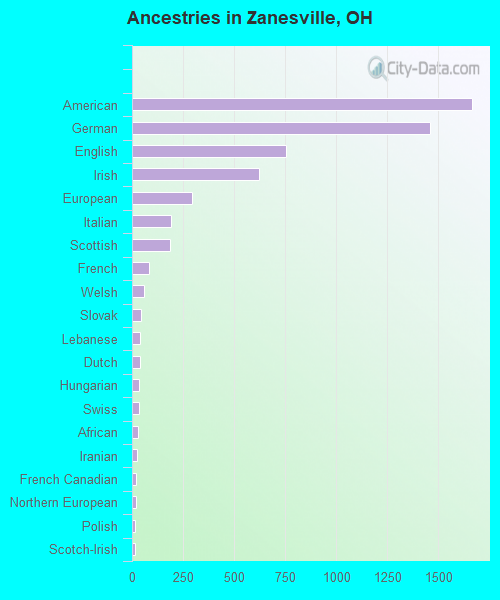
First ancestries reported:
American: 1,666 (17.3%)
German: 1,461 (15.2%)
English: 753 (7.8%)
Irish: 623 (6.5%)
European: 292 (3.0%)
Italian: 192 (2.0%)
Scottish: 184 (1.9%)
French: 84 (0.9%)
Welsh: 60 (0.6%)
Slovak: 43 (0.4%)
Lebanese: 40 (0.4%)
Dutch: 37 (0.4%)
Hungarian: 33 (0.3%)
Swiss: 32 (0.3%)
African: 28 (0.3%)
Iranian: 24 (0.2%)
French Canadian: 21 (0.2%)
Northern European: 19 (0.2%)
Polish: 16 (0.2%)
Scotch-Irish: 16 (0.2%)
Croatian: 15 (0.2%)
Danish: 13 (0.1%)
Norwegian: 9 (0.09%)
Czechoslovakian: 8 (0.08%)
Scandinavian: 7 (0.07%)
Moroccan: 5 (0.05%) Most common places of birth for foreign-born residents (%): Pakistan Zanesville:
38.5% (121)Ohio:
1.0% (5,444)
China, excluding Hong Kong and Taiwan Zanesville:
20.4% (64)Ohio:
6.2% (35,703)
Philippines Zanesville:
17.5% (55)Ohio:
3.1% (17,818)
Thailand Zanesville:
15.0% (47)Ohio:
0.5% (3,090)
Laos Zanesville:
8.9% (28)Ohio:
0.4% (2,488)
Honduras Zanesville:
3.2% (10)Ohio:
1.0% (5,553)
Hungary Zanesville:
1.9% (6)Ohio:
0.4% (2,140)
Morocco Zanesville:
1.9% (6)Ohio:
0.5% (2,962)
Place of birth for U.S.-born residents:
This state: 21,477Other state: 2,528Northeast: 322Midwest: 538South: 1,218West: 442 81.9% of Zanesville residents lived in the same house 1 years ago.
Out of people who lived in different houses, 37.5% lived in this county.
Out of people who lived in different counties, 79.6% lived in Ohio.
Zanesville:
81.9%State average:
87.8%
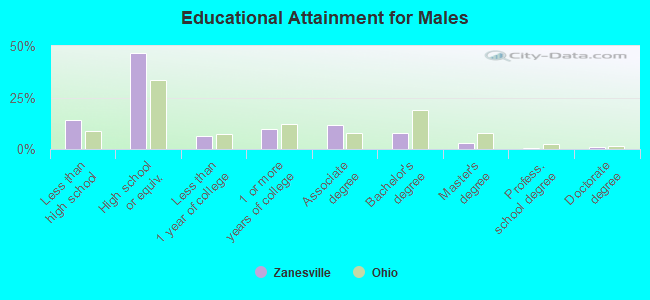
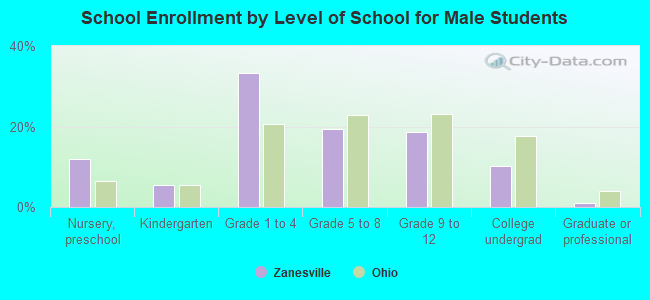
Education attainment for males 25 years and older:
No schooling: 260Nursery to 4th grade: 195th and 6th grade: 87th and 8th grade: 769th grade: 4810th grade: 7911th grade: 55512th grade, no diploma: 61High school graduate (or equivalency): 3,729Less than 1 year of college: 488Some college more than 1 year, no degree: 770Associate degree: 920Bachelor's degree: 616Master's degree: 245Professional school degree: 43Doctorate degree: 58
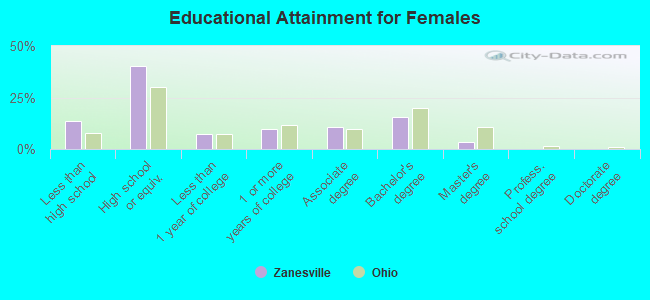
Education attainment for females 25 years and older:
No schooling: 83Nursery to 4th grade: 395th and 6th grade: 107th and 8th grade: 1809th grade: 9810th grade: 23311th grade: 36712th grade, no diploma: 173High school graduate (or equivalency): 3,566Less than 1 year of college: 635Some college more than 1 year, no degree: 839Associate degree: 961Bachelor's degree: 1,359Master's degree: 281Professional school degree: 8Doctorate degree: 0
Housing units in structures:
One, detached: 7,610One, attached: 263Two: 6023 or 4: 8855 to 9: 1,18410 to 19: 28520 to 49: 62350 or more: 562Mobile homes: 151Housing units lacking complete plumbing facilities in 2022: 4.8%Housing units lacking complete kitchen facilities in 2022: 9.1%House/condo owner moved in on average 11 years ago
Renter moved in on average 1 years ago
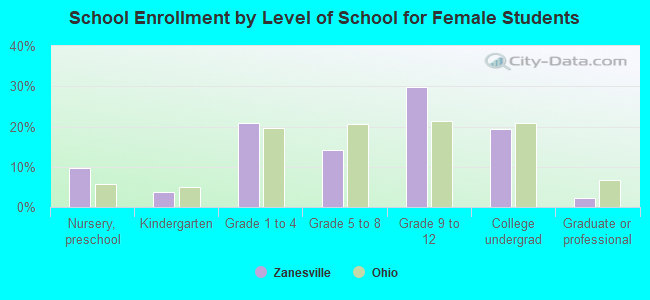
Private vs. public school enrollment:
Students in private schools in grades 1 to 8 (elementary and middle school): 222 Students in private schools in grades 9 to 12 (high school): 29 Students in private undergraduate colleges: 197