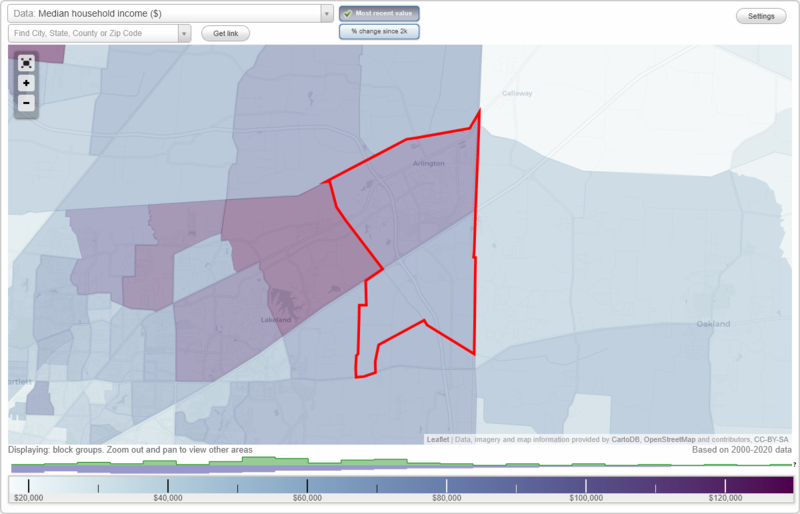
The median household income in Arlington, TN in 2022 was $120,108, which was 45.7% greater than the median annual income of $65,254 across the entire state of Tennessee. Compared to the median income of $52,870 in 2000 this represents an increase of 56.0%. The per capita income in 2022 was $40,696, which means an increase of 51.9% compared to 2000 when it was $19,569.
Whole page based on the data from 2000 / 2022 when the population of Arlington, Tennessee was 2,569 / 14,186
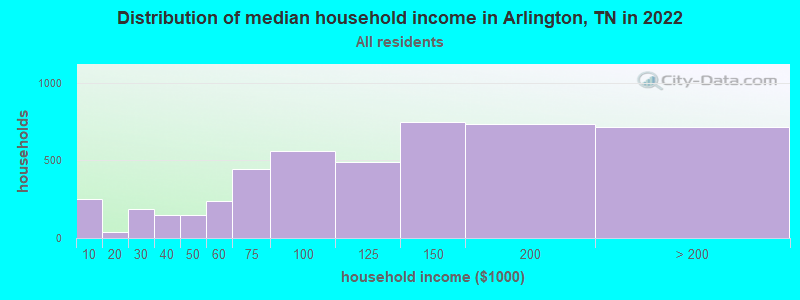
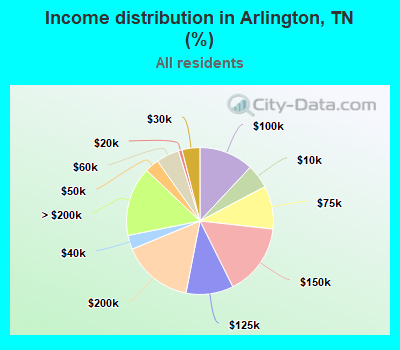
Income statistics for all residents
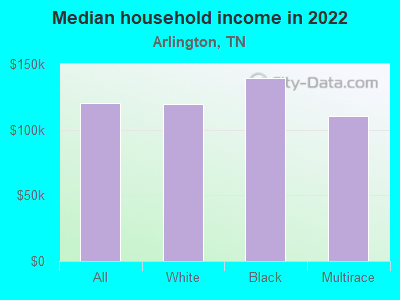
Median household income in Arlington, TN in 2022:
Arlington:
$120,109
State:
$65,254
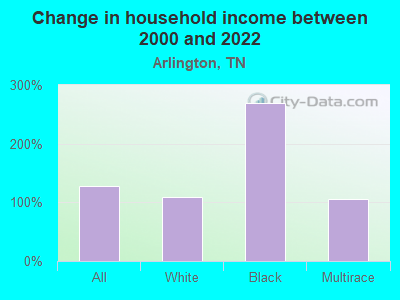
Change in median household income between 2000 and 2022:
Arlington, Tennessee:
+127.2%
State:
+79.5%
Number of households with income < $10k:
Arlington:
5.3% (249)
State:
5.4% (154,793)
Number of households with income $10k - 20k:
Arlington:
0.8% (38)
State:
8.0% (228,599)
Number of households with income $20k - 30k:
Arlington:
3.9% (185)
State:
7.9% (224,908)
Number of households with income $30k - 40k:
Arlington:
3.1% (146)
State:
8.6% (244,297)
Number of households with income $40k - 50k:
Arlington:
3.1% (147)
Tennessee:
8.4% (238,949)
Number of households with income $50k - 60k:
Arlington:
5.1% (238)
Tennessee:
7.7% (218,438)
Number of households with income $60k - 75k:
Arlington:
9.5% (447)
State:
10.3% (294,172)
Number of households with income $75k - 100k:
Arlington:
12.0% (564)
State:
13.3% (377,310)
Number of households with income $100k - 125k:
Arlington:
10.4% (491)
State:
9.5% (269,124)
Number of households with income $125k - 150k:
Arlington:
15.9% (748)
State:
6.3% (178,328)
Number of households with income $150k - 200k:
Arlington:
15.7% (738)
State:
7.2% (204,030)
Number of households with income > $200k:
Arlington:
15.2% (717)
Tennessee:
7.5% (213,736)
Aggregate household income in Arlington in 2022: $570,420,228
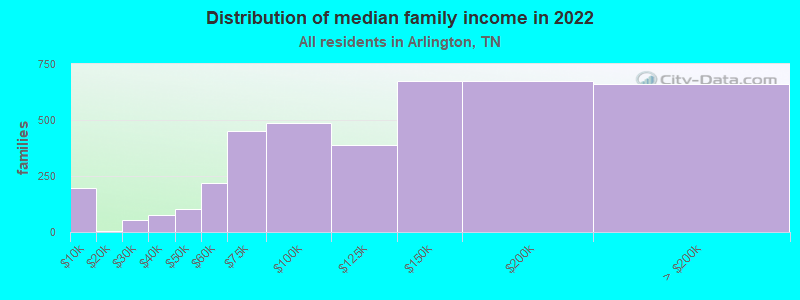
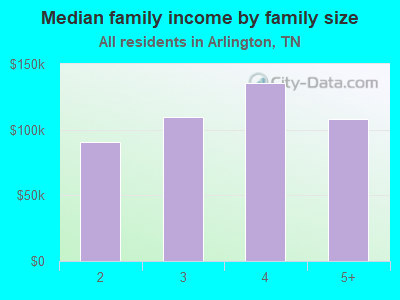
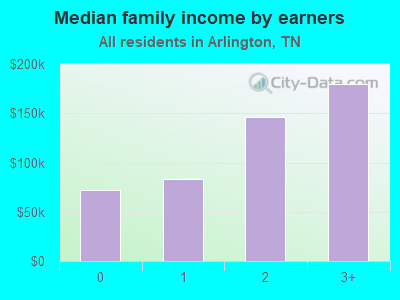
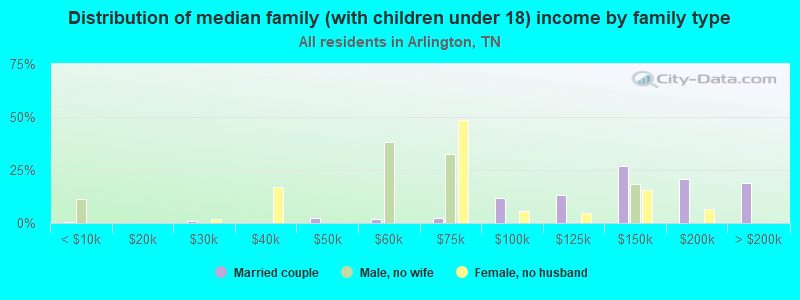
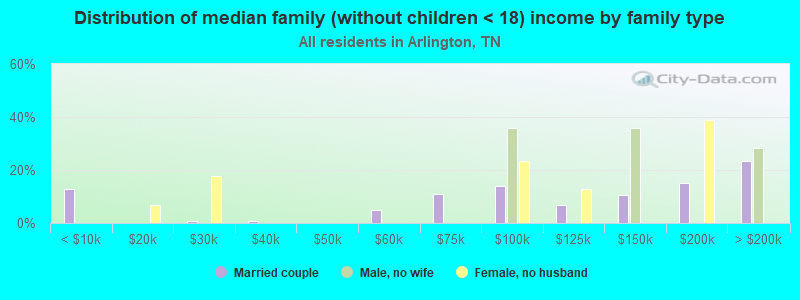
Median family income in Arlington in 2022:
Arlington:
$123,492
State:
$80,910
Number of families with income < $10k:
Arlington:
4.9% (195)
State:
3.9% (72,917)
Number of families with income $10k - 20k:
Arlington:
0.2% (6)
State:
4.0% (73,770)
Number of families with income $20k - 30k:
Arlington:
1.3% (52)
State:
5.6% (104,070)
Number of families with income $30k - 40k:
Arlington:
1.9% (76)
Tennessee:
7.2% (133,292)
Number of families with income $40k - 50k:
Arlington:
2.6% (103)
Tennessee:
7.4% (136,997)
Number of families with income $50k - 60k:
Arlington:
5.5% (217)
Tennessee:
7.1% (131,374)
Number of families with income $60k - 75k:
Arlington:
11.3% (449)
Tennessee:
10.8% (198,685)
Number of families with income $75k - 100k:
Arlington:
12.2% (486)
State:
15.1% (279,195)
Number of families with income $100k - 125k:
Arlington:
9.8% (388)
Tennessee:
11.7% (216,356)
Number of families with income $125k - 150k:
Arlington:
16.9% (673)
State:
7.8% (144,000)
Number of families with income $150k - 200k:
Arlington:
16.9% (673)
State:
9.3% (172,160)
Number of families with income > $200k:
Arlington:
16.6% (662)
Tennessee:
10.0% (183,756)
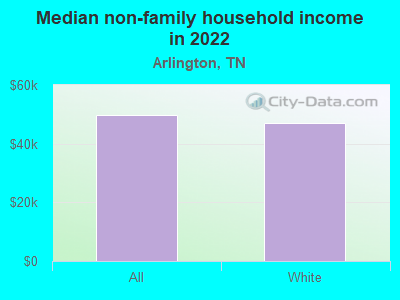
Median non-family income in Arlington in 2022:
Arlington:
$49,660
State:
$40,285
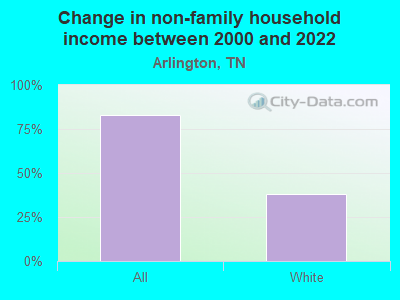
Change in median non-family income between 2000 and 2022:
Arlington, Tennessee:
+82.8%
State:
+91.5%
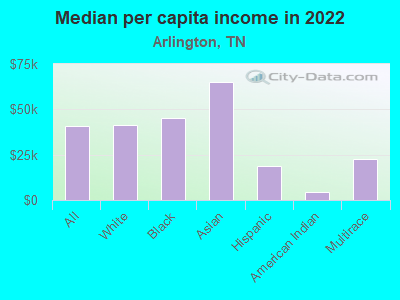
Median per capita income in Arlington in 2022:
Arlington:
$40,697
State:
$36,704
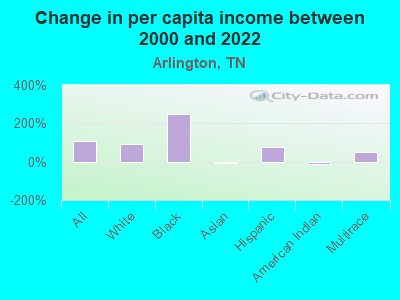
Change in median per capita income between 2000 and 2022:
Arlington, Tennessee:
+108.0%
State:
+89.3%
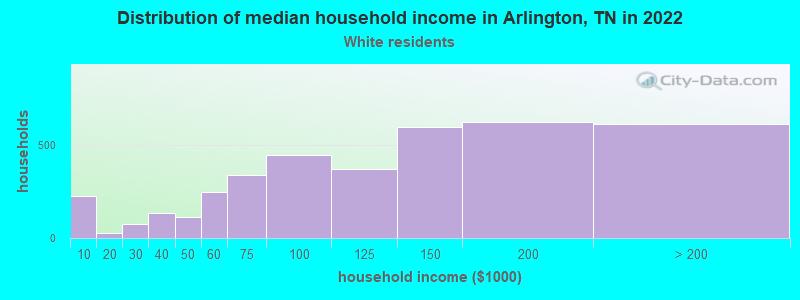
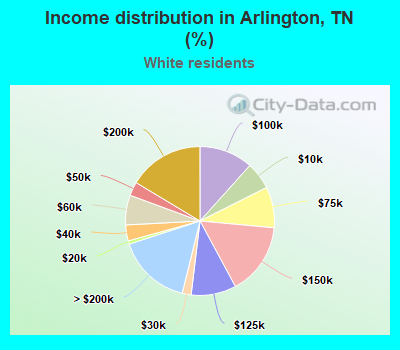
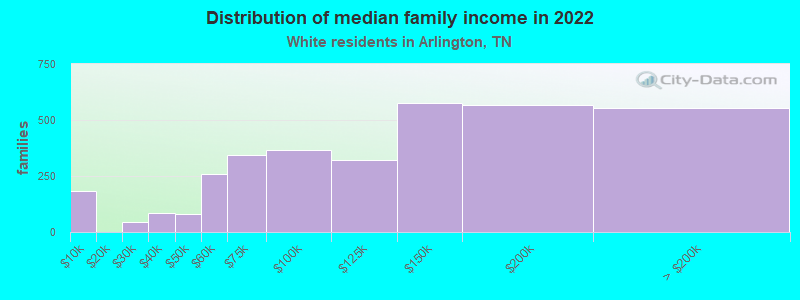
Income statistics for White residents
Median household income in Arlington, TN in 2022:
Arlington:
$119,549
Tennessee:
$69,826
Change in median household income between 2000 and 2022:
Arlington, Tennessee:
+108.9%
State:
+82.9%
Number of households with income < $10k:
Arlington:
5.9% (226)
Tennessee:
4.6% (100,279)
Number of households with income $10k - 20k:
Arlington:
0.7% (27)
State:
7.6% (165,031)
Number of households with income $20k - 30k:
Arlington:
1.9% (74)
Tennessee:
7.4% (160,229)
Number of households with income $30k - 40k:
Arlington:
3.5% (132)
Tennessee:
8.1% (174,784)
Number of households with income $40k - 50k:
Arlington:
3.0% (114)
State:
7.8% (169,622)
Number of households with income $50k - 60k:
Arlington:
6.5% (246)
Tennessee:
7.6% (165,508)
Number of households with income $60k - 75k:
Arlington:
8.9% (338)
State:
10.3% (223,937)
Number of households with income $75k - 100k:
Arlington:
11.7% (444)
State:
13.5% (292,688)
Number of households with income $100k - 125k:
Arlington:
9.8% (373)
State:
10.1% (219,251)
Number of households with income $125k - 150k:
Arlington:
15.7% (596)
State:
6.6% (142,574)
Number of households with income $150k - 200k:
Arlington:
16.4% (624)
State:
7.7% (166,039)
Number of households with income > $200k:
Arlington:
16.1% (614)
State:
8.5% (184,546)
Aggregate household income in Arlington in 2022: $463,010,403
Median family income in Arlington in 2022:
Arlington:
$126,694
Tennessee:
$86,015
Number of families with income < $10k:
Arlington:
5.3% (181)
Tennessee:
3.1% (43,751)
Number of families with income $20k - 30k:
Arlington:
1.3% (43)
State:
5.0% (70,431)
Number of families with income $30k - 40k:
Arlington:
2.5% (85)
State:
6.6% (93,498)
Number of families with income $40k - 50k:
Arlington:
2.4% (80)
Tennessee:
6.8% (96,726)
Number of families with income $50k - 60k:
Arlington:
7.7% (258)
State:
7.2% (101,879)
Number of families with income $60k - 75k:
Arlington:
10.2% (344)
State:
10.7% (151,997)
Number of families with income $75k - 100k:
Arlington:
10.9% (368)
State:
15.4% (218,373)
Number of families with income $100k - 125k:
Arlington:
9.5% (320)
State:
12.6% (178,761)
Number of families with income $125k - 150k:
Arlington:
17.0% (576)
State:
8.2% (116,575)
Number of families with income $150k - 200k:
Arlington:
16.8% (569)
Tennessee:
9.9% (141,123)
Number of families with income > $200k:
Arlington:
16.4% (554)
Tennessee:
11.2% (159,431)
Median non-family income in Arlington in 2022:
Arlington:
$46,978
State:
$41,178
Change in median non-family income between 2000 and 2022:
Arlington, Tennessee:
+37.9%
State:
+91.1%
Median per capita income in Arlington in 2022:
Arlington:
$41,100
State:
$40,126
Change in median per capita income between 2000 and 2022:
Arlington, Tennessee:
+92.3%
State:
+92.6%
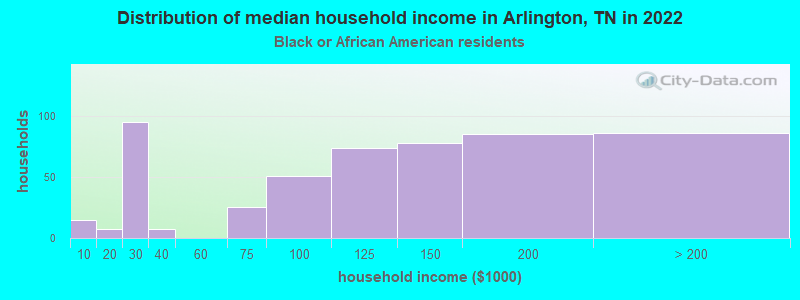
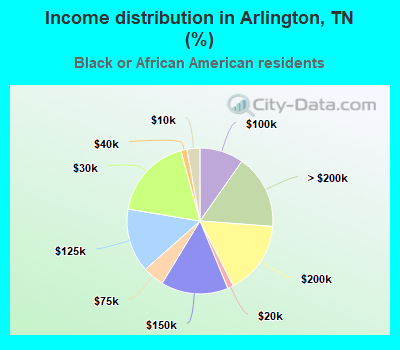
Income statistics for Black or African American residents
Median household income in Arlington, TN in 2022:
Arlington:
$139,028
State:
$49,531
Number of households with income < $10k:
Arlington:
2.9% (15)
State:
9.1% (39,909)
Number of households with income $10k - 20k:
Arlington:
1.3% (7)
Tennessee:
10.5% (46,276)
Number of households with income $20k - 30k:
Arlington:
18.2% (95)
State:
10.2% (45,072)
Number of households with income $30k - 40k:
Arlington:
1.3% (7)
Tennessee:
10.0% (43,885)
Number of households with income $40k - 50k:
Arlington:
0.0% (0)
State:
10.7% (47,267)
Number of households with income $50k - 60k:
Arlington:
0.0% (0)
State:
7.7% (33,868)
Number of households with income $60k - 75k:
Arlington:
4.8% (25)
Tennessee:
10.5% (46,247)
Number of households with income $75k - 100k:
Arlington:
9.8% (51)
Tennessee:
12.6% (55,465)
Number of households with income $100k - 125k:
Arlington:
14.1% (74)
Tennessee:
6.7% (29,515)
Number of households with income $125k - 150k:
Arlington:
14.9% (78)
State:
4.8% (21,306)
Number of households with income $150k - 200k:
Arlington:
16.3% (85)
Tennessee:
4.6% (20,425)
Number of households with income > $200k:
Arlington:
16.4% (86)
State:
2.5% (11,183)
Aggregate household income in Arlington in 2022: $72,855,466
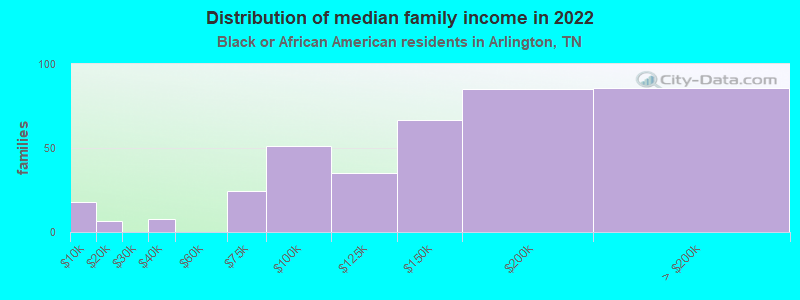
Median family income in Arlington in 2022:
Arlington:
$154,158
Tennessee:
$61,153
Number of families with income < $10k:
Arlington:
4.6% (18)
State:
7.9% (20,476)
Number of families with income $10k - 20k:
Arlington:
1.7% (7)
Tennessee:
6.0% (15,530)
Number of families with income $30k - 40k:
Arlington:
2.0% (8)
State:
9.3% (24,089)
Number of families with income $60k - 75k:
Arlington:
6.4% (24)
State:
11.6% (30,015)
Number of families with income $75k - 100k:
Arlington:
13.5% (51)
State:
14.7% (38,065)
Number of families with income $100k - 125k:
Arlington:
9.2% (35)
State:
8.8% (22,648)
Number of families with income $125k - 150k:
Arlington:
17.5% (67)
State:
6.1% (15,758)
Number of families with income $150k - 200k:
Arlington:
22.4% (85)
Tennessee:
6.4% (16,520)
Number of families with income > $200k:
Arlington:
22.6% (86)
Tennessee:
3.4% (8,711)
Median per capita income in Arlington in 2022:
Arlington:
$45,189
State:
$27,306
Income statistics for Asian residents
Number of households with income < $10k:
Arlington:
0.0% (0)
State:
2.8% (1,217)
Number of households with income $10k - 20k:
Arlington:
0.0% (0)
State:
2.5% (1,093)
Number of households with income $20k - 30k:
Arlington:
100.0% (14)
State:
4.1% (1,796)
Number of households with income $30k - 40k:
Arlington:
0.0% (0)
State:
9.6% (4,208)
Number of households with income $40k - 50k:
Arlington:
0.0% (0)
Tennessee:
5.5% (2,423)
Number of households with income $50k - 60k:
Arlington:
0.0% (0)
Tennessee:
7.5% (3,277)
Number of households with income $60k - 75k:
Arlington:
0.0% (0)
State:
10.3% (4,520)
Number of households with income $75k - 100k:
Arlington:
0.0% (0)
Tennessee:
9.0% (3,926)
Number of households with income $100k - 125k:
Arlington:
0.0% (0)
State:
8.4% (3,699)
Number of households with income $125k - 150k:
Arlington:
0.0% (0)
State:
8.0% (3,488)
Number of households with income $150k - 200k:
Arlington:
0.0% (0)
Tennessee:
12.0% (5,262)
Number of households with income > $200k:
Arlington:
0.0% (0)
Tennessee:
20.3% (8,903)
Aggregate household income in Arlington in 2022: $20,721,783
Median per capita income in Arlington in 2022:
Arlington:
$64,933
Tennessee:
$46,931
Change in median per capita income between 2000 and 2022:: -6.1%
Arlington, Tennessee:
-6.1%
Tennessee:
+130.8%
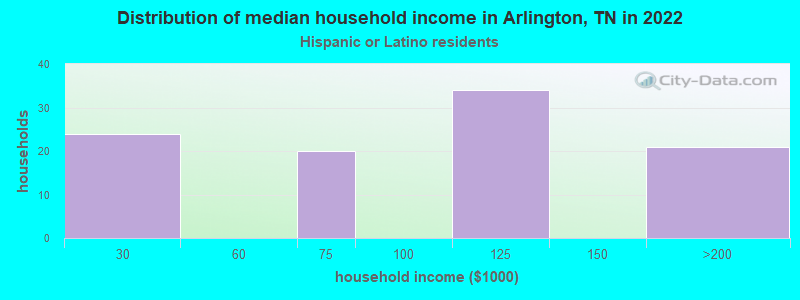
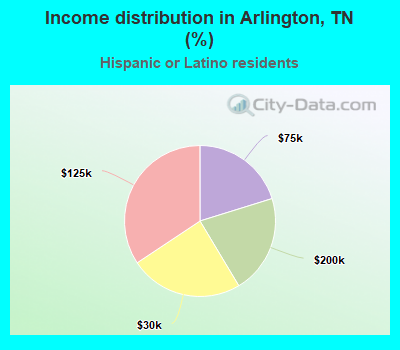
Income statistics for Hispanic or Latino residents
Number of households with income < $10k:
Arlington:
0.0% (0)
State:
7.2% (8,567)
Number of households with income $10k - 20k:
Arlington:
0.0% (0)
State:
6.4% (7,670)
Number of households with income $20k - 30k:
Arlington:
24.2% (24)
Tennessee:
9.4% (11,247)
Number of households with income $30k - 40k:
Arlington:
0.0% (0)
State:
10.1% (12,072)
Number of households with income $40k - 50k:
Arlington:
0.0% (0)
State:
10.0% (11,947)
Number of households with income $50k - 60k:
Arlington:
0.0% (0)
State:
8.0% (9,569)
Number of households with income $60k - 75k:
Arlington:
20.2% (20)
State:
10.3% (12,315)
Number of households with income $75k - 100k:
Arlington:
0.0% (0)
Tennessee:
15.3% (18,285)
Number of households with income $100k - 125k:
Arlington:
34.3% (34)
Tennessee:
8.3% (9,886)
Number of households with income $125k - 150k:
Arlington:
0.0% (0)
State:
5.9% (7,066)
Number of households with income $150k - 200k:
Arlington:
21.2% (21)
Tennessee:
4.9% (5,822)
Number of households with income > $200k:
Arlington:
0.0% (0)
Tennessee:
4.5% (5,337)
Aggregate household income in Arlington in 2022: $9,200,342
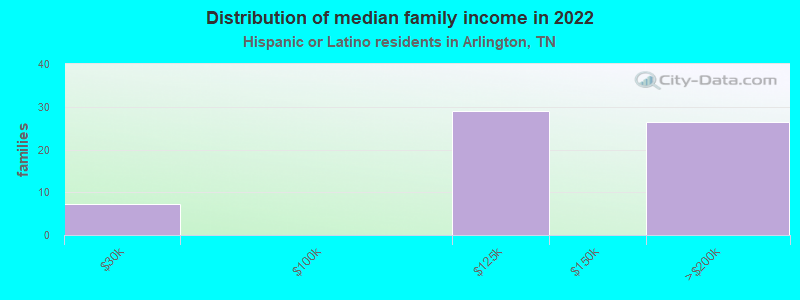
Median family income in Arlington in 2022:
Arlington:
$128,602
Tennessee:
$64,014
Number of families with income $20k - 30k:
Arlington:
11.7% (7)
State:
9.2% (8,233)
Number of families with income $100k - 125k:
Arlington:
46.2% (29)
Tennessee:
8.4% (7,480)
Number of families with income $150k - 200k:
Arlington:
42.1% (26)
State:
5.4% (4,817)
Median per capita income in Arlington in 2022:
Arlington:
$18,804
Tennessee:
$21,276
Change in median per capita income between 2000 and 2022:
Arlington, Tennessee:
+79.1%
State:
+76.0%
Income statistics for American Indian and Alaska Native residents
Median per capita income in Arlington in 2022:
Arlington:
$4,174
State:
$25,981
Change in median per capita income between 2000 and 2022:: -14.0%
Arlington, Tennessee:
-14.0%
Tennessee:
+40.2%
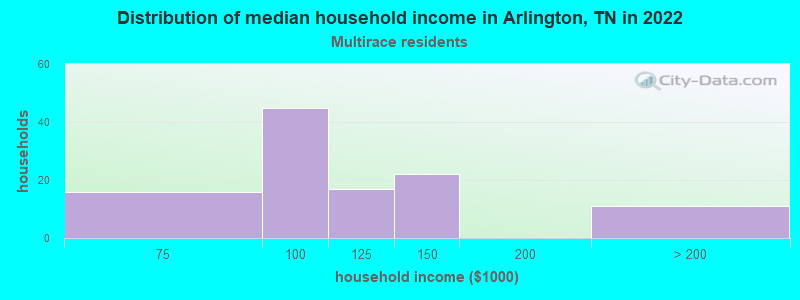
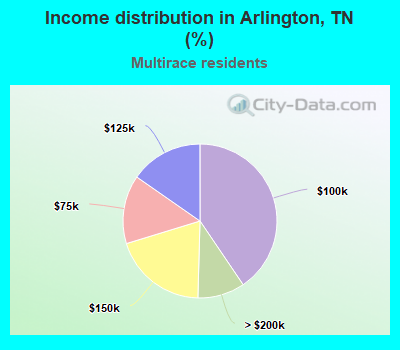
Income statistics for Multirace residents
Median household income in Arlington, TN in 2022:
Arlington:
$110,591
State:
$57,741
Change in median household income between 2000 and 2022:
Arlington, Tennessee:
+105.7%
State:
+87.1%
Number of households with income < $10k:
Arlington:
0.0% (0)
State:
6.7% (9,867)
Number of households with income $10k - 20k:
Arlington:
0.0% (0)
State:
8.6% (12,639)
Number of households with income $20k - 30k:
Arlington:
0.0% (0)
State:
9.2% (13,555)
Number of households with income $30k - 40k:
Arlington:
0.0% (0)
Tennessee:
10.3% (15,117)
Number of households with income $40k - 50k:
Arlington:
0.0% (0)
State:
9.4% (13,829)
Number of households with income $50k - 60k:
Arlington:
0.0% (0)
State:
7.5% (10,969)
Number of households with income $60k - 75k:
Arlington:
14.4% (16)
State:
9.2% (13,568)
Number of households with income $75k - 100k:
Arlington:
40.5% (45)
Tennessee:
12.6% (18,516)
Number of households with income $100k - 125k:
Arlington:
15.3% (17)
State:
8.6% (12,656)
Number of households with income $125k - 150k:
Arlington:
19.8% (22)
State:
5.9% (8,674)
Number of households with income $150k - 200k:
Arlington:
0.0% (0)
Tennessee:
7.2% (10,611)
Number of households with income > $200k:
Arlington:
9.9% (11)
State:
4.8% (6,986)
Aggregate household income in Arlington in 2022: $14,207,055
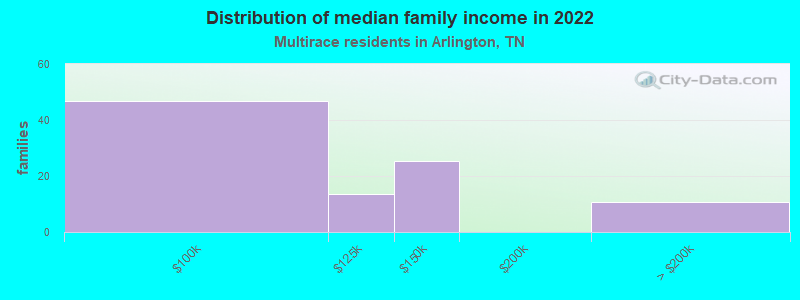
Median family income in Arlington in 2022:
Arlington:
$139,837
State:
$70,058
Number of families with income $75k - 100k:
Arlington:
48.5% (47)
Tennessee:
15.0% (14,413)
Number of families with income $100k - 125k:
Arlington:
14.0% (13)
Tennessee:
9.1% (8,743)
Number of families with income $125k - 150k:
Arlington:
26.2% (25)
State:
7.3% (7,035)
Number of families with income > $200k:
Arlington:
11.3% (11)
State:
6.2% (5,974)
Median per capita income in Arlington in 2022:
Arlington:
$22,370
State:
$24,436
Change in median per capita income between 2000 and 2022:
Arlington, Tennessee:
+48.3%
State:
+84.3%
Discuss Arlington, Tennessee (TN) on our hugely popular Tennessee forum.