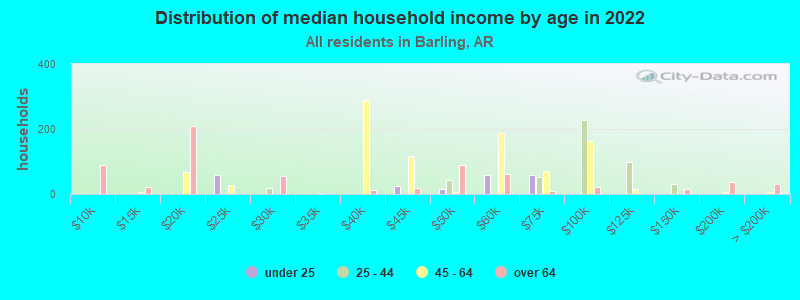
The median household income in Barling, AR in 2022 was $47,910, which was 15.7% less than the median annual income of $55,432 across the entire state of Arkansas. Compared to the median income of $37,605 in 2000 this represents an increase of 21.5%. The per capita income in 2022 was $30,445, which means an increase of 45.9% compared to 2000 when it was $16,485.
Whole page based on the data from 2000 / 2022 when the population of Barling, Arkansas was 4,176 / 4,866
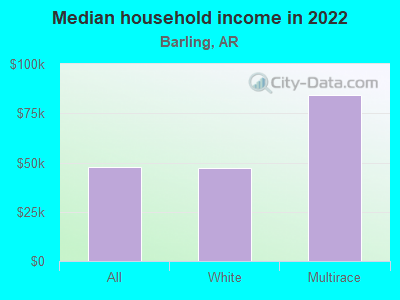
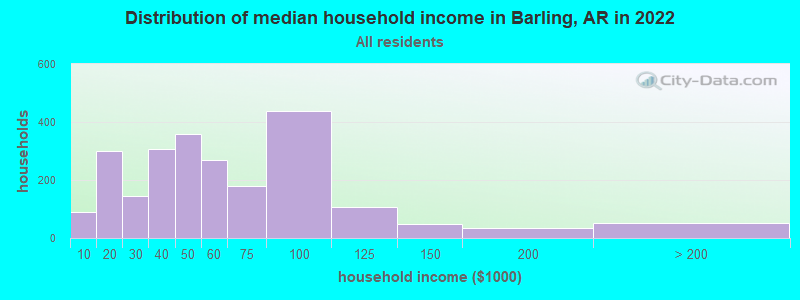
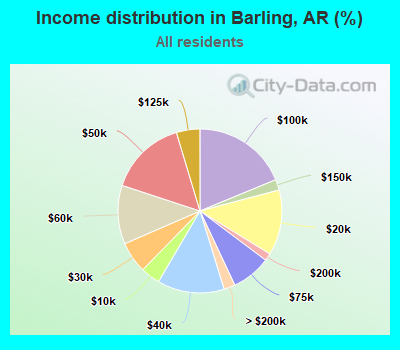
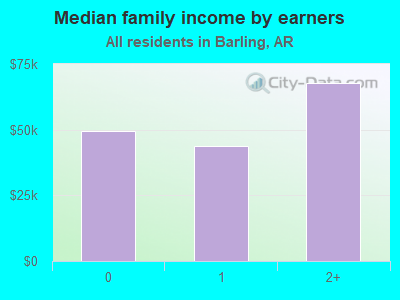
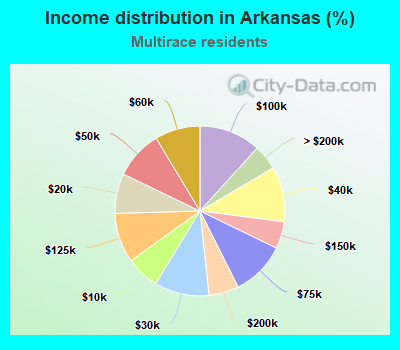
Income statistics for all residents
Median household income in Barling, AR in 2022:
Barling:
$47,911
State:
$55,432
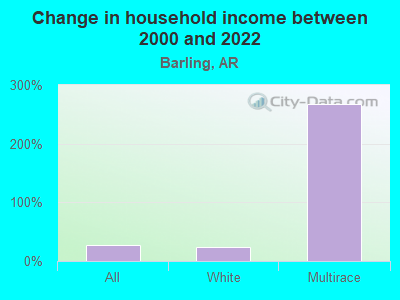
Change in median household income between 2000 and 2022:
Barling, Arkansas:
+27.4%
State:
+72.2%
Number of households with income < $10k:
Barling:
3.9% (90)
State:
7.3% (88,467)
Number of households with income $10k - 20k:
Barling:
12.9% (301)
State:
10.6% (128,341)
Number of households with income $20k - 30k:
Barling:
6.2% (144)
State:
9.3% (113,436)
Number of households with income $30k - 40k:
Barling:
13.2% (308)
State:
9.5% (114,963)
Number of households with income $40k - 50k:
Barling:
15.3% (357)
Arkansas:
8.7% (105,305)
Number of households with income $50k - 60k:
Barling:
11.6% (270)
Arkansas:
7.8% (94,354)
Number of households with income $60k - 75k:
Barling:
7.8% (181)
State:
10.3% (125,593)
Number of households with income $75k - 100k:
Barling:
18.8% (438)
State:
12.6% (153,830)
Number of households with income $100k - 125k:
Barling:
4.6% (108)
State:
8.3% (101,209)
Number of households with income $125k - 150k:
Barling:
2.1% (49)
State:
5.1% (61,560)
Number of households with income $150k - 200k:
Barling:
1.5% (34)
State:
5.1% (62,566)
Number of households with income > $200k:
Barling:
2.2% (52)
Arkansas:
5.5% (66,583)
Aggregate household income in Barling in 2022: $140,987,885
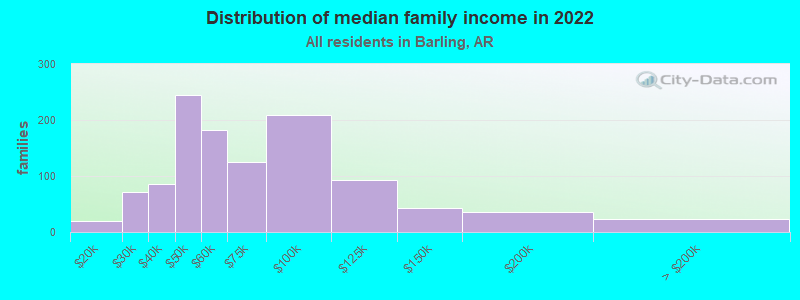
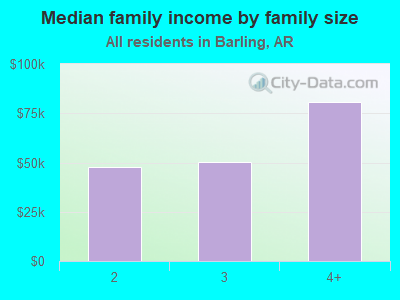
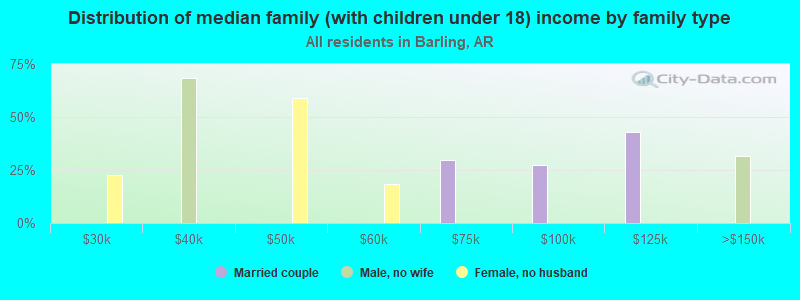
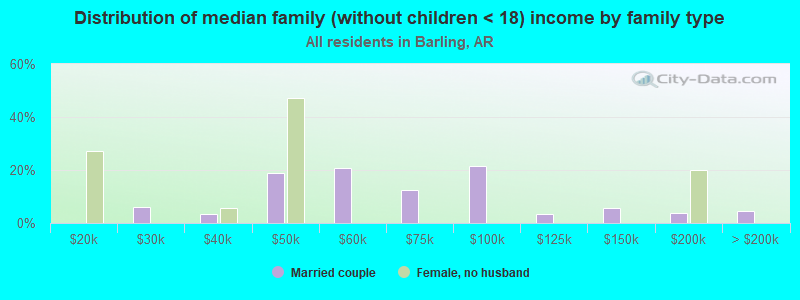
Median family income in Barling in 2022:
Barling:
$56,101
State:
$70,708
Number of families with income $10k - 20k:
Barling:
1.8% (20)
State:
5.2% (40,127)
Number of families with income $20k - 30k:
Barling:
6.3% (71)
State:
7.1% (55,246)
Number of families with income $30k - 40k:
Barling:
7.6% (86)
State:
8.3% (64,733)
Number of families with income $40k - 50k:
Barling:
21.6% (245)
Arkansas:
8.5% (66,171)
Number of families with income $50k - 60k:
Barling:
16.0% (182)
Arkansas:
7.8% (60,533)
Number of families with income $60k - 75k:
Barling:
11.0% (125)
Arkansas:
11.3% (87,716)
Number of families with income $75k - 100k:
Barling:
18.4% (209)
Arkansas:
15.4% (119,552)
Number of families with income $100k - 125k:
Barling:
8.1% (92)
State:
10.7% (83,139)
Number of families with income $125k - 150k:
Barling:
3.8% (43)
Arkansas:
6.9% (53,320)
Number of families with income $150k - 200k:
Barling:
3.2% (36)
State:
7.0% (54,640)
Number of families with income > $200k:
Barling:
2.2% (24)
State:
7.4% (57,743)
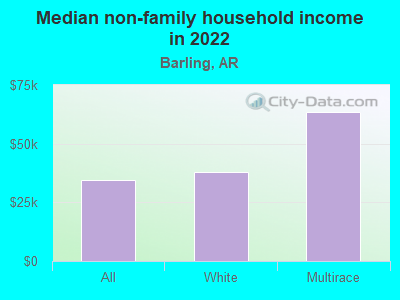
Median non-family income in Barling in 2022:
Barling:
$34,494
Arkansas:
$31,230
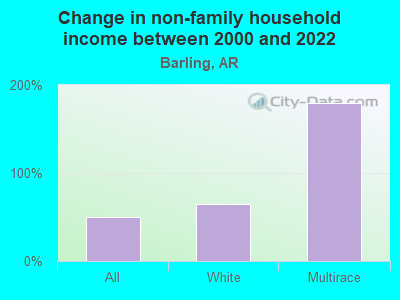
Change in median non-family income between 2000 and 2022:
Barling, Arkansas:
+49.5%
Arkansas:
+73.5%
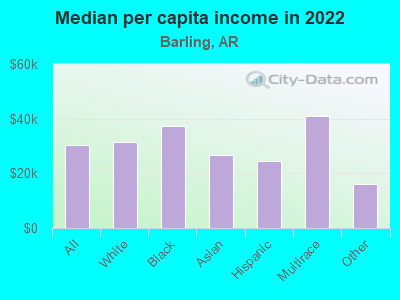
Median per capita income in Barling in 2022:
Barling:
$30,445
State:
$31,380
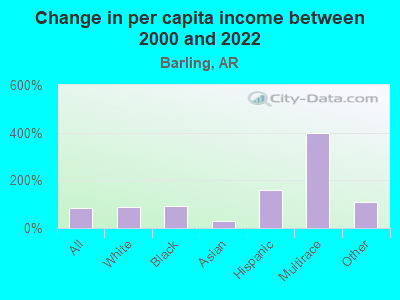
Change in median per capita income between 2000 and 2022:
Barling, Arkansas:
+84.7%
State:
+85.6%
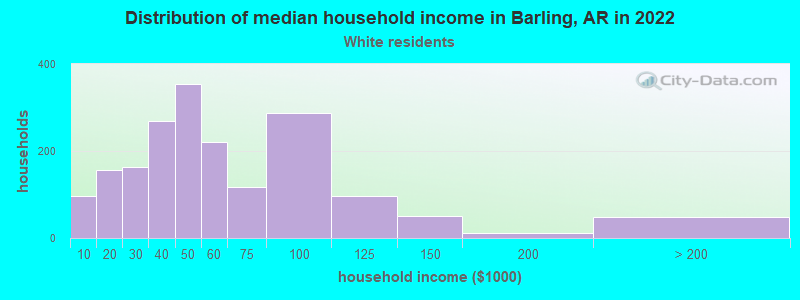
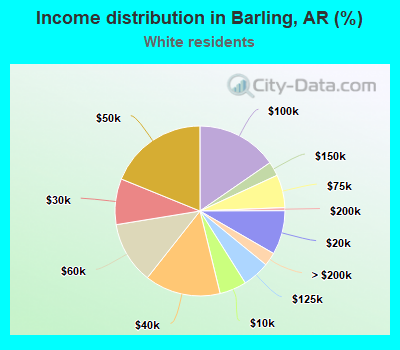
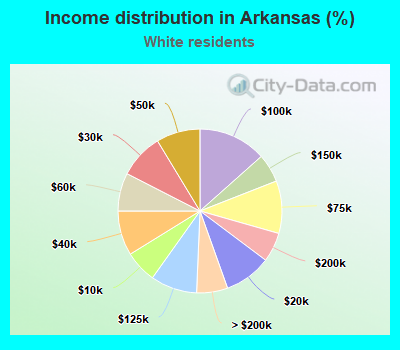
Income statistics for White residents
Median household income in Barling, AR in 2022:
Barling:
$47,175
State:
$60,595
Change in median household income between 2000 and 2022:
Barling, Arkansas:
+24.1%
State:
+75.1%
Number of households with income < $10k:
Barling:
5.1% (96)
Arkansas:
6.3% (55,696)
Number of households with income $10k - 20k:
Barling:
8.4% (157)
State:
9.3% (81,739)
Number of households with income $20k - 30k:
Barling:
8.7% (163)
Arkansas:
8.8% (77,378)
Number of households with income $30k - 40k:
Barling:
14.4% (270)
State:
8.8% (77,496)
Number of households with income $40k - 50k:
Barling:
18.9% (353)
Arkansas:
8.7% (76,115)
Number of households with income $50k - 60k:
Barling:
11.8% (221)
Arkansas:
7.5% (66,259)
Number of households with income $60k - 75k:
Barling:
6.2% (117)
State:
10.4% (91,072)
Number of households with income $75k - 100k:
Barling:
15.4% (288)
Arkansas:
13.4% (118,116)
Number of households with income $100k - 125k:
Barling:
5.2% (97)
State:
9.2% (80,719)
Number of households with income $125k - 150k:
Barling:
2.7% (51)
State:
5.6% (49,507)
Number of households with income $150k - 200k:
Barling:
0.6% (11)
State:
5.8% (51,161)
Number of households with income > $200k:
Barling:
2.6% (48)
State:
6.1% (53,810)
Aggregate household income in Barling in 2022: $114,124,807
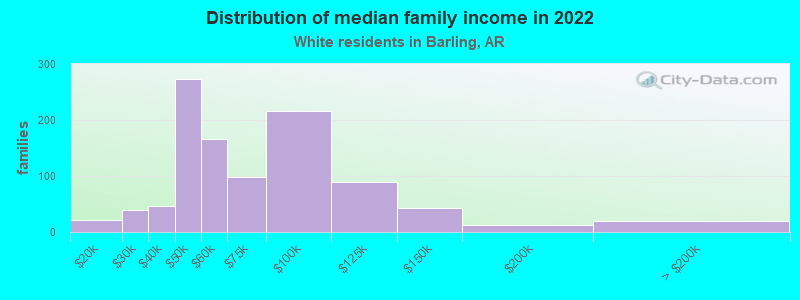
Median family income in Barling in 2022:
Barling:
$59,043
State:
$77,061
Number of families with income $10k - 20k:
Barling:
2.1% (22)
State:
4.3% (24,477)
Number of families with income $20k - 30k:
Barling:
3.9% (40)
Arkansas:
6.5% (37,010)
Number of families with income $30k - 40k:
Barling:
4.6% (47)
Arkansas:
7.4% (42,177)
Number of families with income $40k - 50k:
Barling:
26.6% (273)
State:
8.0% (45,722)
Number of families with income $50k - 60k:
Barling:
16.2% (166)
State:
7.3% (41,667)
Number of families with income $60k - 75k:
Barling:
9.6% (98)
Arkansas:
11.0% (63,207)
Number of families with income $75k - 100k:
Barling:
21.0% (216)
State:
16.2% (92,829)
Number of families with income $100k - 125k:
Barling:
8.8% (90)
State:
11.7% (66,707)
Number of families with income $125k - 150k:
Barling:
4.1% (43)
State:
7.7% (44,225)
Number of families with income $150k - 200k:
Barling:
1.2% (12)
State:
7.9% (45,398)
Number of families with income > $200k:
Barling:
1.9% (19)
State:
8.3% (47,690)
Median non-family income in Barling in 2022:
Barling:
$38,087
Arkansas:
$33,651
Change in median non-family income between 2000 and 2022:
Barling, Arkansas:
+65.4%
Arkansas:
+75.3%
Median per capita income in Barling in 2022:
Barling:
$31,626
State:
$34,985
Change in median per capita income between 2000 and 2022:
Barling, Arkansas:
+87.5%
State:
+89.9%
Income statistics for Black or African American residents
Aggregate household income in Barling in 2022: $1,920,602
Median per capita income in Barling in 2022:
Barling:
$37,143
State:
$22,000
Change in median per capita income between 2000 and 2022:
Barling, Arkansas:
+93.4%
State:
+107.9%
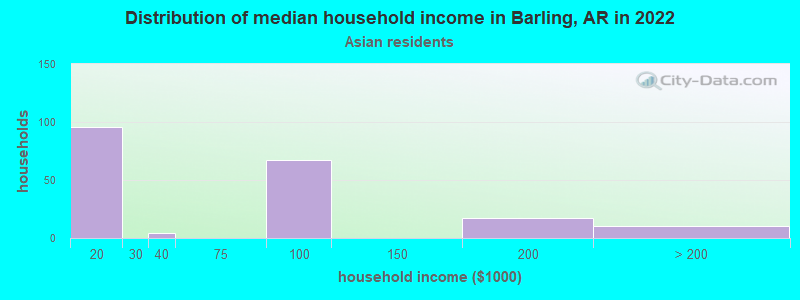
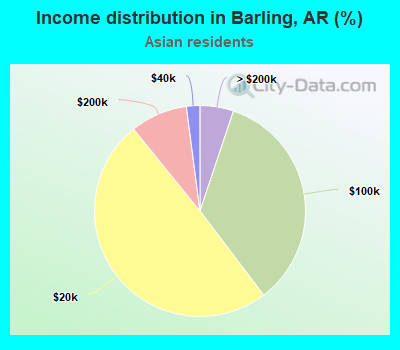
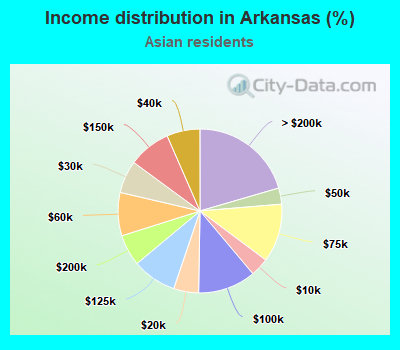
Income statistics for Asian residents
Number of households with income < $10k:
Barling:
0.0% (0)
State:
3.7% (601)
Number of households with income $10k - 20k:
Barling:
49.5% (96)
State:
4.9% (813)
Number of households with income $20k - 30k:
Barling:
0.0% (0)
Arkansas:
6.4% (1,057)
Number of households with income $30k - 40k:
Barling:
2.1% (4)
State:
6.6% (1,077)
Number of households with income $40k - 50k:
Barling:
0.0% (0)
Arkansas:
3.2% (523)
Number of households with income $50k - 60k:
Barling:
0.0% (0)
State:
8.5% (1,401)
Number of households with income $60k - 75k:
Barling:
0.0% (0)
State:
11.5% (1,895)
Number of households with income $75k - 100k:
Barling:
34.5% (67)
Arkansas:
11.4% (1,875)
Number of households with income $100k - 125k:
Barling:
0.0% (0)
Arkansas:
8.7% (1,435)
Number of households with income $125k - 150k:
Barling:
0.0% (0)
Arkansas:
8.4% (1,377)
Number of households with income $150k - 200k:
Barling:
8.8% (17)
State:
6.2% (1,017)
Number of households with income > $200k:
Barling:
5.2% (10)
Arkansas:
20.5% (3,371)
Aggregate household income in Barling in 2022: $6,060,460
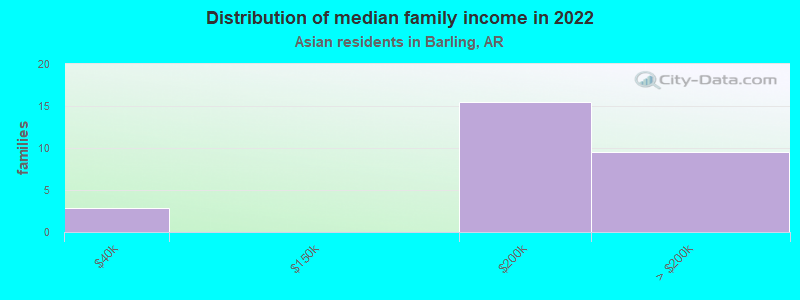
Median family income in Barling in 2022:
Barling:
$109,780
State:
$106,214
Number of families with income $30k - 40k:
Barling:
10.3% (3)
Arkansas:
5.7% (640)
Number of families with income $150k - 200k:
Barling:
55.4% (15)
State:
7.4% (826)
Number of families with income > $200k:
Barling:
34.3% (10)
Arkansas:
25.8% (2,880)
Median per capita income in Barling in 2022:
Barling:
$26,695
State:
$42,828
Change in median per capita income between 2000 and 2022:
Barling, Arkansas:
+28.2%
State:
+159.7%
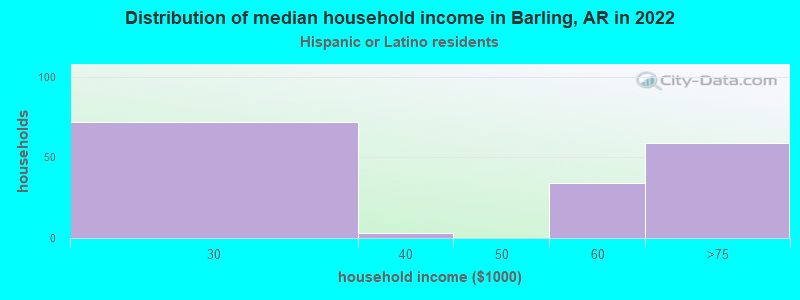
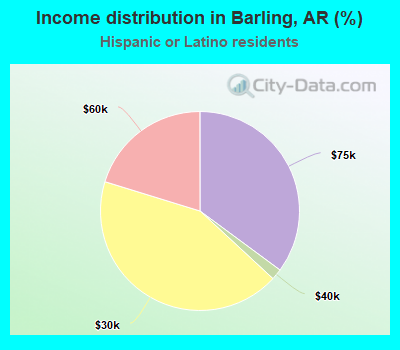
Income statistics for Hispanic or Latino residents
Number of households with income < $10k:
Barling:
0.0% (0)
State:
7.0% (4,903)
Number of households with income $10k - 20k:
Barling:
0.0% (0)
State:
6.4% (4,496)
Number of households with income $20k - 30k:
Barling:
42.9% (72)
State:
10.0% (6,963)
Number of households with income $30k - 40k:
Barling:
1.8% (3)
Arkansas:
12.2% (8,492)
Number of households with income $40k - 50k:
Barling:
0.0% (0)
Arkansas:
8.9% (6,213)
Number of households with income $50k - 60k:
Barling:
20.2% (34)
State:
9.2% (6,437)
Number of households with income $60k - 75k:
Barling:
35.1% (59)
State:
13.4% (9,354)
Number of households with income $75k - 100k:
Barling:
0.0% (0)
State:
13.5% (9,432)
Number of households with income $100k - 125k:
Barling:
0.0% (0)
State:
8.7% (6,040)
Number of households with income $125k - 150k:
Barling:
0.0% (0)
State:
4.3% (3,001)
Number of households with income $150k - 200k:
Barling:
0.0% (0)
Arkansas:
2.9% (2,023)
Number of households with income > $200k:
Barling:
0.0% (0)
Arkansas:
3.4% (2,381)
Aggregate household income in Barling in 2022: $7,212,290
Median per capita income in Barling in 2022:
Barling:
$24,504
State:
$20,128
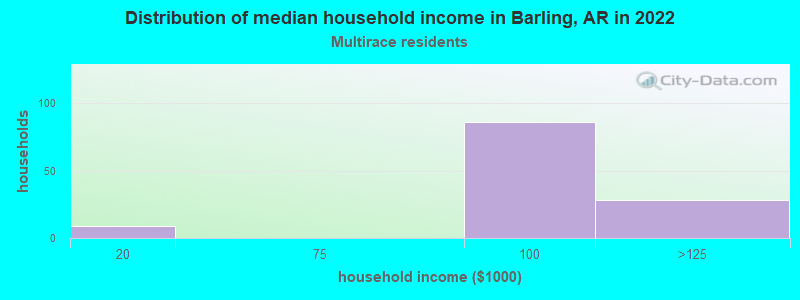
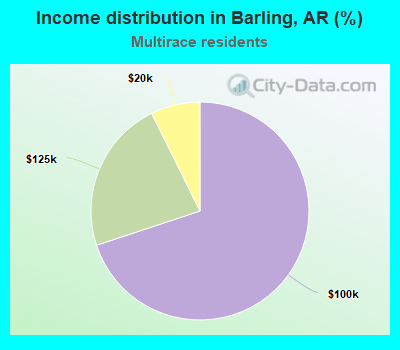
Income statistics for Multirace residents
Median household income in Barling, AR in 2022:
Barling:
$84,302
Arkansas:
$55,609
Number of households with income < $10k:
Barling:
0.0% (0)
State:
6.3% (6,303)
Number of households with income $10k - 20k:
Barling:
7.3% (9)
State:
7.6% (7,548)
Number of households with income $20k - 30k:
Barling:
0.0% (0)
Arkansas:
10.4% (10,340)
Number of households with income $30k - 40k:
Barling:
0.0% (0)
Arkansas:
10.5% (10,444)
Number of households with income $40k - 50k:
Barling:
0.0% (0)
Arkansas:
9.2% (9,176)
Number of households with income $50k - 60k:
Barling:
0.0% (0)
Arkansas:
8.6% (8,560)
Number of households with income $60k - 75k:
Barling:
0.0% (0)
State:
10.4% (10,351)
Number of households with income $75k - 100k:
Barling:
69.9% (86)
State:
11.7% (11,670)
Number of households with income $100k - 125k:
Barling:
22.8% (28)
Arkansas:
9.5% (9,424)
Number of households with income $125k - 150k:
Barling:
0.0% (0)
State:
5.2% (5,120)
Number of households with income $150k - 200k:
Barling:
0.0% (0)
State:
5.7% (5,665)
Number of households with income > $200k:
Barling:
0.0% (0)
State:
4.8% (4,770)
Aggregate household income in Barling in 2022: $14,274,438
Median non-family income in Barling in 2022:
Barling:
$63,450
State:
$34,567
Median per capita income in Barling in 2022:
Barling:
$41,023
Arkansas:
$23,635
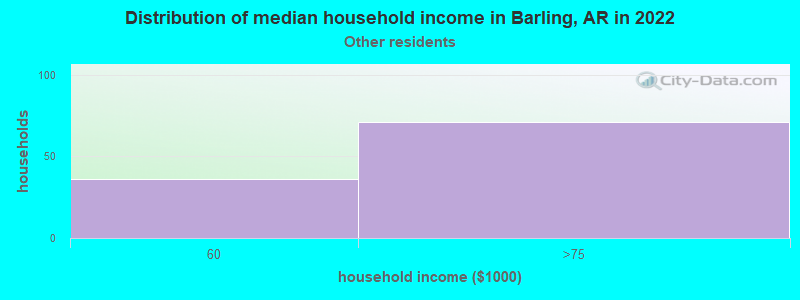
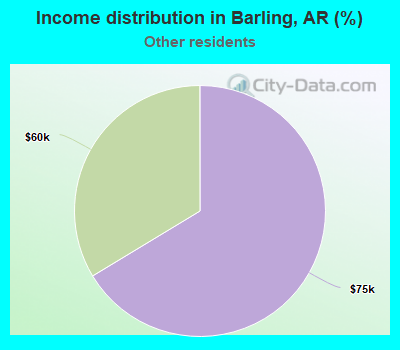
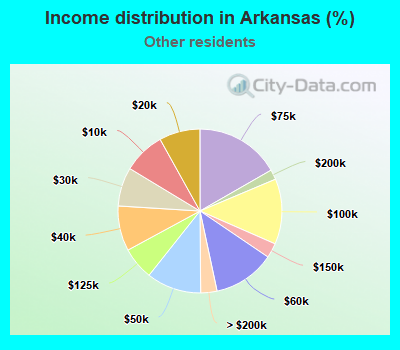
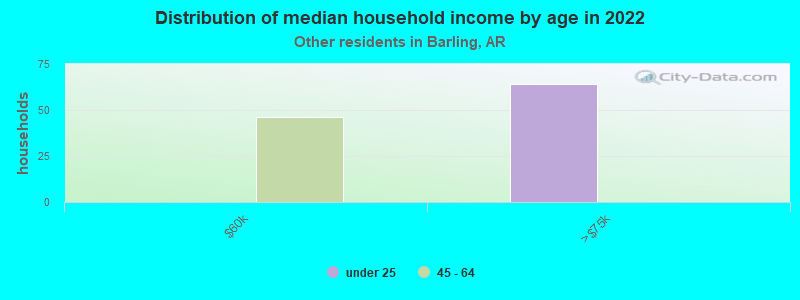
Income statistics for other residents
Number of households with income < $10k:
Barling:
0.0% (0)
Arkansas:
8.3% (2,184)
Number of households with income $10k - 20k:
Barling:
0.0% (0)
State:
8.1% (2,135)
Number of households with income $20k - 30k:
Barling:
0.0% (0)
Arkansas:
7.7% (2,025)
Number of households with income $30k - 40k:
Barling:
0.0% (0)
Arkansas:
8.9% (2,350)
Number of households with income $40k - 50k:
Barling:
0.0% (0)
Arkansas:
10.8% (2,857)
Number of households with income $50k - 60k:
Barling:
33.6% (36)
State:
12.2% (3,220)
Number of households with income $60k - 75k:
Barling:
66.4% (71)
Arkansas:
16.7% (4,415)
Number of households with income $75k - 100k:
Barling:
0.0% (0)
State:
12.9% (3,411)
Number of households with income $100k - 125k:
Barling:
0.0% (0)
Arkansas:
6.4% (1,697)
Number of households with income $125k - 150k:
Barling:
0.0% (0)
State:
2.9% (768)
Number of households with income $150k - 200k:
Barling:
0.0% (0)
State:
2.0% (520)
Number of households with income > $200k:
Barling:
0.0% (0)
Arkansas:
3.2% (847)
Aggregate household income in Barling in 2022: $9,074,522
Median per capita income in Barling in 2022:
Barling:
$15,972
State:
$20,131
Change in median per capita income between 2000 and 2022:
Barling, Arkansas:
+108.0%
State:
+128.6%
Discuss Barling, Arkansas (AR) on our hugely popular Arkansas forum.