Brazosport, Texas (TX) income map, earnings map, and wages data
The median household income in Brazosport, TX in 2022 was $74,965, which was 3.6% greater than the median annual income of $72,284 across the entire state of Texas. Compared to the median income of $42,351 in 2000 this represents an increase of 43.5%. The per capita income in 2022 was $36,701, which means an increase of 47.6% compared to 2000 when it was $19,221.
Income statistics for all residents
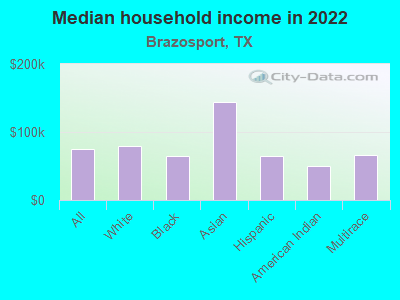
Median household income in Brazosport, TX in 2022:| Brazosport: | $74,965 |
| Texas: | $72,284 |
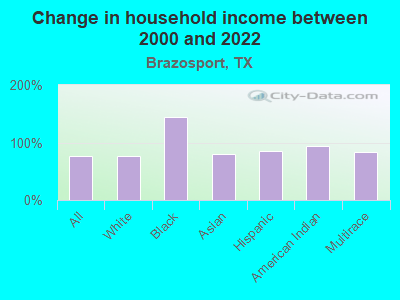
Change in median household income between 2000 and 2022:| Brazosport, Texas: | +77.0% |
| State: | +81.0% |
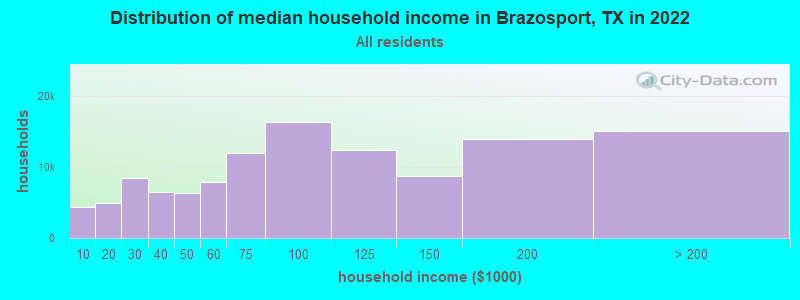
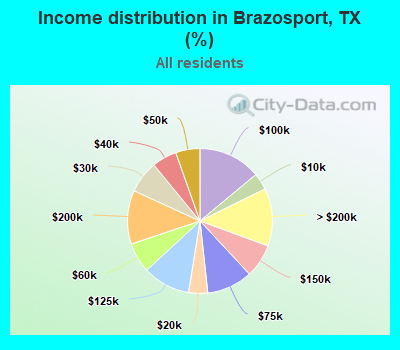
Number of households with income < $10k:| Brazosport: | 3.7% (4,359) |
| State: | 5.5% (611,011) |
Number of households with income $10k - 20k:| Brazosport: | 4.3% (4,976) |
| State: | 6.7% (743,157) |
Number of households with income $20k - 30k:| Brazosport: | 7.2% (8,403) |
| State: | 7.2% (803,381) |
Number of households with income $30k - 40k:| Brazosport: | 5.5% (6,447) |
| State: | 7.8% (866,080) |
Number of households with income $40k - 50k:| Brazosport: | 5.4% (6,312) |
| State: | 7.3% (810,440) |
Number of households with income $50k - 60k:| Brazosport: | 6.7% (7,835) |
| State: | 7.2% (799,783) |
Number of households with income $60k - 75k:| Brazosport: | 10.2% (11,873) |
| State: | 9.9% (1,095,384) |
Number of households with income $75k - 100k:| Brazosport: | 14.0% (16,285) |
| Texas: | 12.8% (1,419,057) |
Number of households with income $100k - 125k:| Brazosport: | 10.6% (12,352) |
| State: | 9.5% (1,054,577) |
Number of households with income $125k - 150k:| Brazosport: | 7.5% (8,722) |
| State: | 6.7% (741,518) |
Number of households with income $150k - 200k:| Brazosport: | 12.0% (13,968) |
| State: | 8.7% (961,776) |
Number of households with income > $200k:| Brazosport: | 12.9% (15,048) |
| State: | 10.7% (1,181,544) |
Aggregate household income in Brazosport in 2022: $7,740,773,787
Median family income in Brazosport in 2022:| Brazosport: | $86,876 |
| State: | $86,267 |
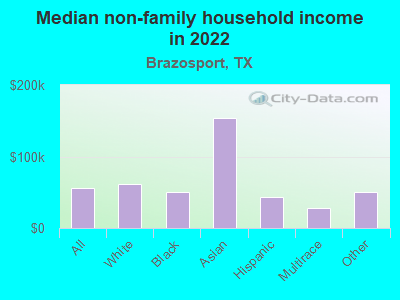
Median non-family income in Brazosport in 2022:| Brazosport: | $56,257 |
| State: | $45,999 |
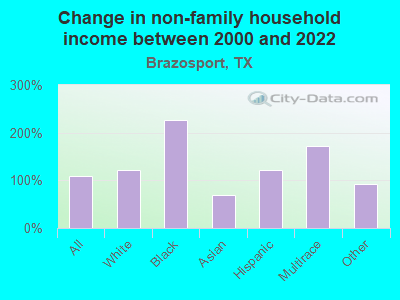
Change in median non-family income between 2000 and 2022:| Brazosport, Texas: | +109.7% |
| Texas: | +79.5% |
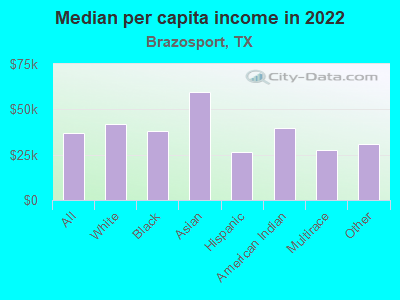
Median per capita income in Brazosport in 2022:| Brazosport: | $36,701 |
| Texas: | $38,123 |
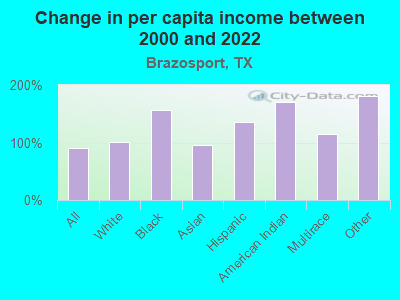
Change in median per capita income between 2000 and 2022:| Brazosport, Texas: | +90.9% |
| State: | +94.3% |
Income statistics for White residents
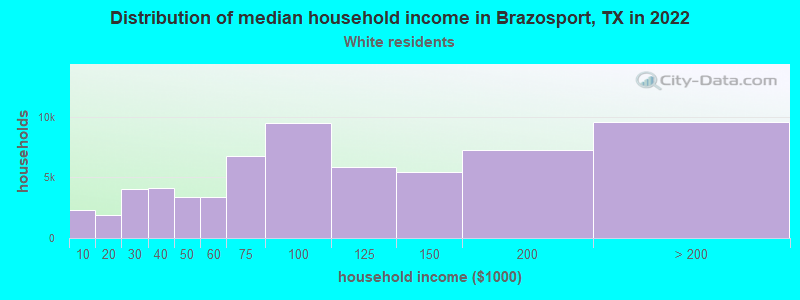
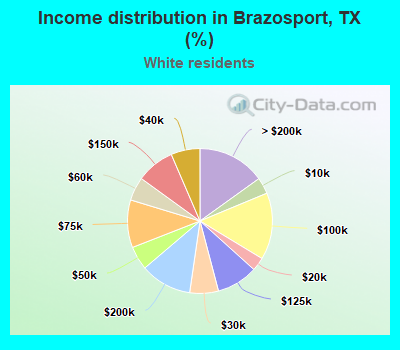
Median household income in Brazosport, TX in 2022:| Brazosport: | $79,791 |
| State: | $82,032 |
Change in median household income between 2000 and 2022:| Brazosport, Texas: | +75.8% |
| State: | +91.0% |
Number of households with income < $10k:| Brazosport: | 3.7% (2,328) |
| Texas: | 4.7% (273,716) |
Number of households with income $10k - 20k:| Brazosport: | 3.0% (1,913) |
| State: | 5.5% (322,702) |
Number of households with income $20k - 30k:| Brazosport: | 6.4% (4,056) |
| Texas: | 6.2% (363,947) |
Number of households with income $30k - 40k:| Brazosport: | 6.5% (4,106) |
| Texas: | 6.8% (399,275) |
Number of households with income $40k - 50k:| Brazosport: | 5.3% (3,357) |
| State: | 6.5% (383,417) |
Number of households with income $50k - 60k:| Brazosport: | 5.3% (3,354) |
| State: | 6.6% (388,535) |
Number of households with income $60k - 75k:| Brazosport: | 10.6% (6,746) |
| State: | 9.7% (566,295) |
Number of households with income $75k - 100k:| Brazosport: | 14.9% (9,471) |
| State: | 13.0% (760,276) |
Number of households with income $100k - 125k:| Brazosport: | 9.2% (5,852) |
| Texas: | 10.2% (597,596) |
Number of households with income $125k - 150k:| Brazosport: | 8.5% (5,424) |
| Texas: | 7.4% (436,830) |
Number of households with income $150k - 200k:| Brazosport: | 11.5% (7,289) |
| Texas: | 9.9% (583,067) |
Number of households with income > $200k:| Brazosport: | 15.1% (9,569) |
| State: | 13.5% (792,647) |
Aggregate household income in Brazosport in 2022: $3,654,236,390
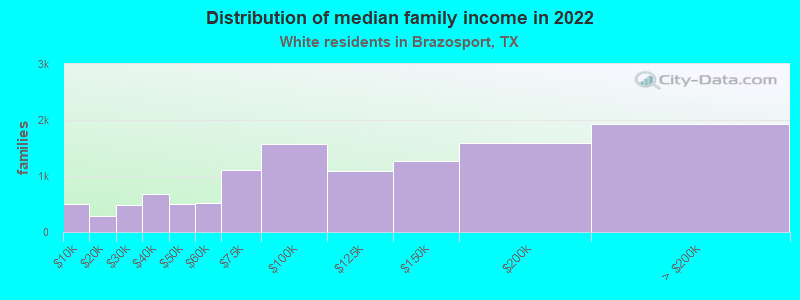
Median family income in Brazosport in 2022:| Brazosport: | $94,296 |
| State: | $101,788 |
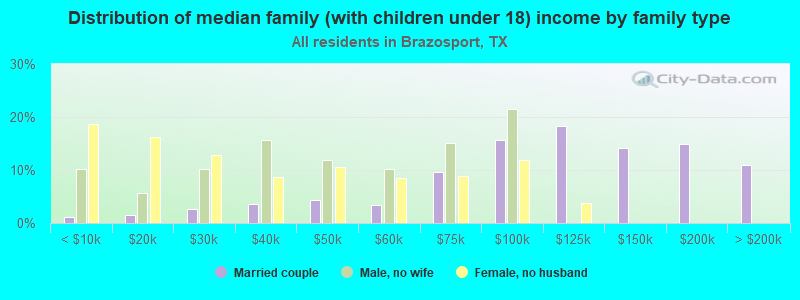
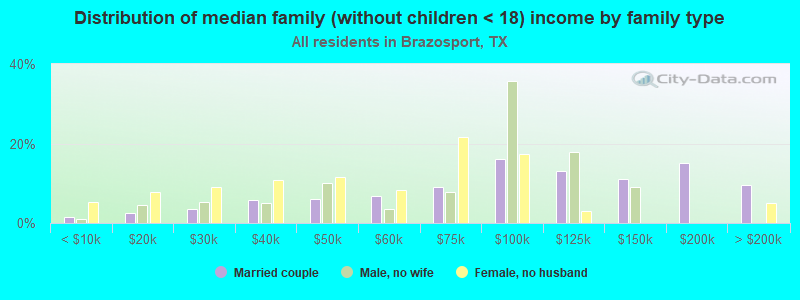
Number of families with income < $10k:| Brazosport: | 4.3% (495) |
| State: | 2.8% (108,142) |
Number of families with income $10k - 20k:| Brazosport: | 2.4% (278) |
| State: | 2.9% (113,421) |
Number of families with income $20k - 30k:| Brazosport: | 4.2% (482) |
| State: | 4.1% (157,688) |
Number of families with income $30k - 40k:| Brazosport: | 5.9% (676) |
| Texas: | 5.2% (198,847) |
Number of families with income $40k - 50k:| Brazosport: | 4.3% (496) |
| State: | 5.6% (216,490) |
Number of families with income $50k - 60k:| Brazosport: | 4.5% (521) |
| Texas: | 5.7% (220,689) |
Number of families with income $60k - 75k:| Brazosport: | 9.7% (1,115) |
| Texas: | 9.0% (346,106) |
Number of families with income $75k - 100k:| Brazosport: | 13.6% (1,565) |
| Texas: | 13.7% (527,363) |
Number of families with income $100k - 125k:| Brazosport: | 9.5% (1,091) |
| Texas: | 11.6% (448,411) |
Number of families with income $125k - 150k:| Brazosport: | 11.0% (1,264) |
| State: | 9.2% (355,798) |
Number of families with income $150k - 200k:| Brazosport: | 13.8% (1,587) |
| State: | 12.5% (480,185) |
Number of families with income > $200k:| Brazosport: | 16.7% (1,925) |
| Texas: | 17.6% (677,490) |
Median non-family income in Brazosport in 2022:| Brazosport: | $61,626 |
| Texas: | $50,587 |
Change in median non-family income between 2000 and 2022:| Brazosport, Texas: | +121.8% |
| State: | +87.7% |
Median per capita income in Brazosport in 2022:| Brazosport: | $42,182 |
| State: | $47,740 |
Change in median per capita income between 2000 and 2022:| Brazosport, Texas: | +101.1% |
| State: | +114.3% |
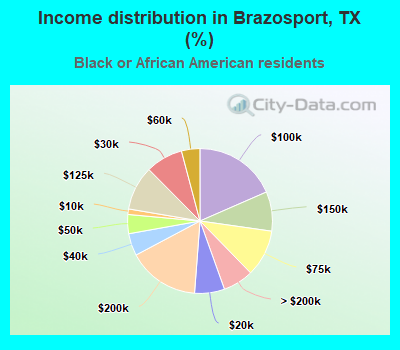
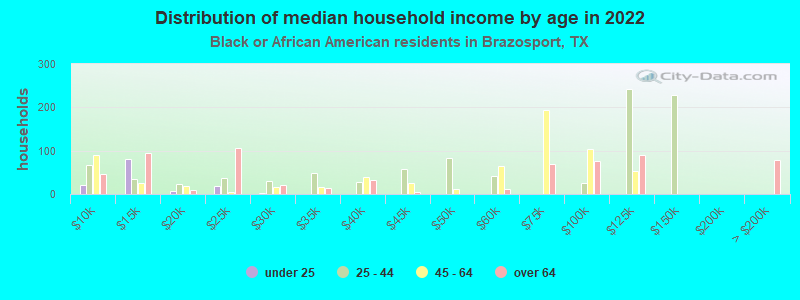
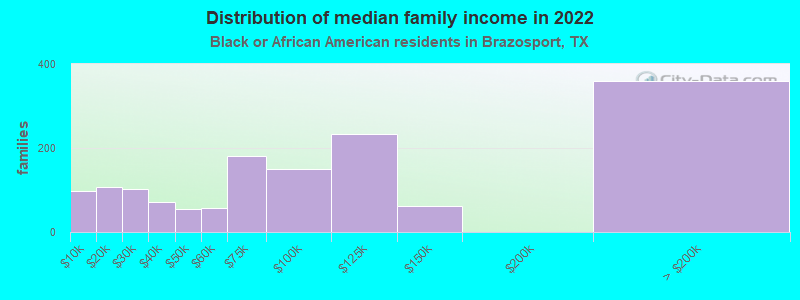
Income statistics for Black or African American residents
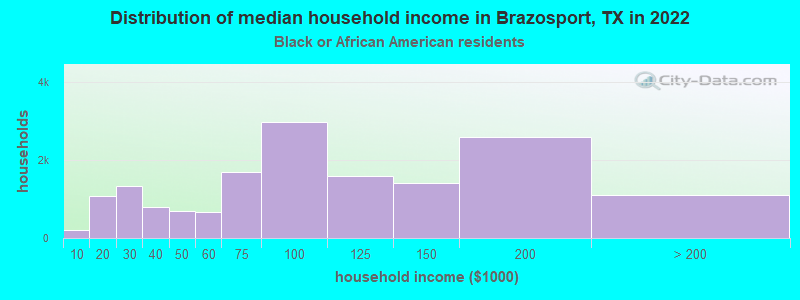
Median household income in Brazosport, TX in 2022:| Brazosport: | $64,850 |
| State: | $55,759 |
Change in median household income between 2000 and 2022:| Brazosport, Texas: | +145.1% |
| State: | +90.3% |
Number of households with income < $10k:| Brazosport: | 1.2% (198) |
| State: | 8.9% (126,378) |
Number of households with income $10k - 20k:| Brazosport: | 6.7% (1,074) |
| Texas: | 9.9% (140,369) |
Number of households with income $20k - 30k:| Brazosport: | 8.3% (1,338) |
| State: | 8.5% (120,639) |
Number of households with income $30k - 40k:| Brazosport: | 5.0% (797) |
| State: | 9.7% (137,517) |
Number of households with income $40k - 50k:| Brazosport: | 4.3% (687) |
| State: | 8.0% (112,973) |
Number of households with income $50k - 60k:| Brazosport: | 4.1% (661) |
| Texas: | 8.3% (117,156) |
Number of households with income $60k - 75k:| Brazosport: | 10.4% (1,680) |
| State: | 10.4% (147,462) |
Number of households with income $75k - 100k:| Brazosport: | 18.5% (2,968) |
| Texas: | 11.5% (162,718) |
Number of households with income $100k - 125k:| Brazosport: | 9.9% (1,589) |
| State: | 8.2% (115,829) |
Number of households with income $125k - 150k:| Brazosport: | 8.8% (1,416) |
| Texas: | 4.9% (69,556) |
Number of households with income $150k - 200k:| Brazosport: | 16.0% (2,575) |
| State: | 6.4% (90,701) |
Number of households with income > $200k:| Brazosport: | 6.8% (1,097) |
| State: | 5.5% (77,988) |
Aggregate household income in Brazosport in 2022: $446,480,723
Median family income in Brazosport in 2022:| Brazosport: | $68,283 |
| Texas: | $69,134 |
Number of families with income < $10k:| Brazosport: | 6.6% (97) |
| State: | 6.8% (55,625) |
Number of families with income $10k - 20k:| Brazosport: | 7.2% (106) |
| State: | 6.8% (55,300) |
Number of families with income $20k - 30k:| Brazosport: | 6.9% (102) |
| Texas: | 7.1% (57,877) |
Number of families with income $30k - 40k:| Brazosport: | 4.9% (72) |
| State: | 8.5% (68,776) |
Number of families with income $40k - 50k:| Brazosport: | 3.7% (55) |
| Texas: | 7.1% (57,907) |
Number of families with income $50k - 60k:| Brazosport: | 3.8% (56) |
| State: | 7.3% (59,511) |
Number of families with income $60k - 75k:| Brazosport: | 12.3% (181) |
| Texas: | 10.1% (81,994) |
Number of families with income $75k - 100k:| Brazosport: | 10.2% (150) |
| State: | 12.7% (103,723) |
Number of families with income $100k - 125k:| Brazosport: | 15.9% (234) |
| State: | 9.4% (76,609) |
Number of families with income $125k - 150k:| Brazosport: | 4.3% (63) |
| Texas: | 6.8% (55,615) |
Number of families with income > $200k:| Brazosport: | 24.3% (359) |
| State: | 7.9% (64,439) |
Median non-family income in Brazosport in 2022:| Brazosport: | $50,975 |
| State: | $40,133 |
Median per capita income in Brazosport in 2022:| Brazosport: | $37,991 |
| State: | $30,490 |
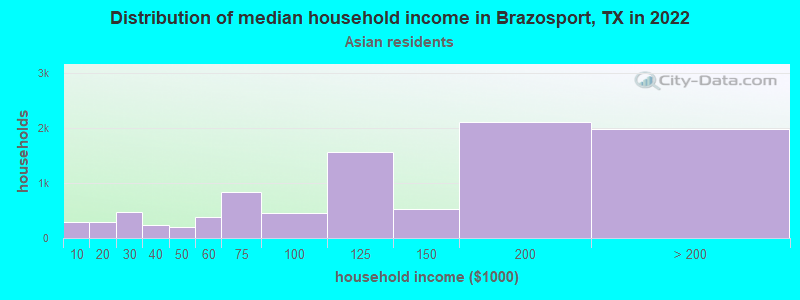
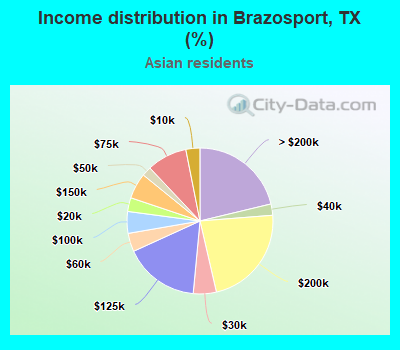
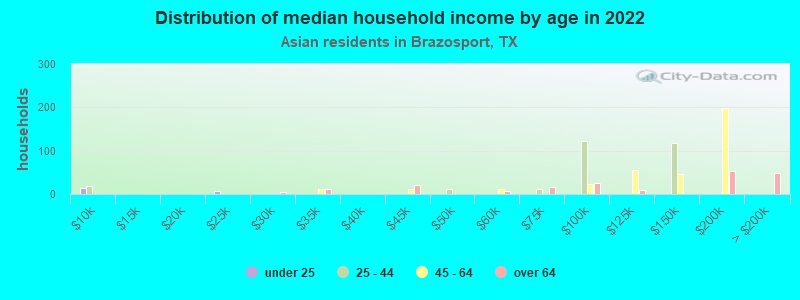
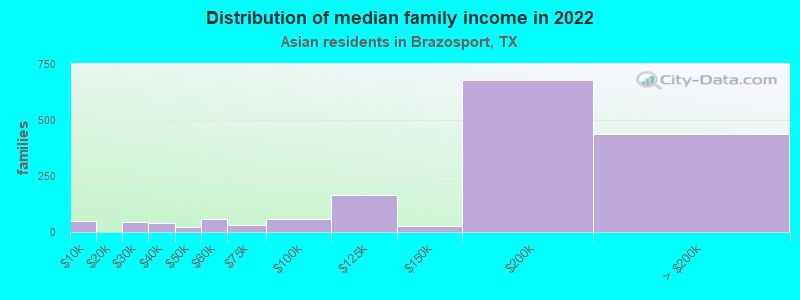
Income statistics for Asian residents
Median household income in Brazosport, TX in 2022:| Brazosport: | $144,242 |
| Texas: | $107,673 |
Change in median household income between 2000 and 2022:| Brazosport, Texas: | +80.3% |
| Texas: | +115.1% |
Number of households with income < $10k:| Brazosport: | 3.1% (290) |
| State: | 5.2% (29,885) |
Number of households with income $10k - 20k:| Brazosport: | 3.1% (284) |
| State: | 4.7% (27,044) |
Number of households with income $20k - 30k:| Brazosport: | 5.1% (476) |
| State: | 4.1% (23,363) |
Number of households with income $30k - 40k:| Brazosport: | 2.5% (232) |
| State: | 4.1% (23,309) |
Number of households with income $40k - 50k:| Brazosport: | 2.1% (195) |
| Texas: | 5.2% (29,826) |
Number of households with income $50k - 60k:| Brazosport: | 4.1% (381) |
| State: | 4.7% (26,512) |
Number of households with income $60k - 75k:| Brazosport: | 8.9% (831) |
| State: | 6.5% (36,905) |
Number of households with income $75k - 100k:| Brazosport: | 4.8% (449) |
| State: | 11.3% (64,350) |
Number of households with income $100k - 125k:| Brazosport: | 16.7% (1,554) |
| State: | 11.4% (64,714) |
Number of households with income $125k - 150k:| Brazosport: | 5.7% (531) |
| State: | 9.3% (52,719) |
Number of households with income $150k - 200k:| Brazosport: | 22.6% (2,107) |
| Texas: | 12.5% (70,953) |
Number of households with income > $200k:| Brazosport: | 21.3% (1,980) |
| State: | 21.1% (120,260) |
Aggregate household income in Brazosport in 2022: $280,009,690
Median family income in Brazosport in 2022:| Brazosport: | $151,748 |
| State: | $123,328 |
Number of families with income < $10k:| Brazosport: | 3.0% (49) |
| Texas: | 3.1% (13,567) |
Number of families with income $20k - 30k:| Brazosport: | 2.8% (46) |
| State: | 3.4% (14,738) |
Number of families with income $30k - 40k:| Brazosport: | 2.5% (40) |
| State: | 3.4% (15,033) |
Number of families with income $40k - 50k:| Brazosport: | 1.3% (21) |
| Texas: | 4.9% (21,622) |
Number of families with income $50k - 60k:| Brazosport: | 3.5% (56) |
| State: | 4.7% (20,568) |
Number of families with income $60k - 75k:| Brazosport: | 1.9% (30) |
| State: | 6.1% (26,637) |
Number of families with income $75k - 100k:| Brazosport: | 3.7% (60) |
| State: | 10.7% (46,626) |
Number of families with income $100k - 125k:| Brazosport: | 10.2% (163) |
| State: | 11.3% (49,585) |
Number of families with income $125k - 150k:| Brazosport: | 1.6% (26) |
| Texas: | 9.8% (43,043) |
Number of families with income $150k - 200k:| Brazosport: | 42.2% (679) |
| State: | 14.7% (64,203) |
Number of families with income > $200k:| Brazosport: | 27.3% (439) |
| Texas: | 24.8% (108,511) |
Median non-family income in Brazosport in 2022:| Brazosport: | $153,676 |
| State: | $64,320 |
Change in median non-family income between 2000 and 2022:| Brazosport, Texas: | +69.9% |
| State: | +131.1% |
Median per capita income in Brazosport in 2022:| Brazosport: | $59,630 |
| State: | $48,626 |
Change in median per capita income between 2000 and 2022:| Brazosport, Texas: | +94.7% |
| Texas: | +132.0% |
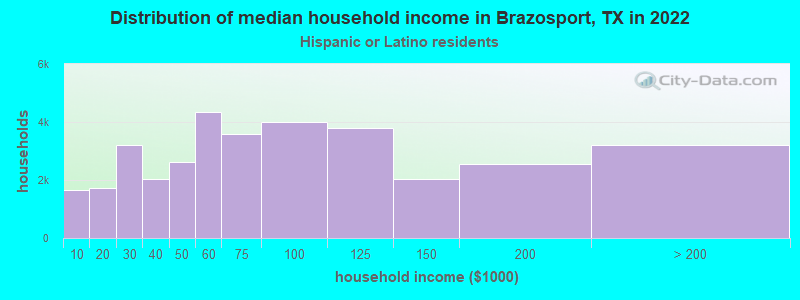
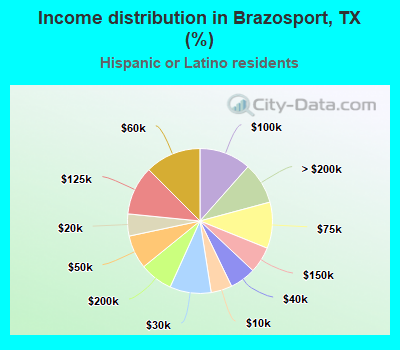
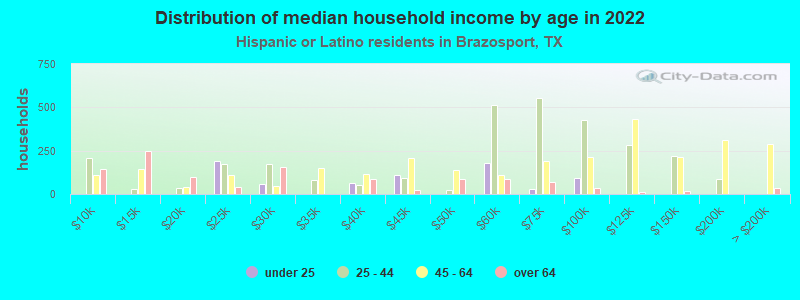
Income statistics for Hispanic or Latino residents
Median household income in Brazosport, TX in 2022:| Brazosport: | $64,996 |
| State: | $60,504 |
Change in median household income between 2000 and 2022:| Brazosport, Texas: | +86.2% |
| State: | +102.5% |
Number of households with income < $10k:| Brazosport: | 4.7% (1,641) |
| Texas: | 5.8% (213,953) |
Number of households with income $10k - 20k:| Brazosport: | 4.9% (1,707) |
| State: | 8.0% (297,456) |
Number of households with income $20k - 30k:| Brazosport: | 9.2% (3,207) |
| State: | 9.2% (340,166) |
Number of households with income $30k - 40k:| Brazosport: | 5.8% (2,021) |
| Texas: | 9.5% (354,336) |
Number of households with income $40k - 50k:| Brazosport: | 7.5% (2,612) |
| Texas: | 8.8% (327,013) |
Number of households with income $50k - 60k:| Brazosport: | 12.5% (4,338) |
| State: | 8.3% (308,818) |
Number of households with income $60k - 75k:| Brazosport: | 10.3% (3,585) |
| State: | 10.9% (405,109) |
Number of households with income $75k - 100k:| Brazosport: | 11.5% (4,010) |
| State: | 13.8% (511,639) |
Number of households with income $100k - 125k:| Brazosport: | 10.9% (3,798) |
| State: | 8.6% (319,728) |
Number of households with income $125k - 150k:| Brazosport: | 5.9% (2,038) |
| State: | 5.7% (210,932) |
Number of households with income $150k - 200k:| Brazosport: | 7.4% (2,562) |
| Texas: | 6.4% (236,055) |
Number of households with income > $200k:| Brazosport: | 9.3% (3,221) |
| Texas: | 5.1% (189,259) |
Aggregate household income in Brazosport in 2022: $1,030,564,025
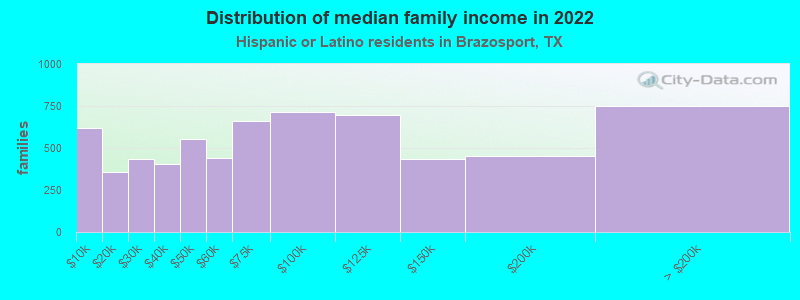
Median family income in Brazosport in 2022:| Brazosport: | $69,792 |
| State: | $65,080 |
Number of families with income < $10k:| Brazosport: | 9.5% (619) |
| Texas: | 5.3% (147,493) |
Number of families with income $10k - 20k:| Brazosport: | 5.5% (360) |
| Texas: | 6.3% (174,531) |
Number of families with income $20k - 30k:| Brazosport: | 6.6% (432) |
| State: | 8.6% (238,528) |
Number of families with income $30k - 40k:| Brazosport: | 6.2% (406) |
| Texas: | 9.1% (251,999) |
Number of families with income $40k - 50k:| Brazosport: | 8.5% (556) |
| State: | 8.6% (240,188) |
Number of families with income $50k - 60k:| Brazosport: | 6.7% (440) |
| State: | 8.0% (223,566) |
Number of families with income $60k - 75k:| Brazosport: | 10.1% (658) |
| Texas: | 10.9% (302,688) |
Number of families with income $75k - 100k:| Brazosport: | 11.0% (714) |
| State: | 14.3% (398,554) |
Number of families with income $100k - 125k:| Brazosport: | 10.7% (698) |
| State: | 9.5% (264,007) |
Number of families with income $125k - 150k:| Brazosport: | 6.7% (436) |
| Texas: | 6.2% (171,274) |
Number of families with income $150k - 200k:| Brazosport: | 6.9% (451) |
| Texas: | 7.3% (202,259) |
Number of families with income > $200k:| Brazosport: | 11.5% (750) |
| State: | 5.9% (165,129) |
Median non-family income in Brazosport in 2022:| Brazosport: | $44,036 |
| Texas: | $39,934 |
Change in median non-family income between 2000 and 2022:| Brazosport, Texas: | +122.3% |
| State: | +109.1% |
Median per capita income in Brazosport in 2022:| Brazosport: | $26,743 |
| State: | $24,862 |
Change in median per capita income between 2000 and 2022:| Brazosport, Texas: | +135.2% |
| Texas: | +130.8% |
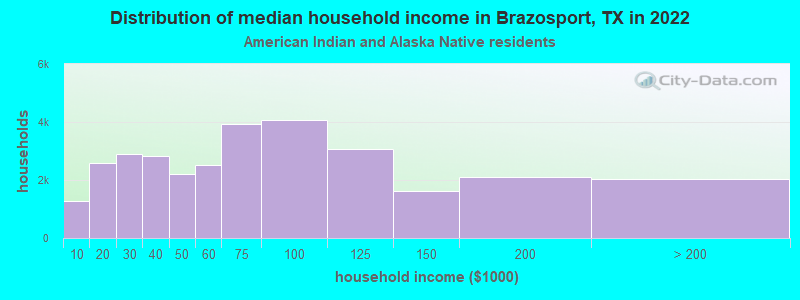
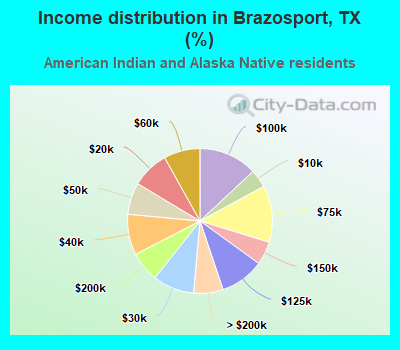
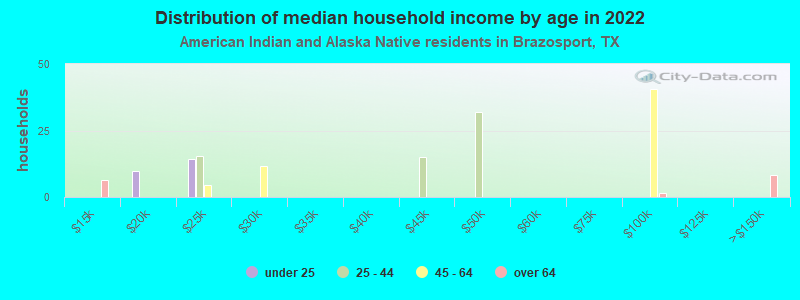
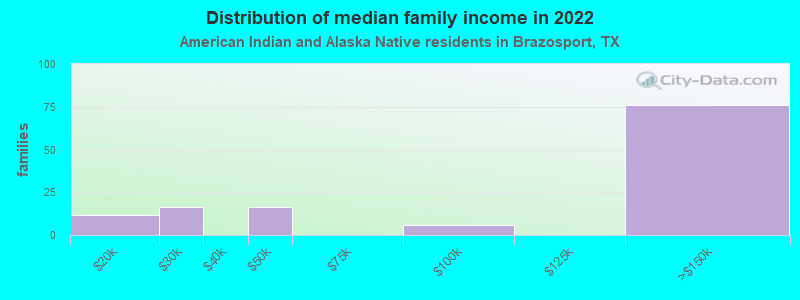
Income statistics for American Indian and Alaska Native residents
Median household income in Brazosport, TX in 2022:| Brazosport: | $50,248 |
| Texas: | $65,765 |
Change in median household income between 2000 and 2022:| Brazosport, Texas: | +93.7% |
| State: | +88.3% |
Number of households with income < $10k:| Brazosport: | 4.1% (1,264) |
| State: | 4.1% (3,398) |
Number of households with income $10k - 20k:| Brazosport: | 8.3% (2,584) |
| State: | 8.3% (6,949) |
Number of households with income $20k - 30k:| Brazosport: | 9.3% (2,880) |
| Texas: | 9.3% (7,742) |
Number of households with income $30k - 40k:| Brazosport: | 9.1% (2,834) |
| State: | 9.1% (7,627) |
Number of households with income $40k - 50k:| Brazosport: | 7.1% (2,205) |
| Texas: | 7.1% (5,922) |
Number of households with income $50k - 60k:| Brazosport: | 8.1% (2,516) |
| State: | 8.1% (6,761) |
Number of households with income $60k - 75k:| Brazosport: | 12.7% (3,937) |
| State: | 12.7% (10,588) |
Number of households with income $75k - 100k:| Brazosport: | 13.0% (4,057) |
| State: | 13.0% (10,903) |
Number of households with income $100k - 125k:| Brazosport: | 9.9% (3,071) |
| State: | 9.9% (8,256) |
Number of households with income $125k - 150k:| Brazosport: | 5.2% (1,619) |
| State: | 5.2% (4,355) |
Number of households with income $150k - 200k:| Brazosport: | 6.7% (2,089) |
| State: | 6.7% (5,623) |
Number of households with income > $200k:| Brazosport: | 6.6% (2,051) |
| Texas: | 6.6% (5,522) |
Aggregate household income in Brazosport in 2022: $12,657,575
Median family income in Brazosport in 2022:| Brazosport: | $42,509 |
| State: | $72,369 |
Number of families with income $10k - 20k:| Brazosport: | 9.2% (11) |
| State: | 8.0% (4,891) |
Number of families with income $20k - 30k:| Brazosport: | 13.1% (16) |
| State: | 7.3% (4,502) |
Number of families with income $40k - 50k:| Brazosport: | 12.9% (16) |
| State: | 7.9% (4,855) |
Number of families with income $75k - 100k:| Brazosport: | 4.5% (6) |
| Texas: | 14.4% (8,852) |
Number of families with income $125k - 150k:| Brazosport: | 60.3% (76) |
| State: | 7.5% (4,609) |
Median per capita income in Brazosport in 2022:| Brazosport: | $39,978 |
| State: | $28,166 |
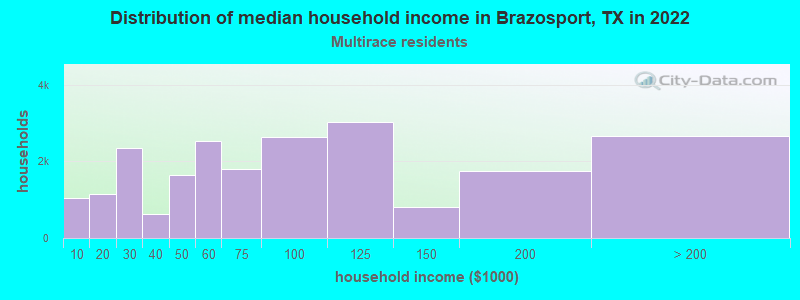
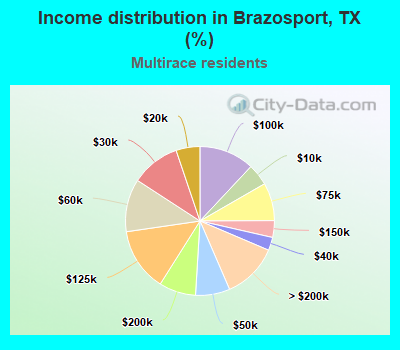
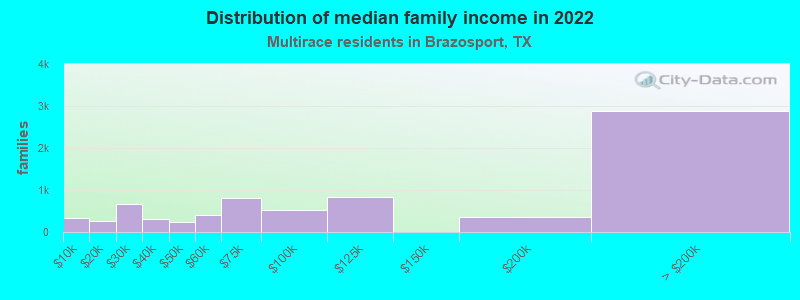
Income statistics for Multirace residents
Median household income in Brazosport, TX in 2022:| Brazosport: | $65,748 |
| Texas: | $62,748 |
Change in median household income between 2000 and 2022:| Brazosport, Texas: | +83.4% |
| State: | +92.3% |
Number of households with income < $10k:| Brazosport: | 4.7% (1,042) |
| State: | 5.5% (122,324) |
Number of households with income $10k - 20k:| Brazosport: | 5.2% (1,144) |
| Texas: | 8.2% (182,232) |
Number of households with income $20k - 30k:| Brazosport: | 10.6% (2,349) |
| State: | 8.5% (189,456) |
Number of households with income $30k - 40k:| Brazosport: | 2.8% (628) |
| Texas: | 8.9% (197,499) |
Number of households with income $40k - 50k:| Brazosport: | 7.5% (1,648) |
| State: | 8.7% (191,735) |
Number of households with income $50k - 60k:| Brazosport: | 11.5% (2,534) |
| Texas: | 8.0% (177,535) |
Number of households with income $60k - 75k:| Brazosport: | 8.2% (1,816) |
| State: | 10.5% (232,479) |
Number of households with income $75k - 100k:| Brazosport: | 12.0% (2,644) |
| Texas: | 13.1% (290,448) |
Number of households with income $100k - 125k:| Brazosport: | 13.7% (3,032) |
| State: | 8.6% (191,595) |
Number of households with income $125k - 150k:| Brazosport: | 3.7% (806) |
| State: | 6.0% (133,361) |
Number of households with income $150k - 200k:| Brazosport: | 8.0% (1,763) |
| Texas: | 7.2% (159,195) |
Number of households with income > $200k:| Brazosport: | 12.1% (2,671) |
| State: | 6.7% (148,064) |
Aggregate household income in Brazosport in 2022: $720,021,012
Median family income in Brazosport in 2022:| Brazosport: | $73,896 |
| State: | $69,780 |
Number of families with income < $10k:| Brazosport: | 4.3% (324) |
| Texas: | 4.4% (70,825) |
Number of families with income $10k - 20k:| Brazosport: | 3.4% (262) |
| Texas: | 5.9% (95,279) |
Number of families with income $20k - 30k:| Brazosport: | 8.7% (663) |
| State: | 7.8% (126,627) |
Number of families with income $30k - 40k:| Brazosport: | 4.0% (302) |
| State: | 8.5% (137,626) |
Number of families with income $40k - 50k:| Brazosport: | 3.0% (229) |
| Texas: | 8.4% (135,809) |
Number of families with income $50k - 60k:| Brazosport: | 5.4% (412) |
| Texas: | 7.9% (127,739) |
Number of families with income $60k - 75k:| Brazosport: | 10.5% (799) |
| State: | 10.5% (169,549) |
Number of families with income $75k - 100k:| Brazosport: | 6.8% (518) |
| State: | 14.0% (226,284) |
Number of families with income $100k - 125k:| Brazosport: | 11.1% (841) |
| State: | 9.5% (153,597) |
Number of families with income $150k - 200k:| Brazosport: | 4.8% (364) |
| Texas: | 8.5% (137,607) |
Number of families with income > $200k:| Brazosport: | 38.0% (2,887) |
| State: | 7.9% (127,299) |
Median non-family income in Brazosport in 2022:| Brazosport: | $28,003 |
| State: | $40,634 |
Median per capita income in Brazosport in 2022:| Brazosport: | $27,697 |
| Texas: | $26,785 |
Change in median per capita income between 2000 and 2022:| Brazosport, Texas: | +114.6% |
| State: | +110.9% |
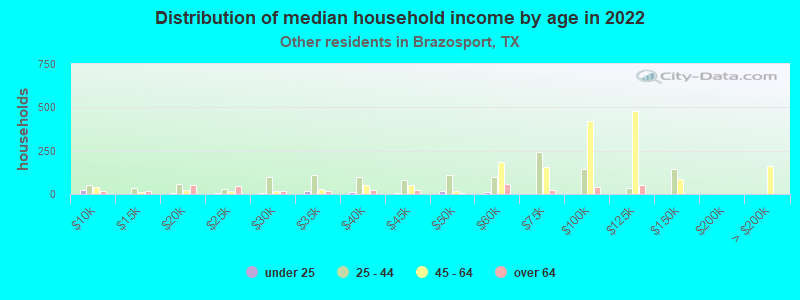
Income statistics for other residents
Number of households with income < $10k:| Brazosport: | 9.1% (235) |
| State: | 5.9% (54,162) |
Number of households with income $10k - 20k:| Brazosport: | 7.7% (198) |
| State: | 6.8% (62,891) |
Number of households with income $20k - 30k:| Brazosport: | 3.6% (92) |
| State: | 10.6% (97,294) |
Number of households with income $30k - 40k:| Brazosport: | 9.9% (257) |
| Texas: | 10.8% (99,670) |
Number of households with income $40k - 50k:| Brazosport: | 6.4% (166) |
| Texas: | 9.3% (85,548) |
Number of households with income $50k - 60k:| Brazosport: | 14.1% (364) |
| State: | 9.0% (82,757) |
Number of households with income $60k - 75k:| Brazosport: | 11.0% (285) |
| State: | 10.9% (100,326) |
Number of households with income $75k - 100k:| Brazosport: | 9.7% (250) |
| State: | 14.0% (128,767) |
Number of households with income $100k - 125k:| Brazosport: | 9.8% (254) |
| State: | 8.2% (75,218) |
Number of households with income $125k - 150k:| Brazosport: | 7.7% (200) |
| Texas: | 4.8% (44,223) |
Number of households with income $150k - 200k:| Brazosport: | 6.2% (161) |
| Texas: | 5.6% (51,376) |
Number of households with income > $200k:| Brazosport: | 4.8% (124) |
| State: | 4.0% (36,393) |
Aggregate household income in Brazosport in 2022: $204,067,007
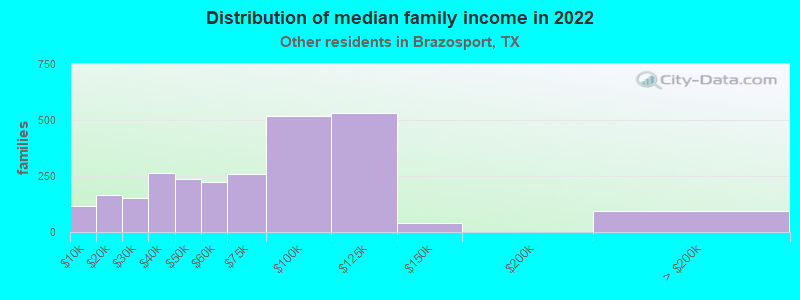
Median family income in Brazosport in 2022:| Brazosport: | $56,648 |
| Texas: | $60,064 |
Number of families with income < $10k:| Brazosport: | 4.4% (114) |
| State: | 6.8% (47,502) |
Number of families with income $10k - 20k:| Brazosport: | 6.4% (165) |
| Texas: | 6.0% (41,763) |
Number of families with income $20k - 30k:| Brazosport: | 5.8% (151) |
| Texas: | 9.9% (68,761) |
Number of families with income $30k - 40k:| Brazosport: | 10.1% (263) |
| State: | 9.7% (67,685) |
Number of families with income $40k - 50k:| Brazosport: | 9.1% (236) |
| Texas: | 9.0% (62,441) |
Number of families with income $50k - 60k:| Brazosport: | 8.6% (224) |
| Texas: | 8.5% (59,321) |
Number of families with income $60k - 75k:| Brazosport: | 9.9% (257) |
| Texas: | 11.2% (77,588) |
Number of families with income $75k - 100k:| Brazosport: | 20.0% (518) |
| Texas: | 14.5% (101,032) |
Number of families with income $100k - 125k:| Brazosport: | 20.5% (531) |
| Texas: | 8.8% (61,439) |
Number of families with income $125k - 150k:| Brazosport: | 1.6% (41) |
| Texas: | 5.1% (35,727) |
Number of families with income > $200k:| Brazosport: | 3.6% (94) |
| State: | 4.5% (31,243) |
Median non-family income in Brazosport in 2022:| Brazosport: | $50,258 |
| State: | $38,690 |
Change in median non-family income between 2000 and 2022:| Brazosport, Texas: | +92.6% |
| State: | +90.2% |
Median per capita income in Brazosport in 2022:| Brazosport: | $31,047 |
| State: | $23,899 |