Brookfield, Connecticut (CT) income map, earnings map, and wages data
The median household income in Brookfield, CT in 2022 was $139,950, which was 36.8% greater than the median annual income of $88,429 across the entire state of Connecticut. Compared to the median income of $82,706 in 2000 this represents an increase of 40.9%. The per capita income in 2022 was $67,799, which means an increase of 45.3% compared to 2000 when it was $37,063.
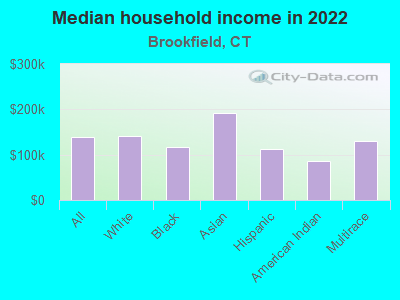
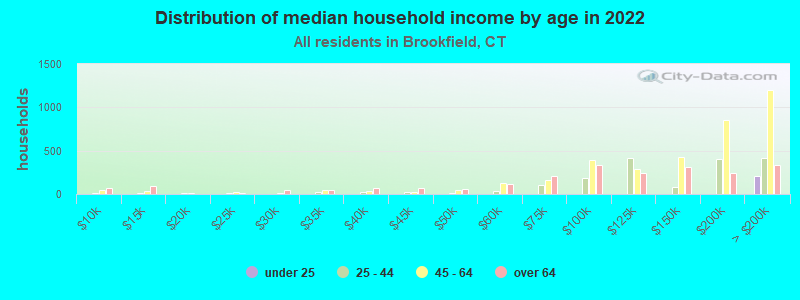
Income statistics for all residents
Median household income in Brookfield, CT in 2022:| Brookfield: | $139,950 |
| State: | $88,429 |
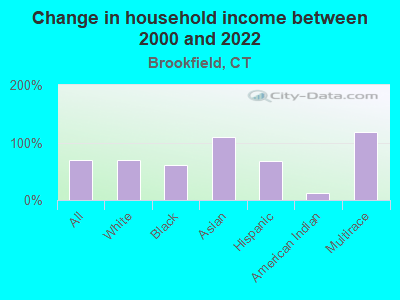
Change in median household income between 2000 and 2022:| Brookfield, Connecticut: | +69.2% |
| State: | +64.0% |
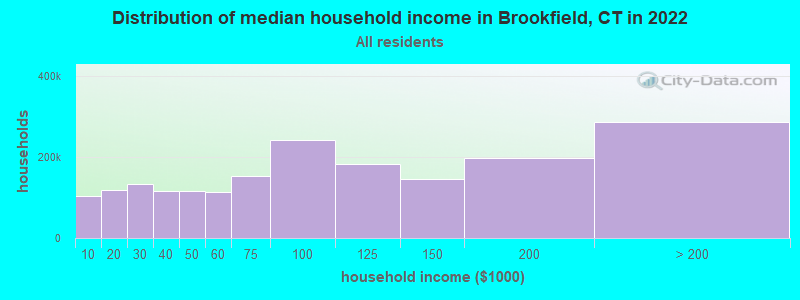
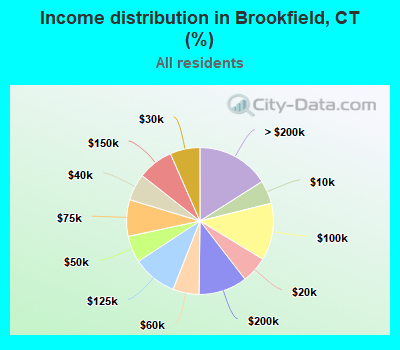
Number of households with income < $10k:| Brookfield: | 5.2% (57,004) |
| State: | 5.1% (72,746) |
Number of households with income $10k - 20k:| Brookfield: | 5.8% (64,281) |
| State: | 5.7% (81,643) |
Number of households with income $20k - 30k:| Brookfield: | 6.6% (72,760) |
| State: | 6.5% (92,844) |
Number of households with income $30k - 40k:| Brookfield: | 5.9% (65,297) |
| State: | 5.9% (83,934) |
Number of households with income $40k - 50k:| Brookfield: | 5.9% (64,878) |
| Connecticut: | 5.8% (83,025) |
Number of households with income $50k - 60k:| Brookfield: | 5.8% (63,617) |
| Connecticut: | 5.7% (81,788) |
Number of households with income $60k - 75k:| Brookfield: | 8.1% (89,136) |
| State: | 8.1% (115,651) |
Number of households with income $75k - 100k:| Brookfield: | 12.6% (139,210) |
| State: | 12.6% (180,173) |
Number of households with income $100k - 125k:| Brookfield: | 9.8% (108,374) |
| State: | 9.9% (141,231) |
Number of households with income $125k - 150k:| Brookfield: | 7.8% (86,547) |
| State: | 7.9% (112,826) |
Number of households with income $150k - 200k:| Brookfield: | 10.7% (118,389) |
| State: | 10.8% (154,641) |
Number of households with income > $200k:| Brookfield: | 16.0% (176,866) |
| Connecticut: | 16.3% (233,133) |
Aggregate household income in Brookfield in 2022: $24,668,672,785
Median family income in Brookfield in 2022:| Brookfield: | $163,054 |
| State: | $115,183 |
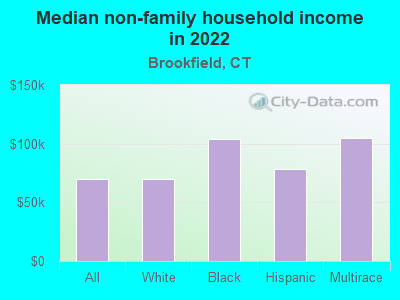
Median non-family income in Brookfield in 2022:| Brookfield: | $69,712 |
| State: | $50,964 |
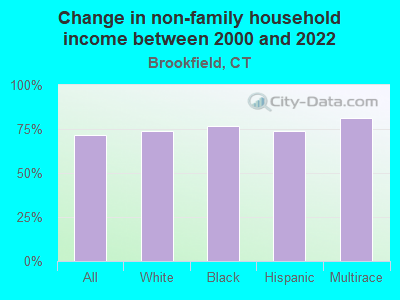
Change in median non-family income between 2000 and 2022:| Brookfield, Connecticut: | +71.5% |
| State: | +65.1% |
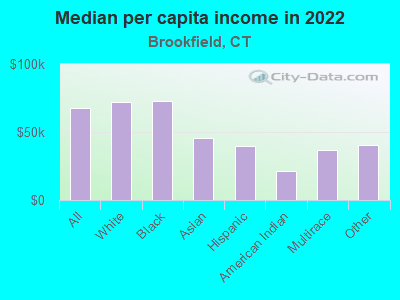
Median per capita income in Brookfield in 2022:| Brookfield: | $67,799 |
| State: | $51,581 |
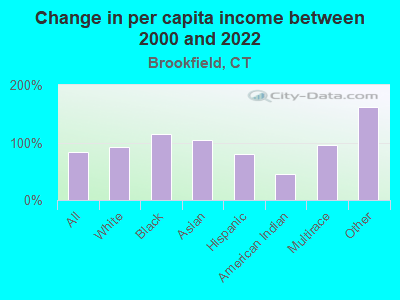
Change in median per capita income between 2000 and 2022:| Brookfield, Connecticut: | +82.9% |
| Connecticut: | +79.3% |
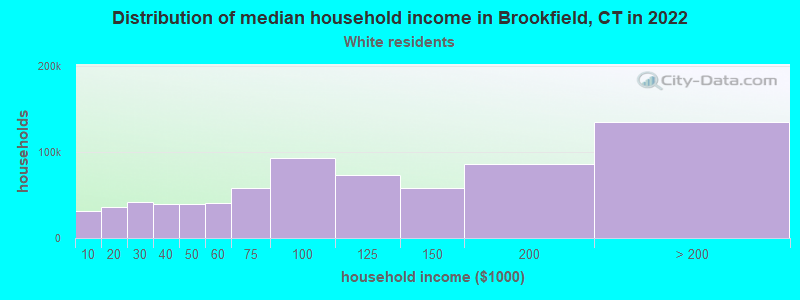
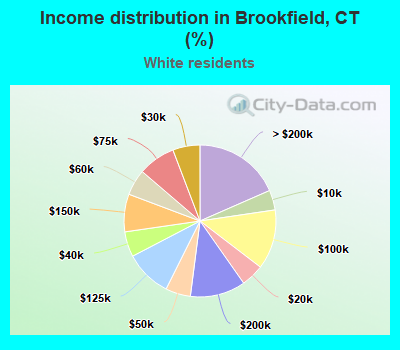
Income statistics for White residents
Median household income in Brookfield, CT in 2022:| Brookfield: | $141,316 |
| Connecticut: | $96,890 |
Change in median household income between 2000 and 2022:| Brookfield, Connecticut: | +69.4% |
| Connecticut: | +68.5% |
Number of households with income < $10k:| Brookfield: | 4.2% (30,909) |
| Connecticut: | 4.2% (42,265) |
Number of households with income $10k - 20k:| Brookfield: | 4.9% (35,537) |
| State: | 4.8% (48,323) |
Number of households with income $20k - 30k:| Brookfield: | 5.8% (42,262) |
| Connecticut: | 5.7% (57,716) |
Number of households with income $30k - 40k:| Brookfield: | 5.4% (39,119) |
| State: | 5.3% (53,827) |
Number of households with income $40k - 50k:| Brookfield: | 5.3% (38,958) |
| State: | 5.3% (53,301) |
Number of households with income $50k - 60k:| Brookfield: | 5.6% (40,543) |
| Connecticut: | 5.5% (55,690) |
Number of households with income $60k - 75k:| Brookfield: | 7.9% (57,938) |
| State: | 8.0% (80,329) |
Number of households with income $75k - 100k:| Brookfield: | 12.7% (92,839) |
| State: | 12.7% (128,070) |
Number of households with income $100k - 125k:| Brookfield: | 10.0% (72,900) |
| State: | 10.0% (101,210) |
Number of households with income $125k - 150k:| Brookfield: | 8.0% (58,527) |
| State: | 8.0% (81,250) |
Number of households with income $150k - 200k:| Brookfield: | 11.8% (86,057) |
| Connecticut: | 11.8% (119,527) |
Number of households with income > $200k:| Brookfield: | 18.4% (134,719) |
| State: | 18.6% (187,875) |
Aggregate household income in Brookfield in 2022: $18,224,494,522
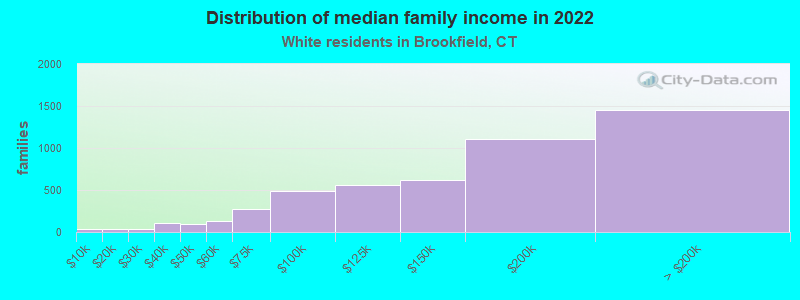
Median family income in Brookfield in 2022:| Brookfield: | $168,834 |
| Connecticut: | $128,955 |
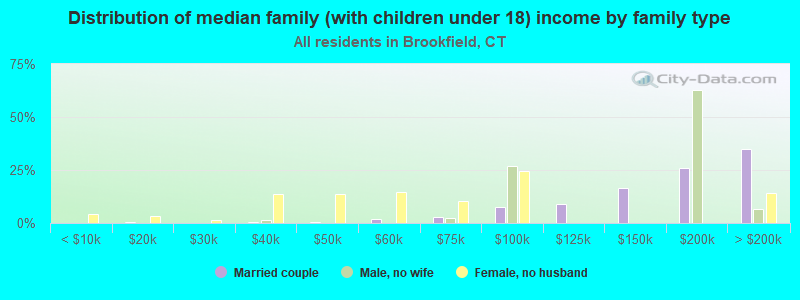
Number of families with income < $10k:| Brookfield: | 0.7% (34) |
| Connecticut: | 1.9% (11,537) |
Number of families with income $10k - 20k:| Brookfield: | 0.6% (32) |
| State: | 1.8% (11,289) |
Number of families with income $20k - 30k:| Brookfield: | 0.7% (36) |
| State: | 3.0% (18,506) |
Number of families with income $30k - 40k:| Brookfield: | 2.1% (103) |
| State: | 2.9% (18,160) |
Number of families with income $40k - 50k:| Brookfield: | 1.9% (93) |
| State: | 3.9% (24,550) |
Number of families with income $50k - 60k:| Brookfield: | 2.6% (127) |
| Connecticut: | 4.3% (26,723) |
Number of families with income $60k - 75k:| Brookfield: | 5.4% (268) |
| State: | 7.1% (44,075) |
Number of families with income $75k - 100k:| Brookfield: | 9.8% (486) |
| Connecticut: | 12.5% (77,679) |
Number of families with income $100k - 125k:| Brookfield: | 11.4% (564) |
| State: | 11.1% (69,086) |
Number of families with income $125k - 150k:| Brookfield: | 12.6% (621) |
| Connecticut: | 9.6% (59,616) |
Number of families with income $150k - 200k:| Brookfield: | 22.5% (1,108) |
| Connecticut: | 15.7% (97,890) |
Number of families with income > $200k:| Brookfield: | 29.6% (1,457) |
| State: | 26.3% (163,417) |
Median non-family income in Brookfield in 2022:| Brookfield: | $70,038 |
| Connecticut: | $54,067 |
Change in median non-family income between 2000 and 2022:| Brookfield, Connecticut: | +73.7% |
| State: | +68.7% |
Median per capita income in Brookfield in 2022:| Brookfield: | $72,381 |
| State: | $59,916 |
Change in median per capita income between 2000 and 2022:| Brookfield, Connecticut: | +92.1% |
| State: | +90.2% |
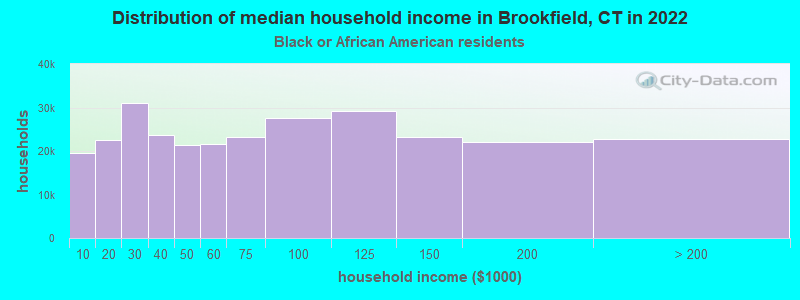
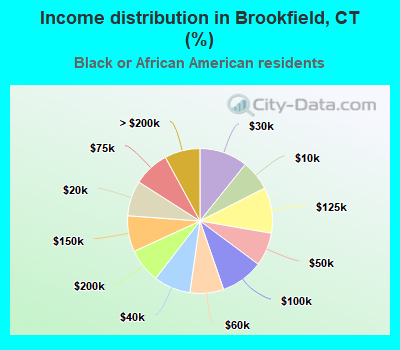
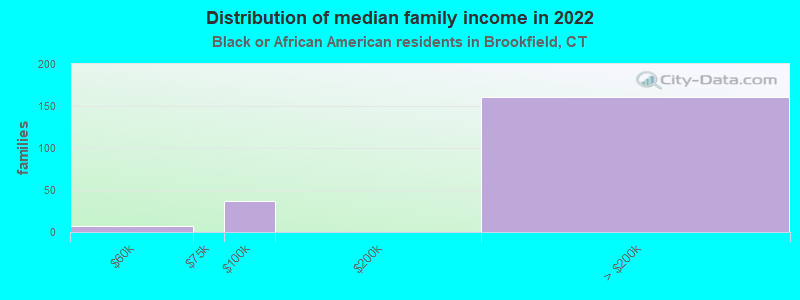
Income statistics for Black or African American residents
Median household income in Brookfield, CT in 2022:| Brookfield: | $116,227 |
| State: | $61,803 |
Change in median household income between 2000 and 2022:| Brookfield, Connecticut: | +60.9% |
| State: | +76.1% |
Number of households with income < $10k:| Brookfield: | 6.8% (19,535) |
| State: | 6.8% (9,494) |
Number of households with income $10k - 20k:| Brookfield: | 7.9% (22,640) |
| Connecticut: | 7.9% (11,003) |
Number of households with income $20k - 30k:| Brookfield: | 10.8% (30,957) |
| Connecticut: | 10.8% (15,045) |
Number of households with income $30k - 40k:| Brookfield: | 8.2% (23,665) |
| State: | 8.2% (11,501) |
Number of households with income $40k - 50k:| Brookfield: | 7.4% (21,433) |
| State: | 7.4% (10,416) |
Number of households with income $50k - 60k:| Brookfield: | 7.5% (21,675) |
| Connecticut: | 7.5% (10,534) |
Number of households with income $60k - 75k:| Brookfield: | 8.0% (23,136) |
| State: | 8.0% (11,244) |
Number of households with income $75k - 100k:| Brookfield: | 9.6% (27,511) |
| State: | 9.6% (13,370) |
Number of households with income $100k - 125k:| Brookfield: | 10.2% (29,309) |
| State: | 10.2% (14,244) |
Number of households with income $125k - 150k:| Brookfield: | 8.0% (23,140) |
| State: | 8.0% (11,246) |
Number of households with income $150k - 200k:| Brookfield: | 7.7% (22,072) |
| State: | 7.7% (10,727) |
Number of households with income > $200k:| Brookfield: | 7.9% (22,811) |
| Connecticut: | 7.9% (11,086) |
Aggregate household income in Brookfield in 2022: $37,096,698
Median family income in Brookfield in 2022:| Brookfield: | $194,036 |
| Connecticut: | $87,228 |
Number of families with income $50k - 60k:| Brookfield: | 3.6% (7) |
| State: | 5.4% (4,480) |
Number of families with income $75k - 100k:| Brookfield: | 17.9% (37) |
| State: | 12.7% (10,598) |
Number of families with income > $200k:| Brookfield: | 78.4% (161) |
| State: | 10.8% (9,057) |
Median non-family income in Brookfield in 2022:| Brookfield: | $104,292 |
| State: | $38,608 |
Change in median non-family income between 2000 and 2022:| Brookfield, Connecticut: | +77.0% |
| State: | +77.0% |
Median per capita income in Brookfield in 2022:| Brookfield: | $73,151 |
| State: | $36,289 |
Change in median per capita income between 2000 and 2022:| Brookfield, Connecticut: | +115.2% |
| Connecticut: | +117.5% |
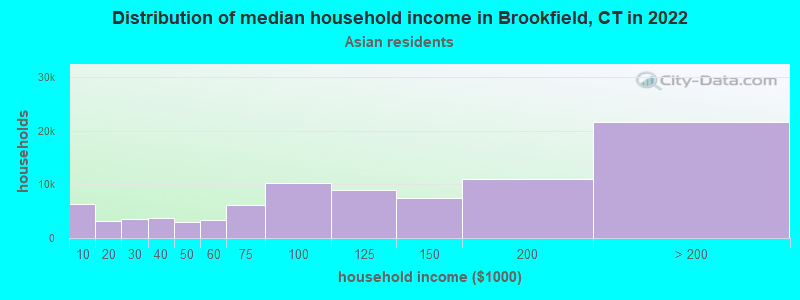
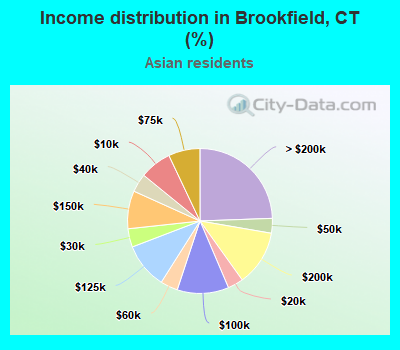
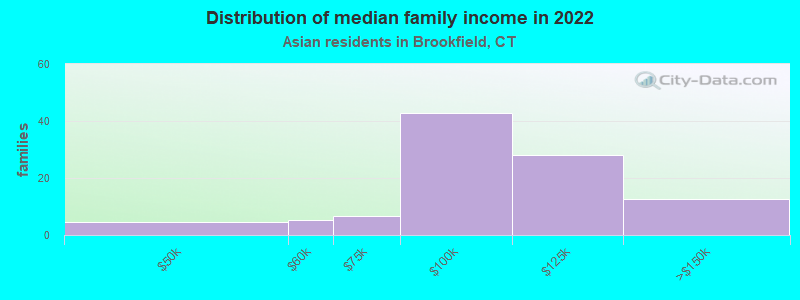
Income statistics for Asian residents
Median household income in Brookfield, CT in 2022:| Brookfield: | $191,230 |
| State: | $110,568 |
Change in median household income between 2000 and 2022:| Brookfield, Connecticut: | +110.1% |
| Connecticut: | +79.5% |
Number of households with income < $10k:| Brookfield: | 7.1% (6,274) |
| State: | 7.1% (4,245) |
Number of households with income $10k - 20k:| Brookfield: | 3.5% (3,084) |
| State: | 3.5% (2,087) |
Number of households with income $20k - 30k:| Brookfield: | 4.1% (3,641) |
| Connecticut: | 4.1% (2,464) |
Number of households with income $30k - 40k:| Brookfield: | 4.1% (3,663) |
| Connecticut: | 4.1% (2,478) |
Number of households with income $40k - 50k:| Brookfield: | 3.3% (2,931) |
| Connecticut: | 3.3% (1,983) |
Number of households with income $50k - 60k:| Brookfield: | 3.9% (3,441) |
| State: | 3.9% (2,328) |
Number of households with income $60k - 75k:| Brookfield: | 7.0% (6,249) |
| Connecticut: | 7.0% (4,228) |
Number of households with income $75k - 100k:| Brookfield: | 11.5% (10,214) |
| State: | 11.5% (6,911) |
Number of households with income $100k - 125k:| Brookfield: | 10.2% (9,056) |
| Connecticut: | 10.2% (6,127) |
Number of households with income $125k - 150k:| Brookfield: | 8.5% (7,507) |
| State: | 8.5% (5,079) |
Number of households with income $150k - 200k:| Brookfield: | 12.4% (10,987) |
| Connecticut: | 12.4% (7,434) |
Number of households with income > $200k:| Brookfield: | 24.4% (21,669) |
| State: | 24.4% (14,661) |
Aggregate household income in Brookfield in 2022: $24,873,871
Median family income in Brookfield in 2022:| Brookfield: | $189,158 |
| State: | $134,548 |
Number of families with income $40k - 50k:| Brookfield: | 4.5% (5) |
| State: | 2.0% (863) |
Number of families with income $50k - 60k:| Brookfield: | 5.4% (5) |
| State: | 3.7% (1,635) |
Number of families with income $60k - 75k:| Brookfield: | 6.8% (7) |
| State: | 6.0% (2,651) |
Number of families with income $75k - 100k:| Brookfield: | 42.6% (43) |
| Connecticut: | 11.0% (4,844) |
Number of families with income $100k - 125k:| Brookfield: | 28.0% (28) |
| Connecticut: | 10.5% (4,621) |
Number of families with income $125k - 150k:| Brookfield: | 12.6% (13) |
| State: | 8.2% (3,588) |
Median per capita income in Brookfield in 2022:| Brookfield: | $45,689 |
| State: | $55,295 |
Change in median per capita income between 2000 and 2022:| Brookfield, Connecticut: | +103.6% |
| State: | +97.8% |
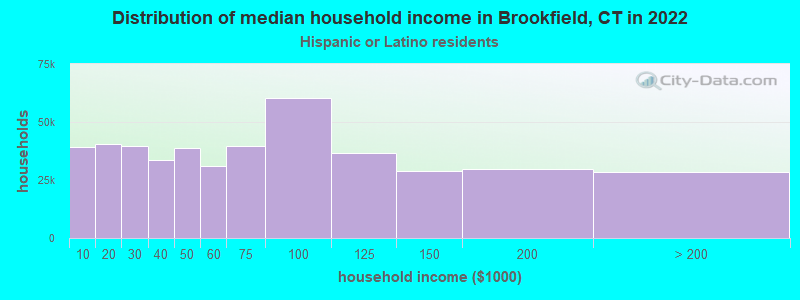
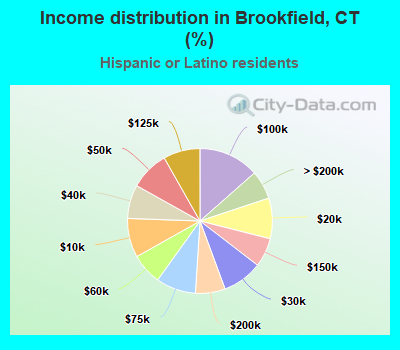
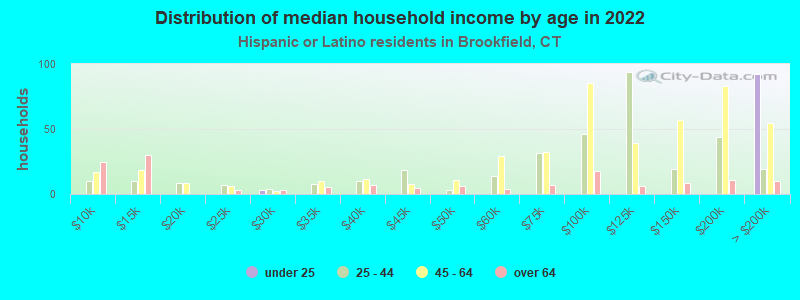
Income statistics for Hispanic or Latino residents
Median household income in Brookfield, CT in 2022:| Brookfield: | $112,999 |
| State: | $60,275 |
Change in median household income between 2000 and 2022:| Brookfield, Connecticut: | +67.8% |
| State: | +87.9% |
Number of households with income < $10k:| Brookfield: | 8.7% (39,019) |
| Connecticut: | 8.7% (18,584) |
Number of households with income $10k - 20k:| Brookfield: | 9.1% (40,385) |
| Connecticut: | 9.1% (19,235) |
Number of households with income $20k - 30k:| Brookfield: | 8.9% (39,869) |
| State: | 8.9% (18,989) |
Number of households with income $30k - 40k:| Brookfield: | 7.5% (33,524) |
| Connecticut: | 7.5% (15,967) |
Number of households with income $40k - 50k:| Brookfield: | 8.7% (38,771) |
| State: | 8.7% (18,466) |
Number of households with income $50k - 60k:| Brookfield: | 6.9% (30,876) |
| State: | 6.9% (14,706) |
Number of households with income $60k - 75k:| Brookfield: | 8.9% (39,657) |
| Connecticut: | 8.9% (18,888) |
Number of households with income $75k - 100k:| Brookfield: | 13.5% (60,193) |
| Connecticut: | 13.5% (28,669) |
Number of households with income $100k - 125k:| Brookfield: | 8.2% (36,604) |
| Connecticut: | 8.2% (17,434) |
Number of households with income $125k - 150k:| Brookfield: | 6.5% (28,873) |
| Connecticut: | 6.5% (13,752) |
Number of households with income $150k - 200k:| Brookfield: | 6.6% (29,633) |
| State: | 6.6% (14,114) |
Number of households with income > $200k:| Brookfield: | 6.4% (28,617) |
| State: | 6.4% (13,630) |
Aggregate household income in Brookfield in 2022: $74,739,593
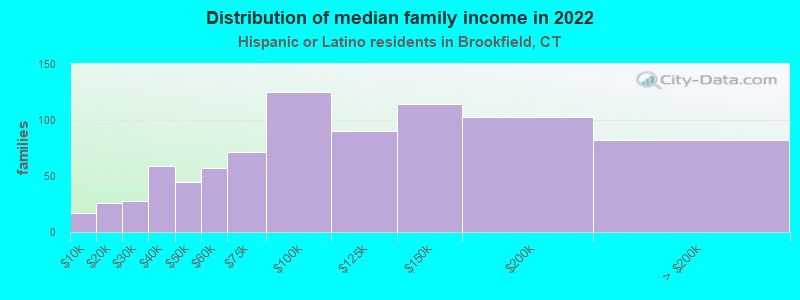
Median family income in Brookfield in 2022:| Brookfield: | $154,310 |
| Connecticut: | $68,336 |
Number of families with income < $10k:| Brookfield: | 2.1% (17) |
| State: | 5.2% (7,456) |
Number of families with income $10k - 20k:| Brookfield: | 3.2% (26) |
| State: | 6.0% (8,616) |
Number of families with income $20k - 30k:| Brookfield: | 3.4% (28) |
| State: | 8.9% (12,680) |
Number of families with income $30k - 40k:| Brookfield: | 7.3% (59) |
| State: | 8.5% (12,090) |
Number of families with income $40k - 50k:| Brookfield: | 5.5% (45) |
| Connecticut: | 8.8% (12,624) |
Number of families with income $50k - 60k:| Brookfield: | 7.0% (57) |
| Connecticut: | 8.4% (11,924) |
Number of families with income $60k - 75k:| Brookfield: | 8.7% (71) |
| State: | 8.9% (12,677) |
Number of families with income $75k - 100k:| Brookfield: | 15.3% (125) |
| Connecticut: | 14.3% (20,457) |
Number of families with income $100k - 125k:| Brookfield: | 11.0% (90) |
| Connecticut: | 8.2% (11,720) |
Number of families with income $125k - 150k:| Brookfield: | 13.9% (114) |
| Connecticut: | 8.2% (11,729) |
Number of families with income $150k - 200k:| Brookfield: | 12.6% (103) |
| State: | 7.1% (10,096) |
Number of families with income > $200k:| Brookfield: | 10.0% (82) |
| Connecticut: | 7.4% (10,622) |
Median non-family income in Brookfield in 2022:| Brookfield: | $78,248 |
| State: | $36,714 |
Change in median non-family income between 2000 and 2022:| Brookfield, Connecticut: | +73.9% |
| Connecticut: | +90.0% |
Median per capita income in Brookfield in 2022:| Brookfield: | $39,880 |
| State: | $28,507 |
Change in median per capita income between 2000 and 2022:| Brookfield, Connecticut: | +80.3% |
| State: | +117.2% |
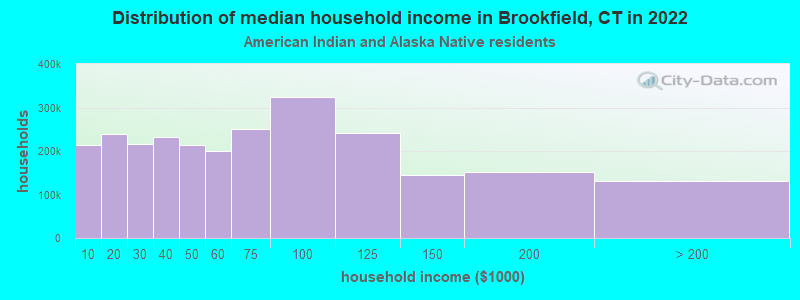
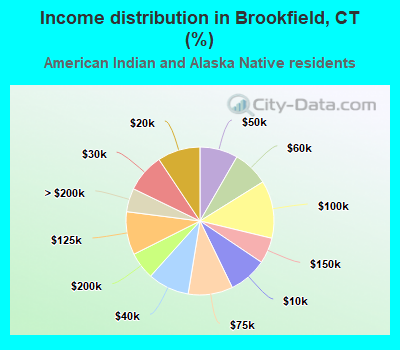
Income statistics for American Indian and Alaska Native residents
Median household income in Brookfield, CT in 2022:| Brookfield: | $85,198 |
| Connecticut: | $41,848 |
Change in median household income between 2000 and 2022:| Brookfield, Connecticut: | +12.9% |
| State: | +12.9% |
Number of households with income < $10k:| Brookfield: | 8.4% (214,652) |
| State: | 10.2% (340) |
Number of households with income $10k - 20k:| Brookfield: | 9.4% (239,546) |
| State: | 8.5% (283) |
Number of households with income $20k - 30k:| Brookfield: | 8.5% (216,672) |
| State: | 9.4% (314) |
Number of households with income $30k - 40k:| Brookfield: | 9.1% (232,137) |
| State: | 10.1% (337) |
Number of households with income $40k - 50k:| Brookfield: | 8.3% (212,932) |
| Connecticut: | 13.4% (447) |
Number of households with income $50k - 60k:| Brookfield: | 7.8% (200,777) |
| State: | 3.1% (104) |
Number of households with income $60k - 75k:| Brookfield: | 9.8% (250,260) |
| State: | 5.6% (188) |
Number of households with income $75k - 100k:| Brookfield: | 12.6% (323,046) |
| State: | 13.4% (447) |
Number of households with income $100k - 125k:| Brookfield: | 9.4% (241,574) |
| Connecticut: | 9.5% (317) |
Number of households with income $125k - 150k:| Brookfield: | 5.6% (144,629) |
| State: | 3.9% (131) |
Number of households with income $150k - 200k:| Brookfield: | 6.0% (152,467) |
| State: | 6.3% (212) |
Number of households with income > $200k:| Brookfield: | 5.2% (131,968) |
| Connecticut: | 6.8% (228) |
Aggregate household income in Brookfield in 2022: $764,487
Median family income in Brookfield in 2022:| Brookfield: | $103,148 |
| State: | $57,217 |
Number of families with income $75k - 100k:| Brookfield: | 100.0% (19) |
| State: | 17.4% (349) |
Median per capita income in Brookfield in 2022:| Brookfield: | $21,070 |
| Connecticut: | $25,355 |
Change in median per capita income between 2000 and 2022:| Brookfield, Connecticut: | +45.9% |
| Connecticut: | +39.4% |
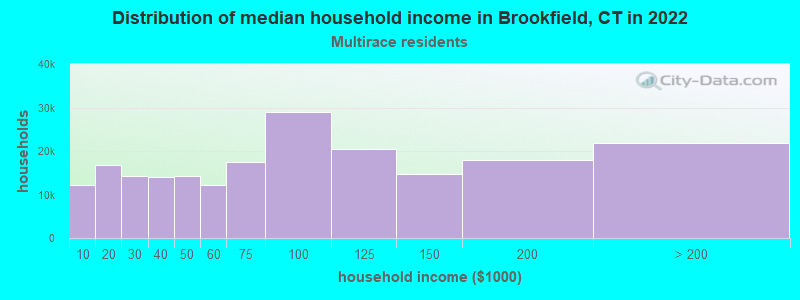
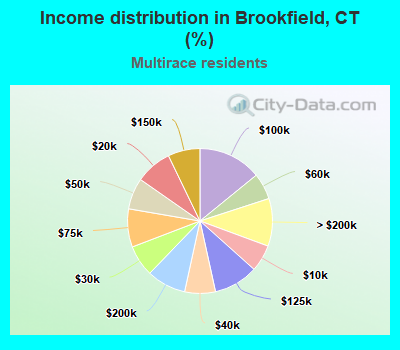
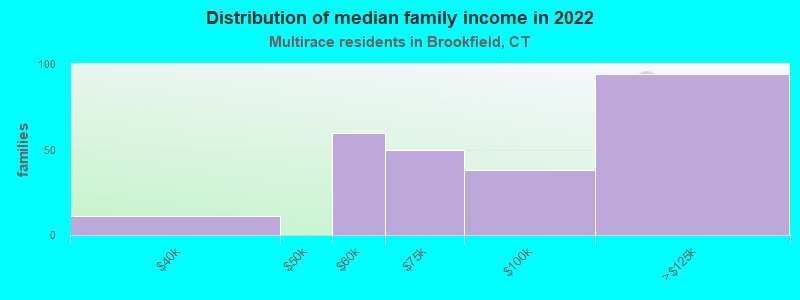
Income statistics for Multirace residents
Median household income in Brookfield, CT in 2022:| Brookfield: | $130,882 |
| State: | $77,277 |
Change in median household income between 2000 and 2022:| Brookfield, Connecticut: | +119.4% |
| State: | +113.6% |
Number of households with income < $10k:| Brookfield: | 6.0% (12,291) |
| State: | 6.0% (7,457) |
Number of households with income $10k - 20k:| Brookfield: | 8.1% (16,712) |
| State: | 8.1% (10,139) |
Number of households with income $20k - 30k:| Brookfield: | 7.0% (14,343) |
| State: | 7.0% (8,702) |
Number of households with income $30k - 40k:| Brookfield: | 6.9% (14,086) |
| Connecticut: | 6.9% (8,546) |
Number of households with income $40k - 50k:| Brookfield: | 7.0% (14,360) |
| State: | 7.0% (8,712) |
Number of households with income $50k - 60k:| Brookfield: | 5.9% (12,083) |
| State: | 5.9% (7,331) |
Number of households with income $60k - 75k:| Brookfield: | 8.5% (17,527) |
| State: | 8.5% (10,634) |
Number of households with income $75k - 100k:| Brookfield: | 14.1% (29,009) |
| State: | 14.1% (17,600) |
Number of households with income $100k - 125k:| Brookfield: | 9.9% (20,410) |
| Connecticut: | 9.9% (12,383) |
Number of households with income $125k - 150k:| Brookfield: | 7.2% (14,704) |
| State: | 7.2% (8,921) |
Number of households with income $150k - 200k:| Brookfield: | 8.8% (18,002) |
| Connecticut: | 8.8% (10,922) |
Number of households with income > $200k:| Brookfield: | 10.6% (21,834) |
| State: | 10.6% (13,247) |
Aggregate household income in Brookfield in 2022: $50,504,778
Median family income in Brookfield in 2022:| Brookfield: | $150,834 |
| Connecticut: | $84,255 |
Number of families with income $30k - 40k:| Brookfield: | 4.5% (11) |
| State: | 6.8% (5,759) |
Number of families with income $50k - 60k:| Brookfield: | 23.5% (59) |
| State: | 7.6% (6,420) |
Number of families with income $60k - 75k:| Brookfield: | 19.6% (50) |
| State: | 7.8% (6,550) |
Number of families with income $75k - 100k:| Brookfield: | 15.0% (38) |
| Connecticut: | 14.5% (12,236) |
Number of families with income $100k - 125k:| Brookfield: | 37.4% (94) |
| State: | 9.2% (7,787) |
Median non-family income in Brookfield in 2022:| Brookfield: | $104,937 |
| State: | $44,462 |
Change in median non-family income between 2000 and 2022:| Brookfield, Connecticut: | +81.0% |
| Connecticut: | +97.6% |
Median per capita income in Brookfield in 2022:| Brookfield: | $36,826 |
| State: | $32,794 |
Change in median per capita income between 2000 and 2022:| Brookfield, Connecticut: | +95.5% |
| Connecticut: | +117.2% |
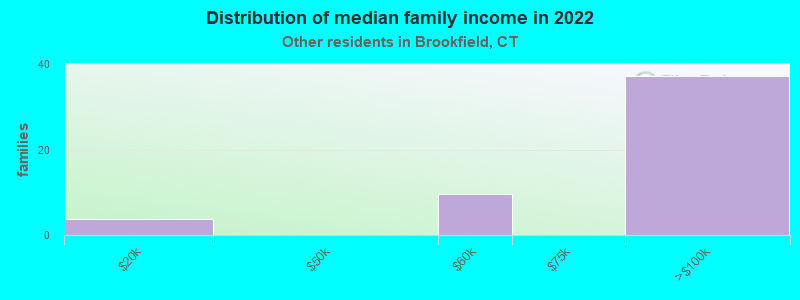
Income statistics for other residents
Number of households with income < $10k:| Brookfield: | 8.8% (5) |
| State: | 9.0% (8,596) |
Number of households with income $10k - 20k:| Brookfield: | 10.5% (6) |
| State: | 10.2% (9,773) |
Number of households with income $20k - 30k:| Brookfield: | 8.8% (5) |
| State: | 9.1% (8,691) |
Number of households with income $30k - 40k:| Brookfield: | 7.0% (4) |
| State: | 7.8% (7,447) |
Number of households with income $40k - 50k:| Brookfield: | 8.8% (5) |
| State: | 8.2% (7,860) |
Number of households with income $50k - 60k:| Brookfield: | 5.3% (3) |
| State: | 6.0% (5,757) |
Number of households with income $60k - 75k:| Brookfield: | 8.8% (5) |
| Connecticut: | 9.3% (8,942) |
Number of households with income $75k - 100k:| Brookfield: | 14.0% (8) |
| Connecticut: | 14.3% (13,700) |
Number of households with income $100k - 125k:| Brookfield: | 7.0% (4) |
| Connecticut: | 7.2% (6,906) |
Number of households with income $125k - 150k:| Brookfield: | 7.0% (4) |
| Connecticut: | 6.5% (6,215) |
Number of households with income $150k - 200k:| Brookfield: | 7.0% (4) |
| Connecticut: | 6.1% (5,865) |
Number of households with income > $200k:| Brookfield: | 7.0% (4) |
| State: | 6.3% (6,065) |
Aggregate household income in Brookfield in 2022: $8,122,723
Median family income in Brookfield in 2022:| Brookfield: | $121,897 |
| State: | $67,610 |
Number of families with income $10k - 20k:| Brookfield: | 7.3% (4) |
| Connecticut: | 7.5% (4,961) |
Number of families with income $50k - 60k:| Brookfield: | 18.9% (10) |
| State: | 5.9% (3,868) |
Number of families with income $75k - 100k:| Brookfield: | 73.9% (37) |
| State: | 15.7% (10,362) |
Median per capita income in Brookfield in 2022:| Brookfield: | $40,708 |
| Connecticut: | $29,353 |