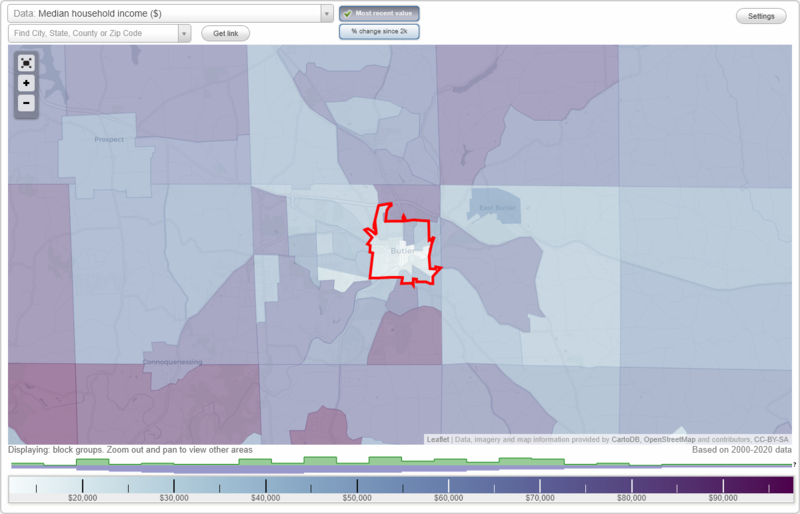
The median household income in Butler, PA in 2022 was $38,793, which was 85.1% less than the median annual income of $71,798 across the entire state of Pennsylvania. Compared to the median income of $25,154 in 2000 this represents an increase of 35.2%. The per capita income in 2022 was $25,606, which means an increase of 35.7% compared to 2000 when it was $16,457.
Whole page based on the data from 2000 / 2022 when the population of Butler, Pennsylvania was 15,121 / 13,575
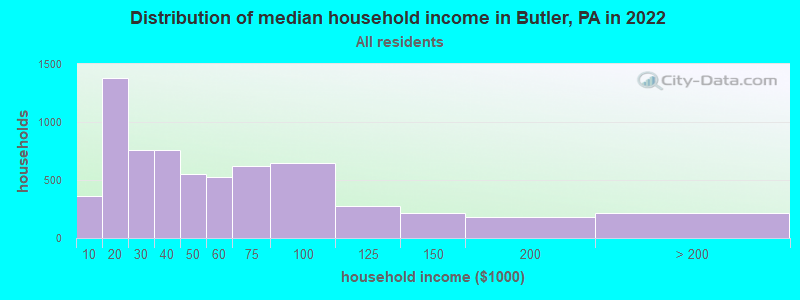
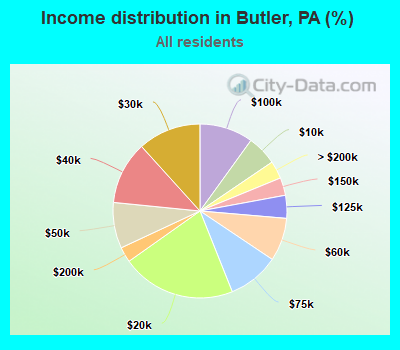
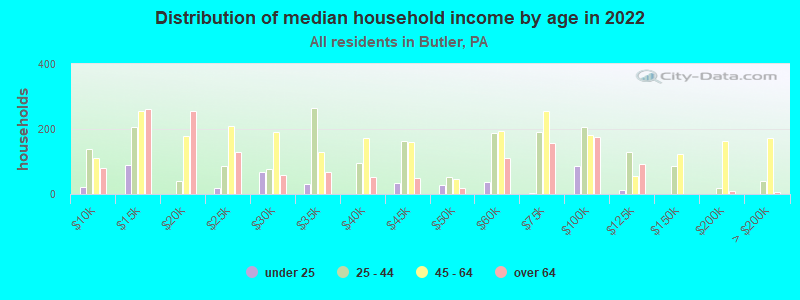
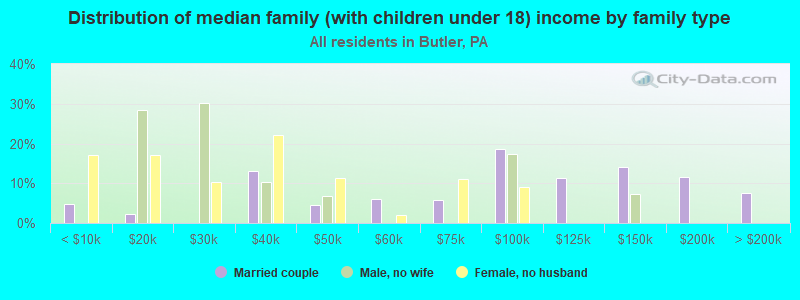
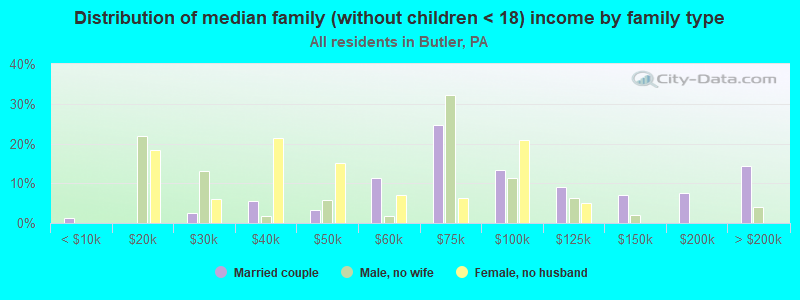
Income statistics for all residents
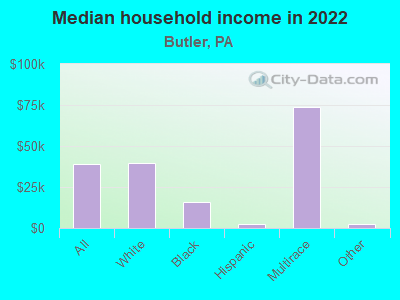
Median household income in Butler, PA in 2022:
Butler:
$38,793
Pennsylvania:
$71,798
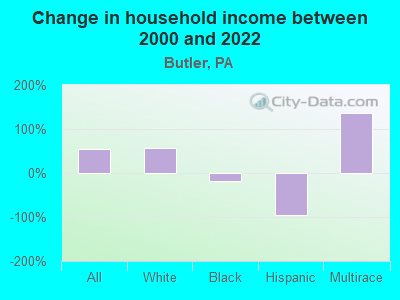
Change in median household income between 2000 and 2022:
Butler, Pennsylvania:
+54.2%
Pennsylvania:
+79.0%
Number of households with income < $10k:
Butler:
5.6% (361)
State:
5.5% (291,562)
Number of households with income $10k - 20k:
Butler:
21.3% (1,379)
State:
7.3% (384,726)
Number of households with income $20k - 30k:
Butler:
11.7% (759)
State:
7.4% (389,464)
Number of households with income $30k - 40k:
Butler:
11.7% (761)
State:
7.6% (402,138)
Number of households with income $40k - 50k:
Butler:
8.5% (553)
Pennsylvania:
7.3% (387,945)
Number of households with income $50k - 60k:
Butler:
8.0% (522)
Pennsylvania:
7.0% (372,468)
Number of households with income $60k - 75k:
Butler:
9.5% (619)
State:
9.9% (524,786)
Number of households with income $75k - 100k:
Butler:
10.0% (646)
State:
12.6% (666,253)
Number of households with income $100k - 125k:
Butler:
4.3% (277)
Pennsylvania:
9.9% (526,402)
Number of households with income $125k - 150k:
Butler:
3.3% (213)
Pennsylvania:
6.9% (362,702)
Number of households with income $150k - 200k:
Butler:
2.9% (185)
State:
8.3% (440,827)
Number of households with income > $200k:
Butler:
3.3% (214)
State:
10.3% (544,792)
Aggregate household income in Butler in 2022: $341,791,494
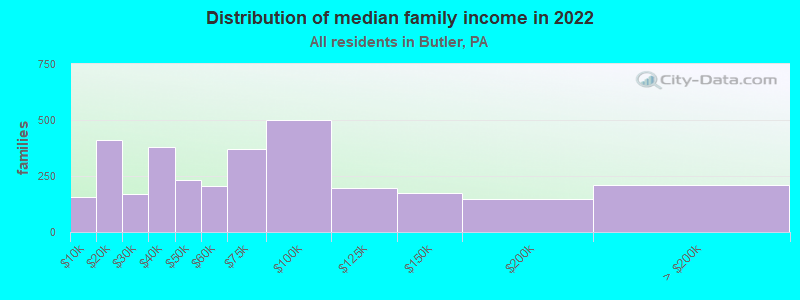
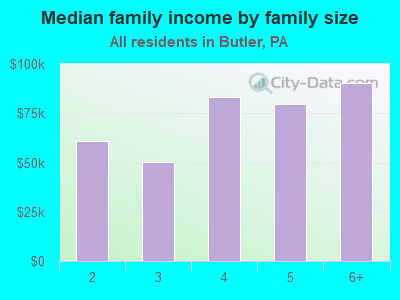
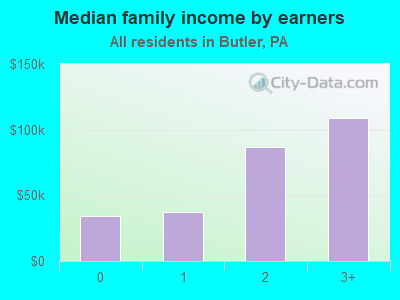
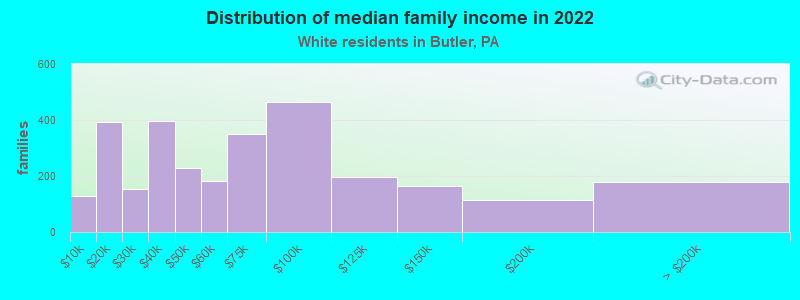
Median family income in Butler in 2022:
Butler:
$63,603
State:
$93,029
Number of families with income < $10k:
Butler:
5.0% (156)
Pennsylvania:
3.1% (101,868)
Number of families with income $10k - 20k:
Butler:
13.0% (412)
State:
3.5% (115,881)
Number of families with income $20k - 30k:
Butler:
5.4% (171)
State:
4.8% (156,521)
Number of families with income $30k - 40k:
Butler:
12.1% (381)
State:
5.8% (191,305)
Number of families with income $40k - 50k:
Butler:
7.4% (234)
Pennsylvania:
6.4% (211,380)
Number of families with income $50k - 60k:
Butler:
6.5% (206)
Pennsylvania:
6.4% (209,910)
Number of families with income $60k - 75k:
Butler:
11.7% (369)
State:
9.7% (318,991)
Number of families with income $75k - 100k:
Butler:
15.9% (501)
Pennsylvania:
14.0% (461,021)
Number of families with income $100k - 125k:
Butler:
6.3% (198)
State:
12.2% (400,961)
Number of families with income $125k - 150k:
Butler:
5.5% (175)
Pennsylvania:
8.8% (288,471)
Number of families with income $150k - 200k:
Butler:
4.6% (147)
State:
11.2% (367,642)
Number of families with income > $200k:
Butler:
6.6% (209)
State:
14.3% (470,863)
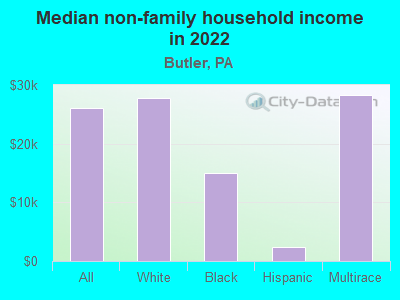
Median non-family income in Butler in 2022:
Butler:
$26,059
Pennsylvania:
$42,203
Change in median non-family income between 2000 and 2022:
Butler, Pennsylvania:
+46.5%
Pennsylvania:
+90.1%
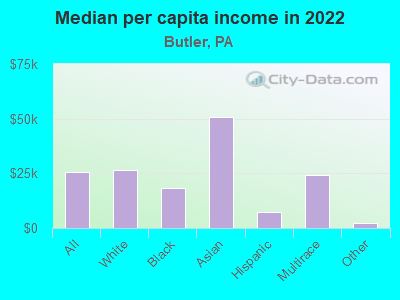
Median per capita income in Butler in 2022:
Butler:
$25,606
State:
$41,489
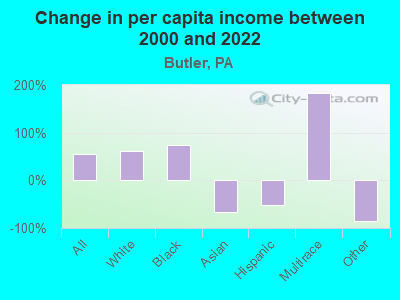
Change in median per capita income between 2000 and 2022:
Butler, Pennsylvania:
+55.6%
State:
+98.7%
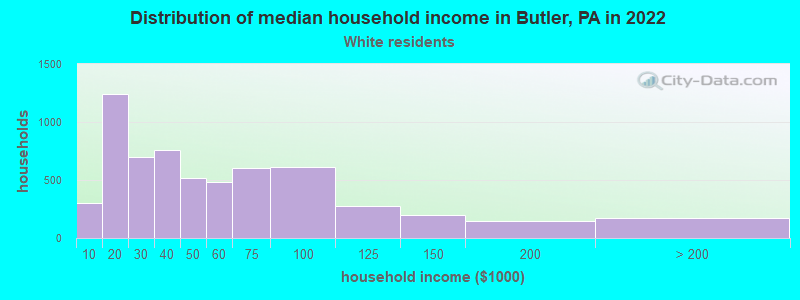
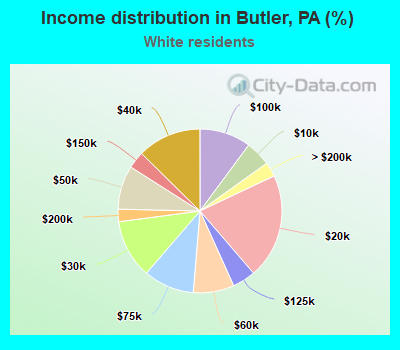
Income statistics for White residents
Median household income in Butler, PA in 2022:
Butler:
$39,712
State:
$76,765
Change in median household income between 2000 and 2022:
Butler, Pennsylvania:
+55.8%
State:
+84.3%
Number of households with income < $10k:
Butler:
5.0% (300)
State:
4.3% (179,792)
Number of households with income $10k - 20k:
Butler:
20.7% (1,242)
State:
6.5% (268,738)
Number of households with income $20k - 30k:
Butler:
11.6% (694)
State:
7.0% (288,138)
Number of households with income $30k - 40k:
Butler:
12.6% (758)
State:
7.2% (300,208)
Number of households with income $40k - 50k:
Butler:
8.6% (519)
Pennsylvania:
7.2% (298,756)
Number of households with income $50k - 60k:
Butler:
8.0% (483)
State:
6.8% (283,251)
Number of households with income $60k - 75k:
Butler:
10.0% (601)
State:
9.9% (408,159)
Number of households with income $75k - 100k:
Butler:
10.1% (608)
State:
13.2% (547,809)
Number of households with income $100k - 125k:
Butler:
4.6% (275)
State:
10.5% (436,652)
Number of households with income $125k - 150k:
Butler:
3.3% (201)
State:
7.3% (304,132)
Number of households with income $150k - 200k:
Butler:
2.5% (148)
State:
9.0% (374,658)
Number of households with income > $200k:
Butler:
2.9% (172)
Pennsylvania:
10.9% (452,618)
Aggregate household income in Butler in 2022: $309,224,663
Median family income in Butler in 2022:
Butler:
$62,745
Pennsylvania:
$99,396
Number of families with income < $10k:
Butler:
4.4% (130)
State:
2.2% (56,136)
Number of families with income $10k - 20k:
Butler:
13.3% (392)
State:
2.7% (69,032)
Number of families with income $20k - 30k:
Butler:
5.2% (152)
State:
3.9% (100,065)
Number of families with income $30k - 40k:
Butler:
13.5% (398)
Pennsylvania:
5.2% (134,367)
Number of families with income $40k - 50k:
Butler:
7.7% (227)
State:
6.0% (154,327)
Number of families with income $50k - 60k:
Butler:
6.2% (183)
Pennsylvania:
6.1% (157,983)
Number of families with income $60k - 75k:
Butler:
11.9% (349)
Pennsylvania:
9.6% (249,292)
Number of families with income $75k - 100k:
Butler:
15.8% (464)
State:
14.7% (379,316)
Number of families with income $100k - 125k:
Butler:
6.7% (196)
State:
12.9% (333,626)
Number of families with income $125k - 150k:
Butler:
5.6% (165)
State:
9.4% (243,915)
Number of families with income $150k - 200k:
Butler:
3.9% (114)
State:
12.2% (314,926)
Number of families with income > $200k:
Butler:
6.0% (177)
Pennsylvania:
15.1% (390,885)
Median non-family income in Butler in 2022:
Butler:
$27,867
Pennsylvania:
$44,251
Change in median non-family income between 2000 and 2022:
Butler, Pennsylvania:
+58.6%
Pennsylvania:
+94.2%
Median per capita income in Butler in 2022:
Butler:
$26,574
State:
$45,306
Change in median per capita income between 2000 and 2022:
Butler, Pennsylvania:
+61.8%
State:
+105.4%
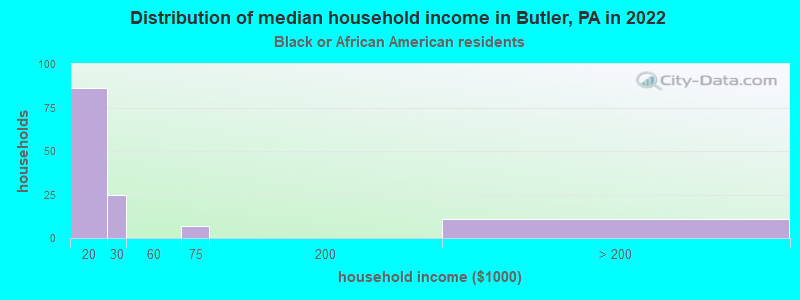
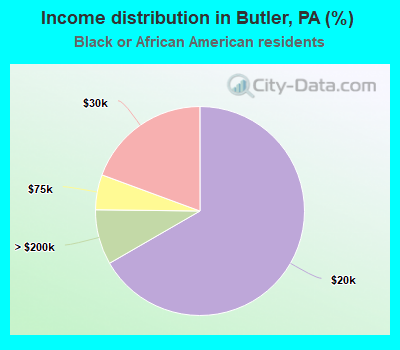
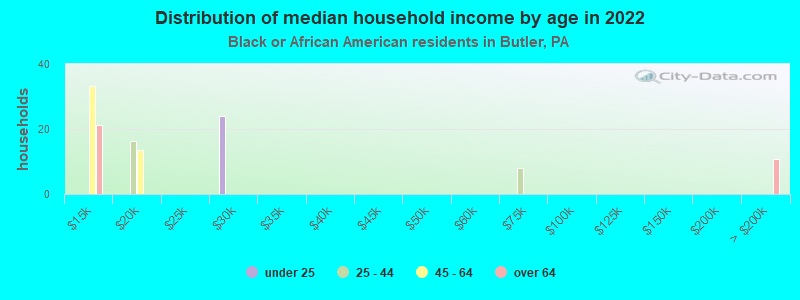
Income statistics for Black or African American residents
Median household income in Butler, PA in 2022:
Butler:
$15,875
State:
$46,564
Change in median household income between 2000 and 2022:: -17.5%
Butler, Pennsylvania:
-17.5%
State:
+69.8%
Number of households with income < $10k:
Butler:
0.0% (0)
State:
12.0% (64,705)
Number of households with income $10k - 20k:
Butler:
66.7% (86)
Pennsylvania:
12.7% (68,459)
Number of households with income $20k - 30k:
Butler:
19.4% (25)
State:
9.3% (49,778)
Number of households with income $30k - 40k:
Butler:
0.0% (0)
Pennsylvania:
10.0% (53,629)
Number of households with income $40k - 50k:
Butler:
0.0% (0)
Pennsylvania:
8.5% (45,601)
Number of households with income $50k - 60k:
Butler:
0.0% (0)
Pennsylvania:
7.8% (41,725)
Number of households with income $60k - 75k:
Butler:
5.4% (7)
Pennsylvania:
10.4% (55,653)
Number of households with income $75k - 100k:
Butler:
0.0% (0)
State:
9.5% (51,281)
Number of households with income $100k - 125k:
Butler:
0.0% (0)
State:
7.1% (38,125)
Number of households with income $125k - 150k:
Butler:
0.0% (0)
Pennsylvania:
4.5% (24,172)
Number of households with income $150k - 200k:
Butler:
0.0% (0)
Pennsylvania:
4.0% (21,749)
Number of households with income > $200k:
Butler:
8.5% (11)
State:
4.2% (22,562)
Aggregate household income in Butler in 2022: $7,974,451
Median non-family income in Butler in 2022:
Butler:
$15,048
State:
$30,767
Change in median non-family income between 2000 and 2022:: -34.7%
Butler, Pennsylvania:
-34.7%
State:
+75.1%
Median per capita income in Butler in 2022:
Butler:
$18,383
State:
$28,010
Change in median per capita income between 2000 and 2022:
Butler, Pennsylvania:
+73.5%
State:
+101.5%
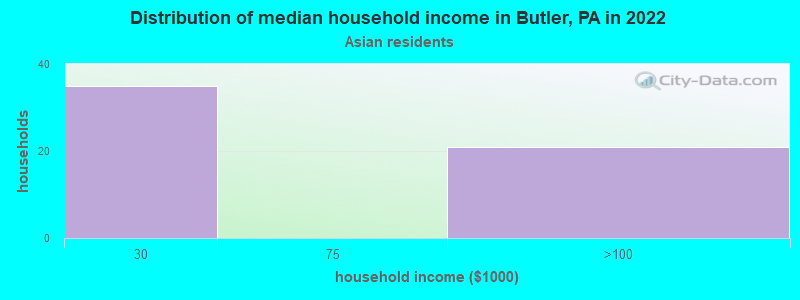
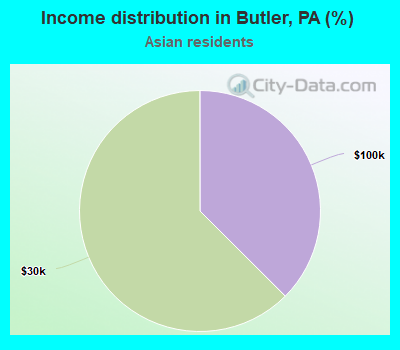
Income statistics for Asian residents
Number of households with income < $10k:
Butler:
0.0% (0)
State:
5.8% (9,650)
Number of households with income $10k - 20k:
Butler:
0.0% (0)
Pennsylvania:
4.3% (7,158)
Number of households with income $20k - 30k:
Butler:
62.5% (35)
State:
5.7% (9,531)
Number of households with income $30k - 40k:
Butler:
0.0% (0)
State:
5.7% (9,580)
Number of households with income $40k - 50k:
Butler:
0.0% (0)
State:
5.4% (9,050)
Number of households with income $50k - 60k:
Butler:
0.0% (0)
Pennsylvania:
6.1% (10,189)
Number of households with income $60k - 75k:
Butler:
0.0% (0)
State:
7.8% (13,008)
Number of households with income $75k - 100k:
Butler:
37.5% (21)
Pennsylvania:
10.1% (16,923)
Number of households with income $100k - 125k:
Butler:
0.0% (0)
State:
8.8% (14,765)
Number of households with income $125k - 150k:
Butler:
0.0% (0)
Pennsylvania:
7.5% (12,634)
Number of households with income $150k - 200k:
Butler:
0.0% (0)
State:
10.0% (16,823)
Number of households with income > $200k:
Butler:
0.0% (0)
State:
22.9% (38,426)
Aggregate household income in Butler in 2022: $14,233,340
Median per capita income in Butler in 2022:
Butler:
$50,556
Pennsylvania:
$48,341
Change in median per capita income between 2000 and 2022:: -67.4%
Butler, Pennsylvania:
-67.4%
State:
+140.6%
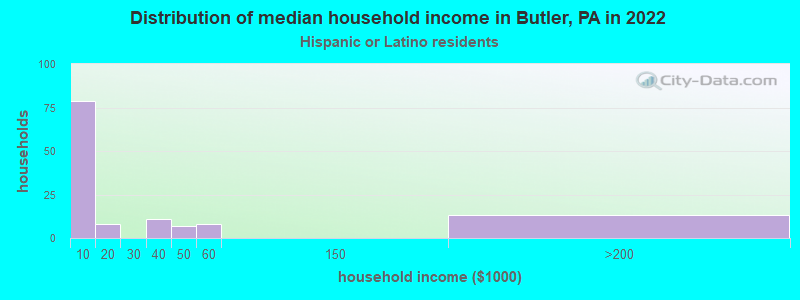
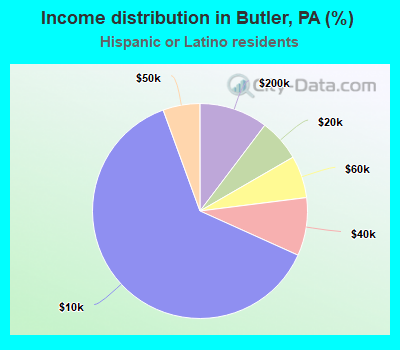
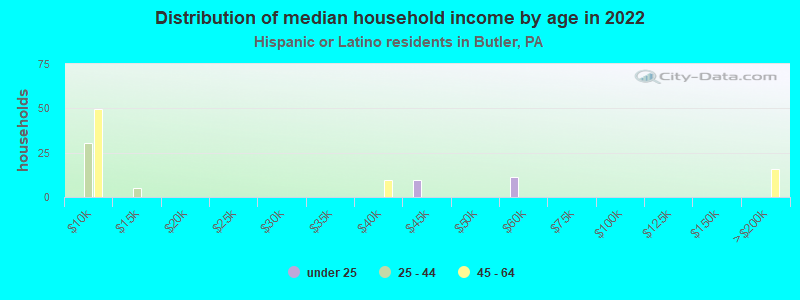
Income statistics for Hispanic or Latino residents
Median household income in Butler, PA in 2022:
Butler:
$2,416
State:
$55,478
Change in median household income between 2000 and 2022:: -94.9%
Butler, Pennsylvania:
-94.9%
Pennsylvania:
+106.0%
Number of households with income < $10k:
Butler:
62.7% (79)
State:
8.7% (29,517)
Number of households with income $10k - 20k:
Butler:
6.3% (8)
Pennsylvania:
10.0% (33,785)
Number of households with income $20k - 30k:
Butler:
0.0% (0)
State:
9.9% (33,399)
Number of households with income $30k - 40k:
Butler:
8.7% (11)
Pennsylvania:
8.8% (29,878)
Number of households with income $40k - 50k:
Butler:
5.6% (7)
State:
8.5% (28,549)
Number of households with income $50k - 60k:
Butler:
6.3% (8)
State:
7.6% (25,792)
Number of households with income $60k - 75k:
Butler:
0.0% (0)
Pennsylvania:
10.6% (35,808)
Number of households with income $75k - 100k:
Butler:
0.0% (0)
State:
11.9% (40,287)
Number of households with income $100k - 125k:
Butler:
0.0% (0)
State:
8.0% (27,028)
Number of households with income $125k - 150k:
Butler:
0.0% (0)
State:
5.2% (17,622)
Number of households with income $150k - 200k:
Butler:
10.3% (13)
Pennsylvania:
5.2% (17,563)
Number of households with income > $200k:
Butler:
0.0% (0)
Pennsylvania:
5.5% (18,469)
Aggregate household income in Butler in 2022: $3,169,096
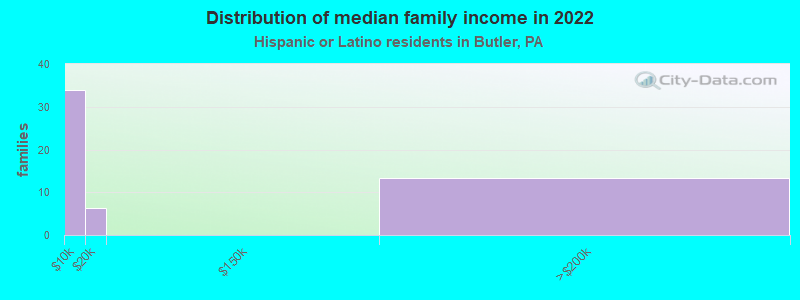
Median family income in Butler in 2022:
Butler:
$1,793
State:
$58,810
Number of families with income < $10k:
Butler:
63.3% (34)
State:
7.4% (17,586)
Number of families with income $10k - 20k:
Butler:
11.7% (6)
State:
8.2% (19,487)
Number of families with income $150k - 200k:
Butler:
25.0% (13)
State:
5.7% (13,484)
Median non-family income in Butler in 2022:
Butler:
$2,396
Pennsylvania:
$34,664
Median per capita income in Butler in 2022:
Butler:
$7,327
State:
$23,829
Change in median per capita income between 2000 and 2022:: -52.1%
Butler, Pennsylvania:
-52.1%
State:
+116.4%
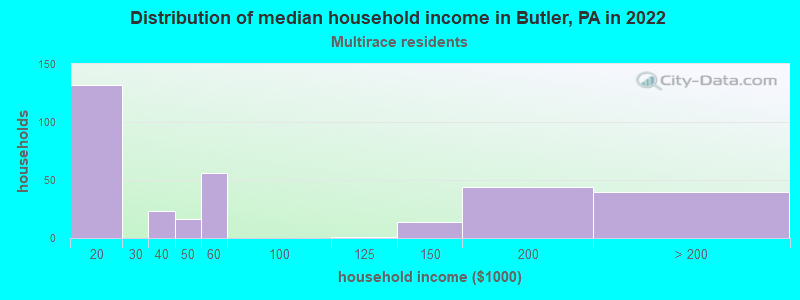
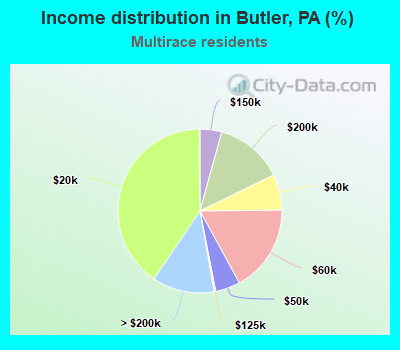
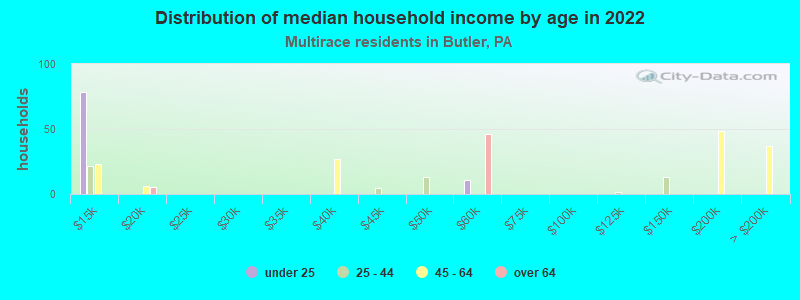
Income statistics for Multirace residents
Median household income in Butler, PA in 2022:
Butler:
$73,619
State:
$61,450
Change in median household income between 2000 and 2022:
Butler, Pennsylvania:
+136.0%
State:
+103.9%
Number of households with income < $10k:
Butler:
0.0% (0)
State:
7.8% (21,911)
Number of households with income $10k - 20k:
Butler:
40.5% (132)
Pennsylvania:
8.2% (22,847)
Number of households with income $20k - 30k:
Butler:
0.0% (0)
State:
8.7% (24,252)
Number of households with income $30k - 40k:
Butler:
7.1% (23)
State:
7.3% (20,502)
Number of households with income $40k - 50k:
Butler:
4.9% (16)
Pennsylvania:
7.7% (21,525)
Number of households with income $50k - 60k:
Butler:
17.2% (56)
State:
8.6% (24,174)
Number of households with income $60k - 75k:
Butler:
0.0% (0)
State:
11.9% (33,350)
Number of households with income $75k - 100k:
Butler:
0.0% (0)
Pennsylvania:
11.5% (32,274)
Number of households with income $100k - 125k:
Butler:
0.3% (1)
State:
8.3% (23,361)
Number of households with income $125k - 150k:
Butler:
4.3% (14)
State:
5.3% (14,784)
Number of households with income $150k - 200k:
Butler:
13.5% (44)
State:
6.9% (19,314)
Number of households with income > $200k:
Butler:
12.3% (40)
State:
7.8% (21,759)
Aggregate household income in Butler in 2022: $44,029,578
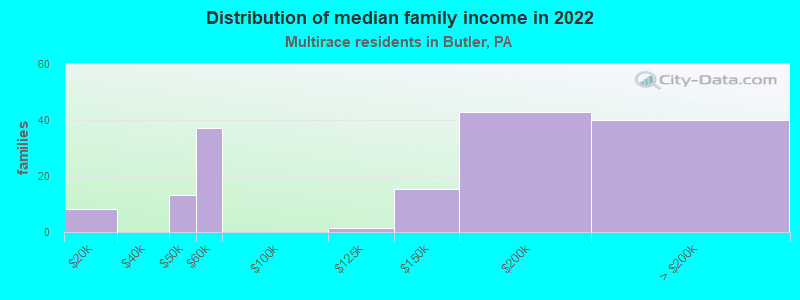
Median family income in Butler in 2022:
Butler:
$166,120
Pennsylvania:
$70,158
Number of families with income $10k - 20k:
Butler:
5.2% (8)
State:
6.0% (10,561)
Number of families with income $40k - 50k:
Butler:
8.3% (13)
Pennsylvania:
7.9% (13,877)
Number of families with income $50k - 60k:
Butler:
23.6% (37)
State:
7.1% (12,449)
Number of families with income $100k - 125k:
Butler:
0.9% (1)
State:
9.5% (16,618)
Number of families with income $125k - 150k:
Butler:
9.7% (15)
State:
6.8% (11,900)
Number of families with income $150k - 200k:
Butler:
27.1% (43)
Pennsylvania:
8.3% (14,537)
Number of families with income > $200k:
Butler:
25.2% (40)
State:
10.1% (17,694)
Median non-family income in Butler in 2022:
Butler:
$28,365
State:
$44,157
Change in median non-family income between 2000 and 2022:: -7.0%
Butler, Pennsylvania:
-7.0%
Pennsylvania:
+129.2%
Median per capita income in Butler in 2022:
Butler:
$24,255
State:
$27,581
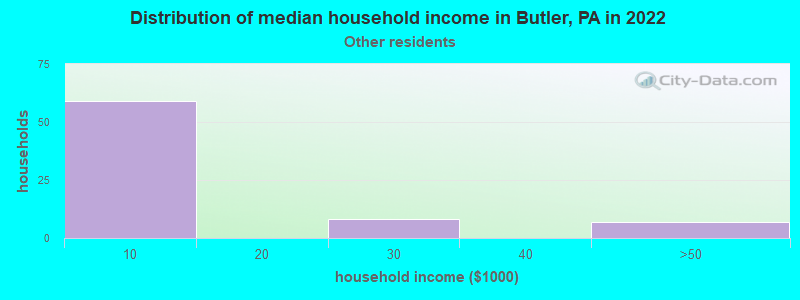
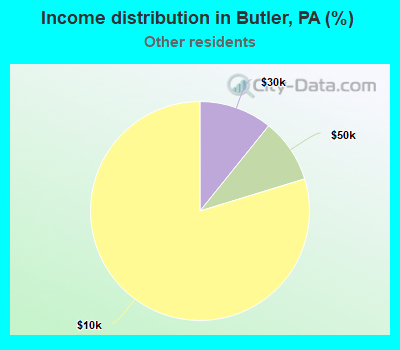
Income statistics for other residents
Median household income in Butler, PA in 2022:
Butler:
$2,690
State:
$50,032
Number of households with income < $10k:
Butler:
79.7% (59)
Pennsylvania:
9.2% (14,206)
Number of households with income $10k - 20k:
Butler:
0.0% (0)
Pennsylvania:
11.0% (17,038)
Number of households with income $20k - 30k:
Butler:
10.8% (8)
State:
11.0% (17,000)
Number of households with income $30k - 40k:
Butler:
0.0% (0)
State:
11.0% (17,022)
Number of households with income $40k - 50k:
Butler:
9.5% (7)
State:
7.7% (11,829)
Number of households with income $50k - 60k:
Butler:
0.0% (0)
State:
8.0% (12,320)
Number of households with income $60k - 75k:
Butler:
0.0% (0)
State:
8.8% (13,590)
Number of households with income $75k - 100k:
Butler:
0.0% (0)
Pennsylvania:
10.5% (16,166)
Number of households with income $100k - 125k:
Butler:
0.0% (0)
Pennsylvania:
8.0% (12,371)
Number of households with income $125k - 150k:
Butler:
0.0% (0)
State:
4.0% (6,190)
Number of households with income $150k - 200k:
Butler:
0.0% (0)
Pennsylvania:
5.1% (7,862)
Number of households with income > $200k:
Butler:
0.0% (0)
Pennsylvania:
5.6% (8,691)
Aggregate household income in Butler in 2022: $513,087
Median per capita income in Butler in 2022:
Butler:
$2,392
State:
$24,779
Change in median per capita income between 2000 and 2022:: -85.8%
Butler, Pennsylvania:
-85.8%
Pennsylvania:
+157.6%
Discuss Butler, Pennsylvania (PA) on our hugely popular Pennsylvania forum.