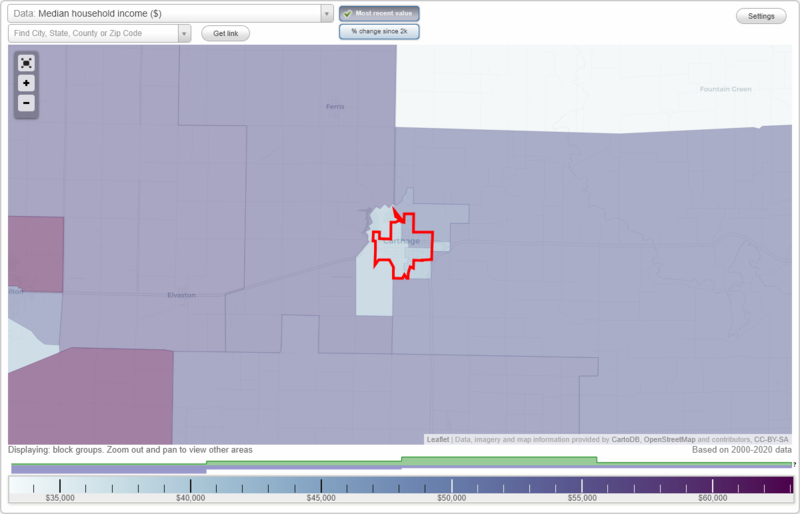
The median household income in Carthage, IL in 2022 was $74,291, which was 3.3% less than the median annual income of $76,708 across the entire state of Illinois. Compared to the median income of $34,677 in 2000 this represents an increase of 53.3%. The per capita income in 2022 was $41,269, which means an increase of 55.7% compared to 2000 when it was $18,269.
Whole page based on the data from 2000 / 2022 when the population of Carthage, Illinois was 2,725 / 2,525
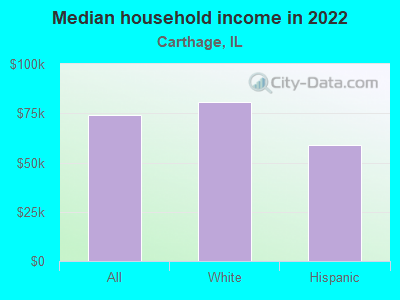
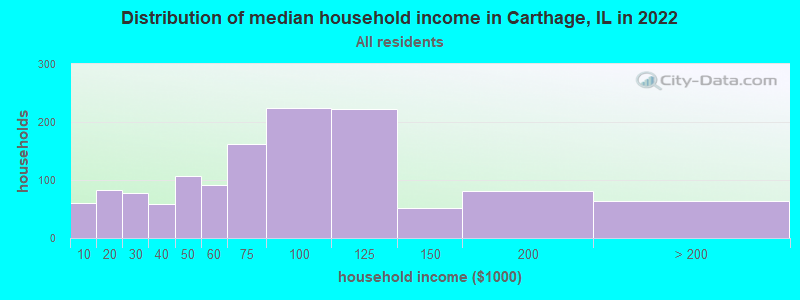
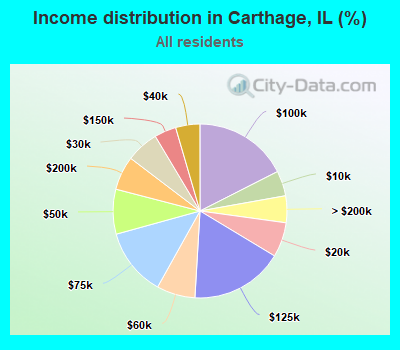
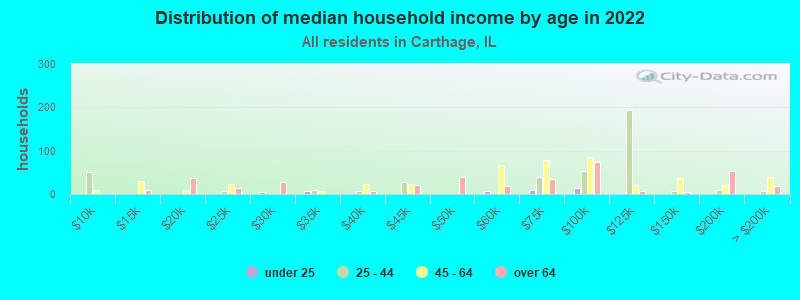
Income statistics for all residents
Median household income in Carthage, IL in 2022:
Carthage:
$74,291
Illinois:
$76,708
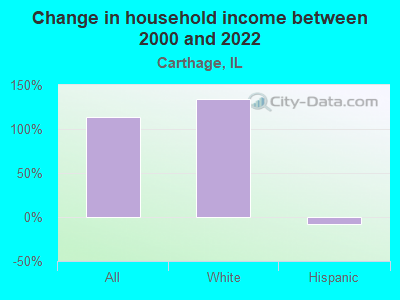
Change in median household income between 2000 and 2022:
Carthage, Illinois:
+114.2%
State:
+64.6%
Number of households with income < $10k:
Carthage:
4.7% (60)
State:
5.9% (296,090)
Number of households with income $10k - 20k:
Carthage:
6.5% (83)
State:
6.6% (333,259)
Number of households with income $20k - 30k:
Carthage:
6.1% (78)
Illinois:
6.8% (342,921)
Number of households with income $30k - 40k:
Carthage:
4.5% (58)
State:
7.0% (355,254)
Number of households with income $40k - 50k:
Carthage:
8.3% (107)
State:
6.7% (340,678)
Number of households with income $50k - 60k:
Carthage:
7.2% (92)
State:
6.7% (339,405)
Number of households with income $60k - 75k:
Carthage:
12.6% (162)
Illinois:
9.2% (465,709)
Number of households with income $75k - 100k:
Carthage:
17.5% (225)
State:
12.9% (651,353)
Number of households with income $100k - 125k:
Carthage:
17.3% (222)
State:
10.3% (522,359)
Number of households with income $125k - 150k:
Carthage:
4.0% (52)
Illinois:
7.3% (367,136)
Number of households with income $150k - 200k:
Carthage:
6.3% (81)
State:
9.0% (455,249)
Number of households with income > $200k:
Carthage:
5.0% (64)
State:
11.6% (586,947)
Aggregate household income in Carthage in 2022: $104,514,355
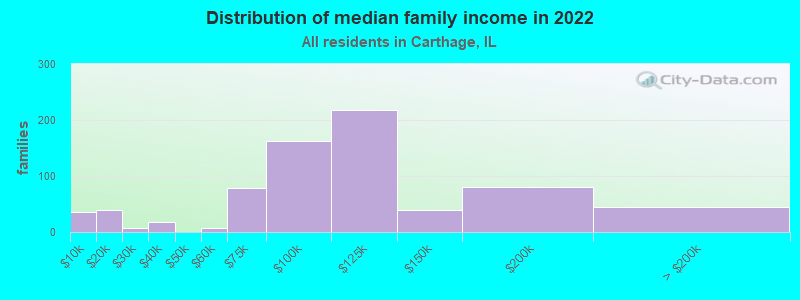
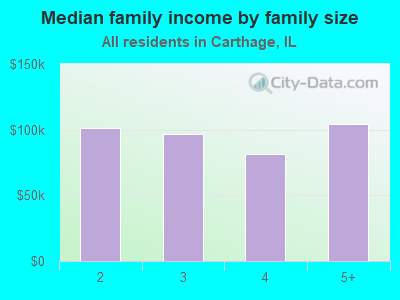
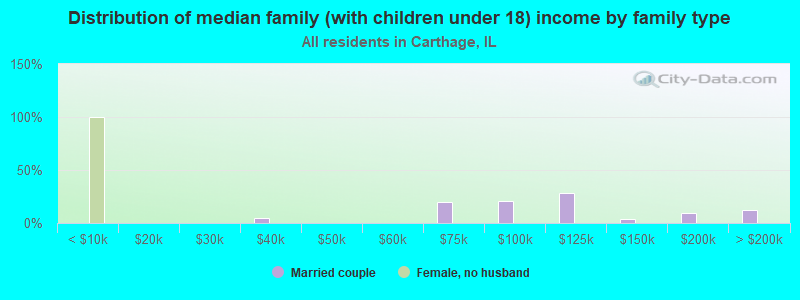
Median family income in Carthage in 2022:
Carthage:
$100,586
State:
$96,948
Number of families with income < $10k:
Carthage:
4.8% (35)
State:
3.4% (105,875)
Number of families with income $10k - 20k:
Carthage:
5.4% (40)
Illinois:
3.3% (105,017)
Number of families with income $20k - 30k:
Carthage:
1.1% (8)
State:
4.7% (146,403)
Number of families with income $30k - 40k:
Carthage:
2.4% (17)
Illinois:
5.3% (167,069)
Number of families with income $50k - 60k:
Carthage:
1.0% (7)
State:
6.1% (191,561)
Number of families with income $60k - 75k:
Carthage:
10.8% (79)
State:
9.0% (282,985)
Number of families with income $75k - 100k:
Carthage:
22.3% (163)
Illinois:
13.8% (432,725)
Number of families with income $100k - 125k:
Carthage:
29.7% (218)
State:
11.9% (373,296)
Number of families with income $125k - 150k:
Carthage:
5.4% (40)
Illinois:
8.9% (279,791)
Number of families with income $150k - 200k:
Carthage:
10.9% (80)
State:
11.9% (372,004)
Number of families with income > $200k:
Carthage:
6.2% (45)
Illinois:
15.9% (500,033)
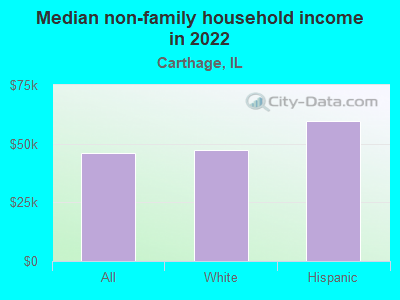
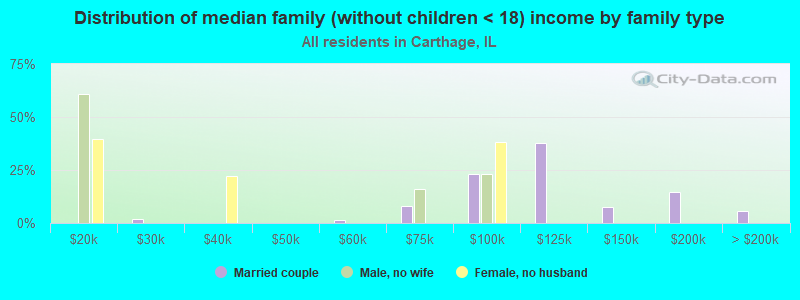
Median non-family income in Carthage in 2022:
Carthage:
$46,150
Illinois:
$46,533
Change in median non-family income between 2000 and 2022:
Carthage, Illinois:
+142.7%
State:
+64.0%
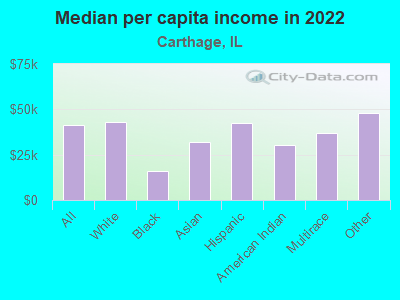
Median per capita income in Carthage in 2022:
Carthage:
$41,269
Illinois:
$43,317
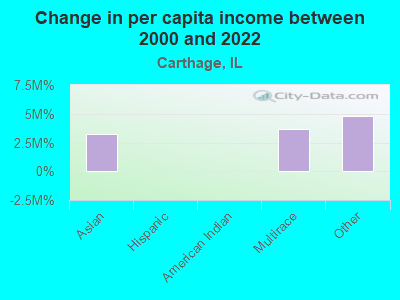
Change in median per capita income between 2000 and 2022:
Carthage, Illinois:
+125.9%
State:
+87.5%
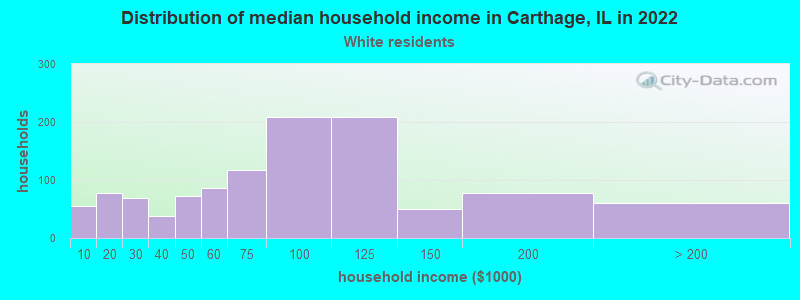
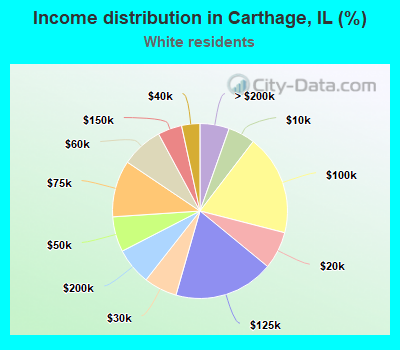
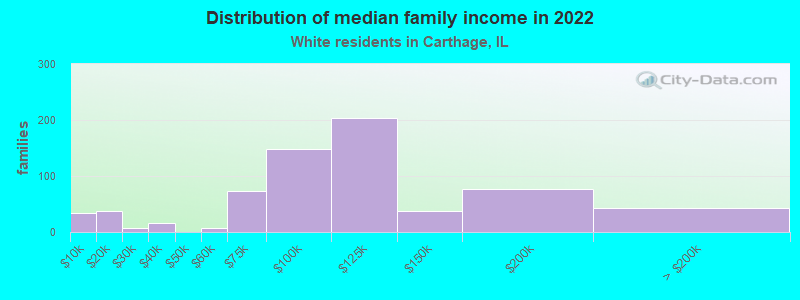
Income statistics for White residents
Median household income in Carthage, IL in 2022:
Carthage:
$80,952
State:
$83,346
Change in median household income between 2000 and 2022:
Carthage, Illinois:
+133.7%
State:
+67.5%
Number of households with income < $10k:
Carthage:
5.0% (56)
State:
4.5% (149,895)
Number of households with income $10k - 20k:
Carthage:
6.9% (78)
State:
5.5% (184,529)
Number of households with income $20k - 30k:
Carthage:
6.1% (69)
State:
6.1% (205,767)
Number of households with income $30k - 40k:
Carthage:
3.4% (38)
State:
6.7% (225,572)
Number of households with income $40k - 50k:
Carthage:
6.5% (73)
Illinois:
6.5% (216,965)
Number of households with income $50k - 60k:
Carthage:
7.7% (87)
State:
6.6% (222,841)
Number of households with income $60k - 75k:
Carthage:
10.5% (118)
State:
9.3% (312,758)
Number of households with income $75k - 100k:
Carthage:
18.6% (209)
State:
12.9% (433,180)
Number of households with income $100k - 125k:
Carthage:
18.5% (208)
State:
10.7% (360,753)
Number of households with income $125k - 150k:
Carthage:
4.4% (50)
State:
7.9% (266,532)
Number of households with income $150k - 200k:
Carthage:
6.9% (77)
Illinois:
10.0% (337,357)
Number of households with income > $200k:
Carthage:
5.4% (61)
State:
13.3% (446,069)
Aggregate household income in Carthage in 2022: $95,245,299
Median family income in Carthage in 2022:
Carthage:
$101,914
State:
$107,938
Number of families with income < $10k:
Carthage:
5.0% (34)
State:
2.2% (45,983)
Number of families with income $10k - 20k:
Carthage:
5.4% (37)
Illinois:
2.5% (50,574)
Number of families with income $20k - 30k:
Carthage:
1.1% (7)
Illinois:
3.5% (70,927)
Number of families with income $30k - 40k:
Carthage:
2.3% (16)
State:
4.4% (90,563)
Number of families with income $50k - 60k:
Carthage:
1.0% (7)
State:
5.8% (119,129)
Number of families with income $60k - 75k:
Carthage:
10.8% (74)
Illinois:
8.8% (179,665)
Number of families with income $75k - 100k:
Carthage:
21.7% (149)
Illinois:
13.5% (276,887)
Number of families with income $100k - 125k:
Carthage:
29.9% (204)
Illinois:
12.5% (256,099)
Number of families with income $125k - 150k:
Carthage:
5.5% (38)
State:
9.8% (199,855)
Number of families with income $150k - 200k:
Carthage:
11.1% (76)
Illinois:
13.4% (274,569)
Number of families with income > $200k:
Carthage:
6.3% (43)
State:
18.6% (381,354)
Median non-family income in Carthage in 2022:
Carthage:
$47,291
State:
$50,934
Change in median non-family income between 2000 and 2022:
Carthage, Illinois:
+148.7%
State:
+70.7%
Median per capita income in Carthage in 2022:
Carthage:
$43,137
State:
$50,738
Change in median per capita income between 2000 and 2022:
Carthage, Illinois:
+134.8%
Illinois:
+95.5%
Income statistics for Black or African American residents
Median per capita income in Carthage in 2022:
Carthage:
$16,204
State:
$28,045
Income statistics for Asian residents
Aggregate household income in Carthage in 2022: $1,072,350
Median per capita income in Carthage in 2022:
Carthage:
$32,169
State:
$52,977
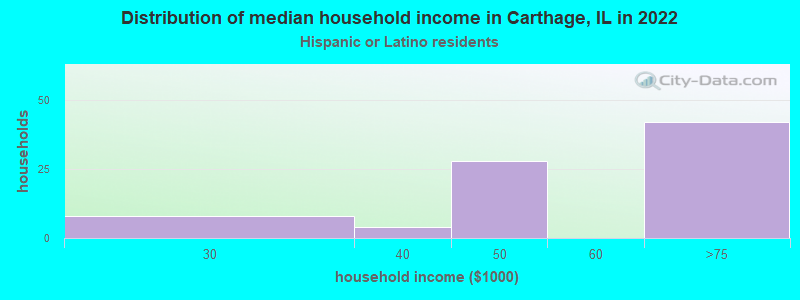
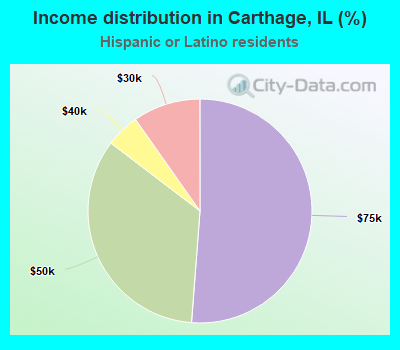
Income statistics for Hispanic or Latino residents
Median household income in Carthage, IL in 2022:
Carthage:
$58,904
Illinois:
$72,139
Change in median household income between 2000 and 2022:: -7.6%
Carthage, Illinois:
-7.6%
State:
+75.7%
Number of households with income < $10k:
Carthage:
0.0% (0)
Illinois:
4.9% (33,145)
Number of households with income $10k - 20k:
Carthage:
0.0% (0)
State:
5.4% (36,345)
Number of households with income $20k - 30k:
Carthage:
9.8% (8)
Illinois:
7.5% (50,677)
Number of households with income $30k - 40k:
Carthage:
4.9% (4)
Illinois:
7.7% (52,008)
Number of households with income $40k - 50k:
Carthage:
34.1% (28)
State:
8.1% (54,702)
Number of households with income $50k - 60k:
Carthage:
0.0% (0)
Illinois:
7.5% (51,062)
Number of households with income $60k - 75k:
Carthage:
51.2% (42)
State:
11.3% (76,576)
Number of households with income $75k - 100k:
Carthage:
0.0% (0)
State:
15.5% (105,152)
Number of households with income $100k - 125k:
Carthage:
0.0% (0)
State:
11.5% (77,760)
Number of households with income $125k - 150k:
Carthage:
0.0% (0)
Illinois:
7.3% (49,310)
Number of households with income $150k - 200k:
Carthage:
0.0% (0)
State:
7.6% (51,233)
Number of households with income > $200k:
Carthage:
0.0% (0)
State:
5.9% (40,028)
Aggregate household income in Carthage in 2022: $4,286,119
Median non-family income in Carthage in 2022:
Carthage:
$59,848
Illinois:
$45,965
Median per capita income in Carthage in 2022:
Carthage:
$42,330
State:
$26,551
Change in median per capita income between 2000 and 2022:: -31.6%
Carthage, Illinois:
-31.6%
Illinois:
+111.0%
Income statistics for American Indian and Alaska Native residents
Median per capita income in Carthage in 2022:
Carthage:
$30,085
State:
$26,979
Change in median per capita income between 2000 and 2022:
Carthage, Illinois:
+62.1%
State:
+64.2%
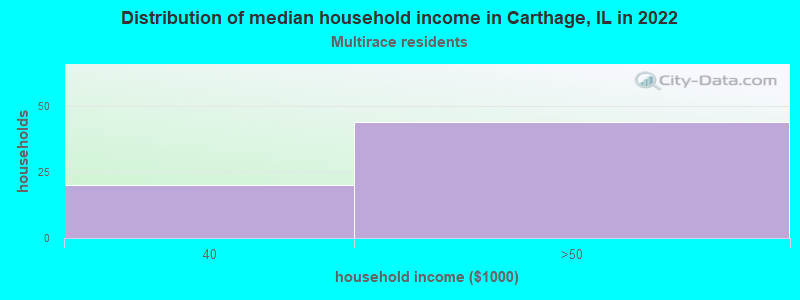
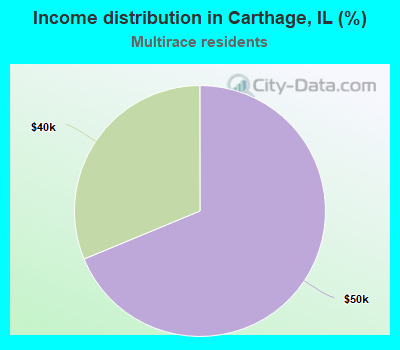
Income statistics for Multirace residents
Number of households with income < $10k:
Carthage:
0.0% (0)
State:
5.3% (21,595)
Number of households with income $10k - 20k:
Carthage:
0.0% (0)
State:
6.5% (26,720)
Number of households with income $20k - 30k:
Carthage:
0.0% (0)
State:
8.0% (32,573)
Number of households with income $30k - 40k:
Carthage:
31.2% (20)
Illinois:
8.4% (34,383)
Number of households with income $40k - 50k:
Carthage:
68.8% (44)
Illinois:
7.4% (30,234)
Number of households with income $50k - 60k:
Carthage:
0.0% (0)
State:
6.9% (28,432)
Number of households with income $60k - 75k:
Carthage:
0.0% (0)
Illinois:
10.2% (41,780)
Number of households with income $75k - 100k:
Carthage:
0.0% (0)
Illinois:
13.0% (53,426)
Number of households with income $100k - 125k:
Carthage:
0.0% (0)
State:
10.5% (43,126)
Number of households with income $125k - 150k:
Carthage:
0.0% (0)
State:
7.6% (31,153)
Number of households with income $150k - 200k:
Carthage:
0.0% (0)
State:
7.6% (30,946)
Number of households with income > $200k:
Carthage:
0.0% (0)
State:
8.6% (35,208)
Median per capita income in Carthage in 2022:
Carthage:
$36,872
Illinois:
$29,285
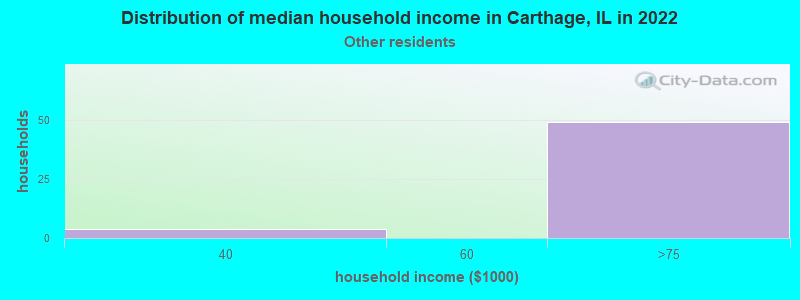
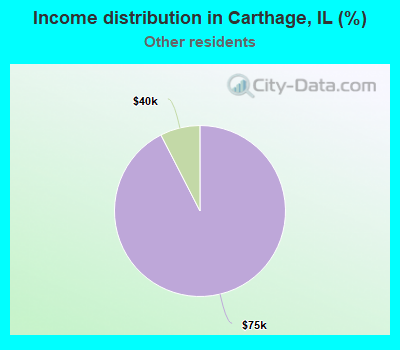
Income statistics for other residents
Number of households with income < $10k:
Carthage:
0.0% (0)
Illinois:
5.7% (16,383)
Number of households with income $10k - 20k:
Carthage:
0.0% (0)
State:
4.8% (13,886)
Number of households with income $20k - 30k:
Carthage:
0.0% (0)
State:
7.0% (20,054)
Number of households with income $30k - 40k:
Carthage:
7.5% (4)
Illinois:
7.0% (20,038)
Number of households with income $40k - 50k:
Carthage:
0.0% (0)
Illinois:
8.3% (23,759)
Number of households with income $50k - 60k:
Carthage:
0.0% (0)
State:
7.8% (22,410)
Number of households with income $60k - 75k:
Carthage:
92.5% (49)
State:
12.0% (34,448)
Number of households with income $75k - 100k:
Carthage:
0.0% (0)
State:
16.2% (46,508)
Number of households with income $100k - 125k:
Carthage:
0.0% (0)
Illinois:
12.5% (35,952)
Number of households with income $125k - 150k:
Carthage:
0.0% (0)
State:
6.9% (19,732)
Number of households with income $150k - 200k:
Carthage:
0.0% (0)
State:
7.5% (21,422)
Number of households with income > $200k:
Carthage:
0.0% (0)
State:
4.3% (12,194)
Median per capita income in Carthage in 2022:
Carthage:
$48,146
Illinois:
$25,392
Discuss Carthage, Illinois (IL) on our hugely popular Illinois forum.