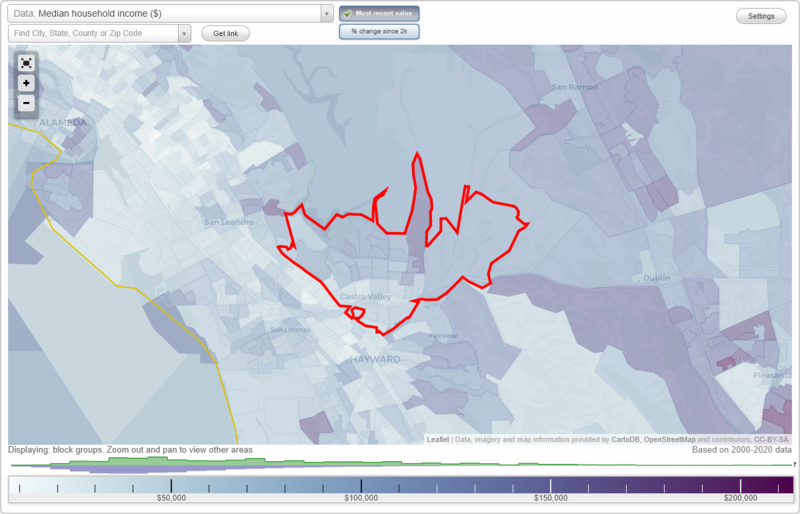
The median household income in Castro Valley, CA in 2022 was $133,285, which was 31.3% greater than the median annual income of $91,551 across the entire state of California. Compared to the median income of $64,874 in 2000 this represents an increase of 51.3%. The per capita income in 2022 was $57,320, which means an increase of 46.9% compared to 2000 when it was $30,454.
Whole page based on the data from 2000 / 2022 when the population of Castro Valley, California was 57,292 / 66,506
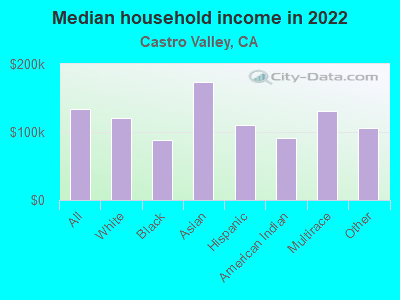
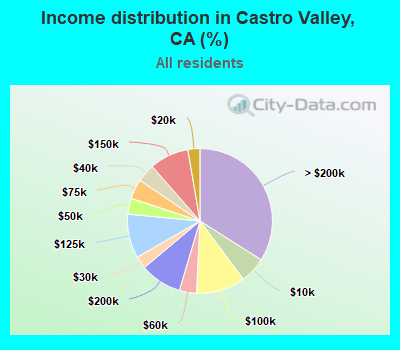
Income statistics for all residents
Median household income in Castro Valley, CA in 2022:
Castro Valley:
$133,285
State:
$91,551
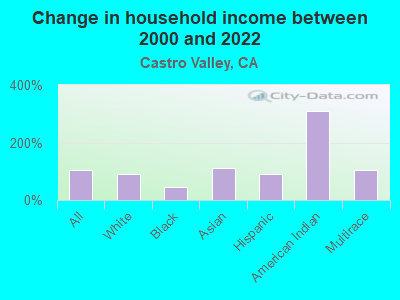
Change in median household income between 2000 and 2022:
Castro Valley, California:
+105.5%
State:
+92.8%
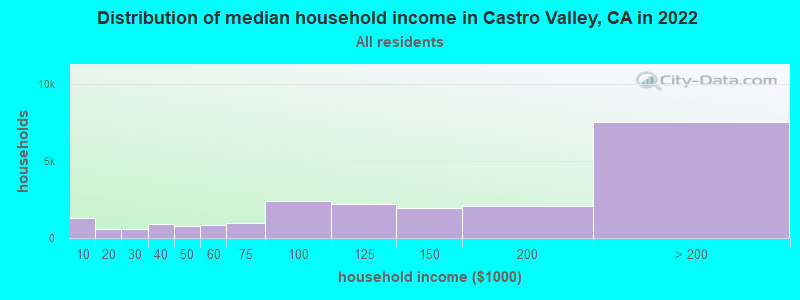
Number of households with income < $10k:
Castro Valley:
5.8% (1,289)
State:
4.8% (654,370)
Number of households with income $10k - 20k:
Castro Valley:
2.7% (594)
California:
5.8% (789,493)
Number of households with income $20k - 30k:
Castro Valley:
2.8% (611)
State:
5.7% (778,318)
Number of households with income $30k - 40k:
Castro Valley:
4.1% (904)
State:
5.8% (783,170)
Number of households with income $40k - 50k:
Castro Valley:
3.6% (790)
California:
5.8% (781,352)
Number of households with income $50k - 60k:
Castro Valley:
3.8% (849)
State:
5.6% (760,175)
Number of households with income $60k - 75k:
Castro Valley:
4.4% (970)
State:
8.2% (1,104,699)
Number of households with income $75k - 100k:
Castro Valley:
10.9% (2,421)
State:
12.0% (1,627,633)
Number of households with income $100k - 125k:
Castro Valley:
9.8% (2,175)
State:
10.0% (1,358,619)
Number of households with income $125k - 150k:
Castro Valley:
8.8% (1,935)
State:
7.6% (1,027,455)
Number of households with income $150k - 200k:
Castro Valley:
9.3% (2,056)
State:
10.6% (1,439,811)
Number of households with income > $200k:
Castro Valley:
34.0% (7,519)
California:
18.0% (2,445,491)
Aggregate household income in Castro Valley in 2022: $3,734,225,700
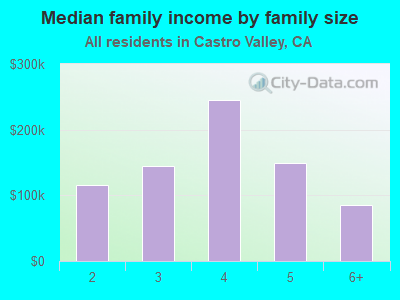
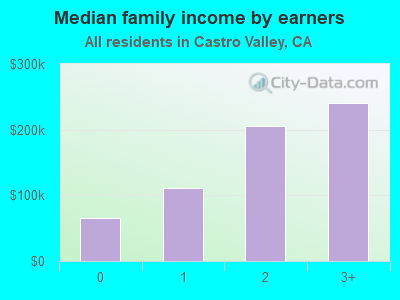
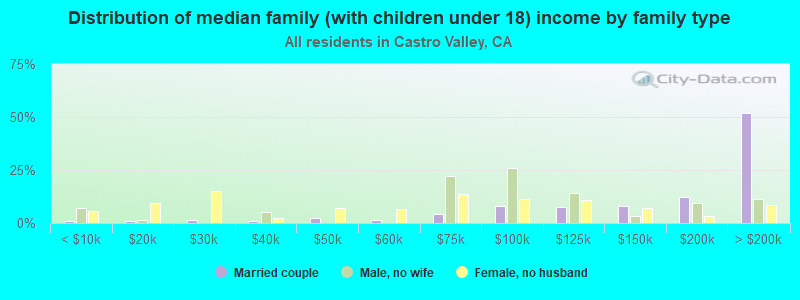
Median family income in Castro Valley in 2022:
Castro Valley:
$150,556
California:
$104,823
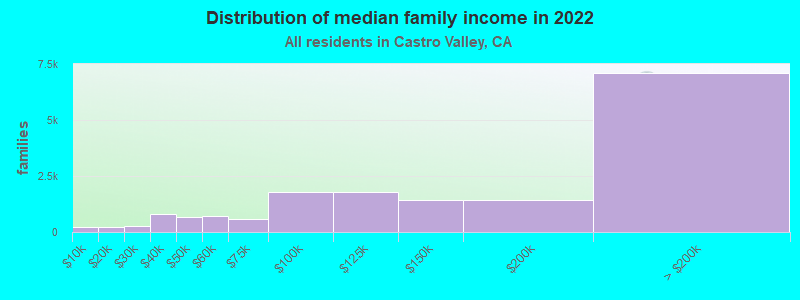
Number of families with income < $10k:
Castro Valley:
1.3% (217)
State:
3.1% (280,184)
Number of families with income $10k - 20k:
Castro Valley:
1.3% (223)
State:
3.5% (322,064)
Number of families with income $20k - 30k:
Castro Valley:
1.5% (261)
California:
4.7% (433,722)
Number of families with income $30k - 40k:
Castro Valley:
4.8% (821)
California:
5.2% (478,213)
Number of families with income $40k - 50k:
Castro Valley:
4.0% (686)
State:
5.6% (511,647)
Number of families with income $50k - 60k:
Castro Valley:
4.3% (732)
State:
5.5% (498,926)
Number of families with income $60k - 75k:
Castro Valley:
3.3% (569)
State:
8.0% (731,094)
Number of families with income $75k - 100k:
Castro Valley:
10.5% (1,788)
State:
12.2% (1,115,621)
Number of families with income $100k - 125k:
Castro Valley:
10.6% (1,807)
State:
10.5% (959,600)
Number of families with income $125k - 150k:
Castro Valley:
8.4% (1,427)
State:
8.4% (768,725)
Number of families with income $150k - 200k:
Castro Valley:
8.5% (1,448)
State:
11.9% (1,087,239)
Number of families with income > $200k:
Castro Valley:
41.6% (7,103)
State:
21.5% (1,963,769)
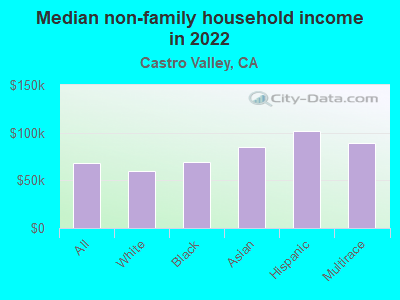
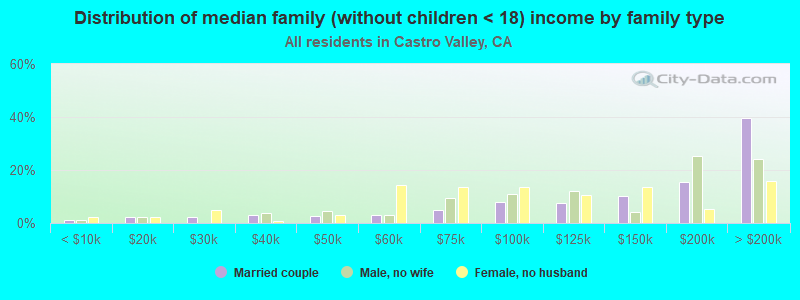
Median non-family income in Castro Valley in 2022:
Castro Valley:
$68,695
State:
$59,348
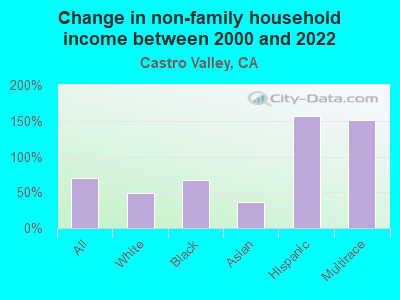
Change in median non-family income between 2000 and 2022:
Castro Valley, California:
+70.2%
California:
+85.3%
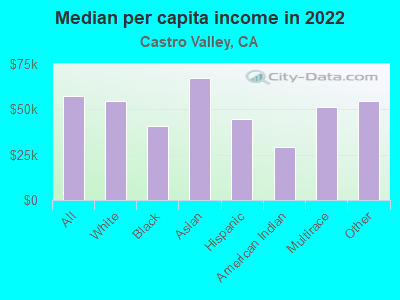
Median per capita income in Castro Valley in 2022:
Castro Valley:
$57,320
State:
$46,661
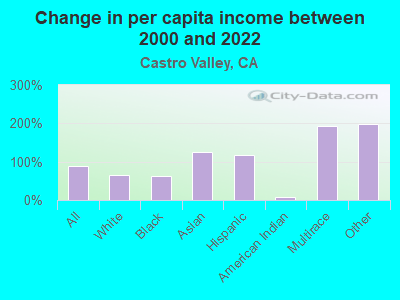
Change in median per capita income between 2000 and 2022:
Castro Valley, California:
+88.2%
California:
+105.5%
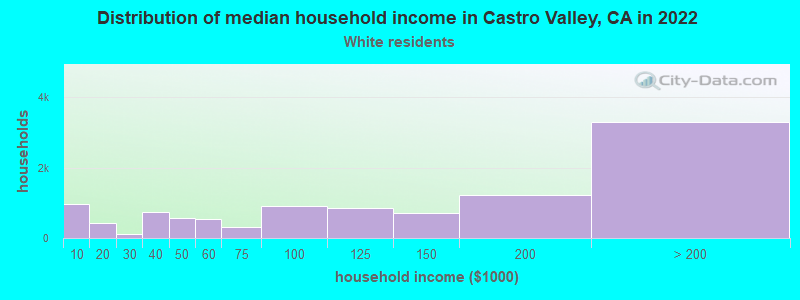
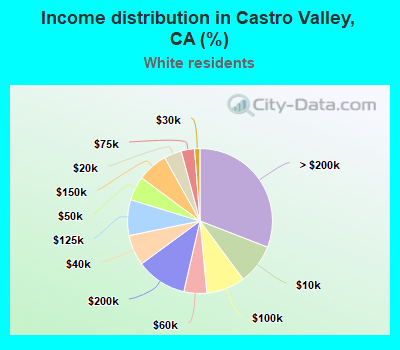
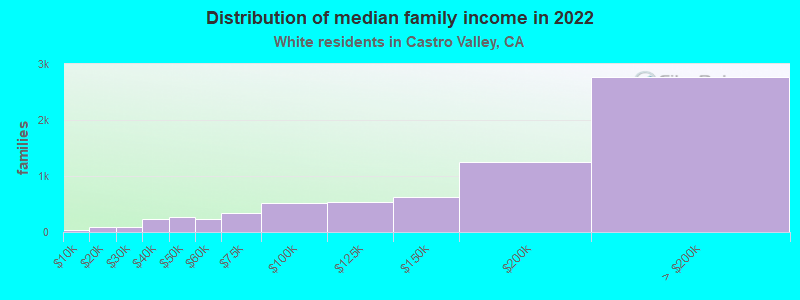
Income statistics for White residents
Median household income in Castro Valley, CA in 2022:
Castro Valley:
$121,258
California:
$100,917
Change in median household income between 2000 and 2022:
Castro Valley, California:
+92.5%
State:
+96.8%
Number of households with income < $10k:
Castro Valley:
9.0% (956)
California:
4.4% (284,109)
Number of households with income $10k - 20k:
Castro Valley:
3.9% (419)
State:
5.3% (340,330)
Number of households with income $20k - 30k:
Castro Valley:
1.2% (128)
California:
5.3% (343,145)
Number of households with income $30k - 40k:
Castro Valley:
6.8% (731)
State:
5.1% (330,146)
Number of households with income $40k - 50k:
Castro Valley:
5.4% (577)
California:
5.2% (335,310)
Number of households with income $50k - 60k:
Castro Valley:
5.1% (546)
State:
5.1% (326,299)
Number of households with income $60k - 75k:
Castro Valley:
3.0% (316)
California:
7.6% (487,640)
Number of households with income $75k - 100k:
Castro Valley:
8.6% (922)
State:
11.5% (736,578)
Number of households with income $100k - 125k:
Castro Valley:
8.0% (852)
State:
10.1% (648,782)
Number of households with income $125k - 150k:
Castro Valley:
6.8% (723)
State:
7.8% (499,671)
Number of households with income $150k - 200k:
Castro Valley:
11.3% (1,210)
State:
11.4% (729,603)
Number of households with income > $200k:
Castro Valley:
30.9% (3,301)
State:
21.2% (1,364,246)
Aggregate household income in Castro Valley in 2022: $1,620,978,800
Median family income in Castro Valley in 2022:
Castro Valley:
$144,886
California:
$125,379
Number of families with income < $10k:
Castro Valley:
0.6% (41)
State:
2.2% (87,079)
Number of families with income $10k - 20k:
Castro Valley:
1.3% (89)
State:
2.5% (97,716)
Number of families with income $20k - 30k:
Castro Valley:
1.3% (92)
California:
3.5% (137,295)
Number of families with income $30k - 40k:
Castro Valley:
3.4% (235)
State:
3.9% (152,947)
Number of families with income $40k - 50k:
Castro Valley:
3.8% (268)
State:
4.3% (169,197)
Number of families with income $50k - 60k:
Castro Valley:
3.4% (236)
State:
4.5% (176,192)
Number of families with income $60k - 75k:
Castro Valley:
4.8% (336)
State:
7.0% (274,752)
Number of families with income $75k - 100k:
Castro Valley:
7.4% (520)
State:
11.3% (445,632)
Number of families with income $100k - 125k:
Castro Valley:
7.6% (533)
State:
10.7% (423,630)
Number of families with income $125k - 150k:
Castro Valley:
9.0% (631)
California:
9.1% (357,408)
Number of families with income $150k - 200k:
Castro Valley:
17.8% (1,244)
State:
13.5% (532,693)
Number of families with income > $200k:
Castro Valley:
39.5% (2,764)
State:
27.6% (1,086,948)
Median non-family income in Castro Valley in 2022:
Castro Valley:
$60,007
State:
$62,819
Change in median non-family income between 2000 and 2022:
Castro Valley, California:
+49.1%
California:
+84.4%
Median per capita income in Castro Valley in 2022:
Castro Valley:
$54,694
State:
$61,706
Change in median per capita income between 2000 and 2022:
Castro Valley, California:
+65.8%
State:
+122.7%
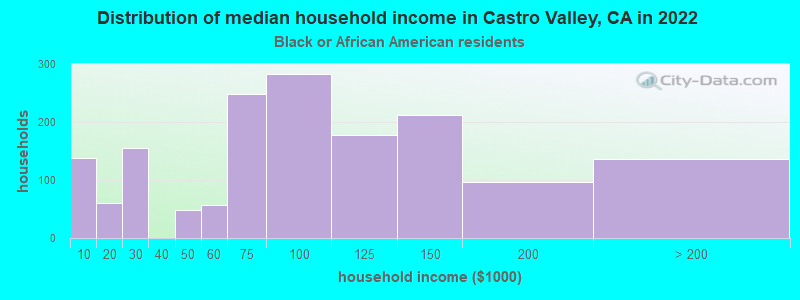
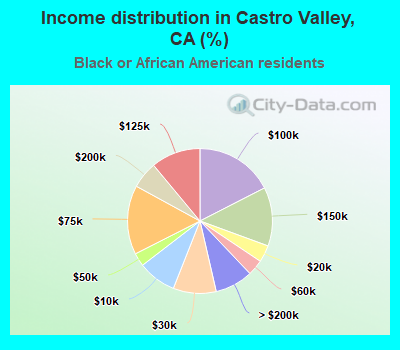
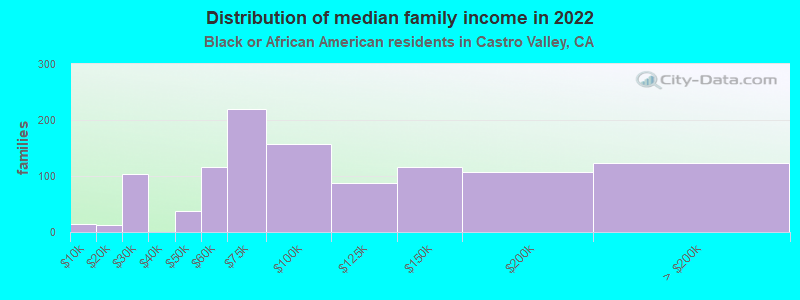
Income statistics for Black or African American residents
Median household income in Castro Valley, CA in 2022:
Castro Valley:
$88,901
California:
$63,268
Change in median household income between 2000 and 2022:
Castro Valley, California:
+45.8%
State:
+81.0%
Number of households with income < $10k:
Castro Valley:
8.6% (138)
State:
9.0% (73,219)
Number of households with income $10k - 20k:
Castro Valley:
3.8% (61)
California:
10.6% (86,666)
Number of households with income $20k - 30k:
Castro Valley:
9.6% (155)
State:
7.1% (57,719)
Number of households with income $30k - 40k:
Castro Valley:
0.0% (0)
California:
7.2% (58,714)
Number of households with income $40k - 50k:
Castro Valley:
3.0% (48)
State:
7.1% (58,075)
Number of households with income $50k - 60k:
Castro Valley:
3.5% (57)
California:
6.8% (55,229)
Number of households with income $60k - 75k:
Castro Valley:
15.4% (249)
California:
8.8% (71,895)
Number of households with income $75k - 100k:
Castro Valley:
17.5% (282)
State:
11.9% (96,893)
Number of households with income $100k - 125k:
Castro Valley:
11.0% (178)
State:
8.7% (70,729)
Number of households with income $125k - 150k:
Castro Valley:
13.1% (212)
State:
6.3% (51,211)
Number of households with income $150k - 200k:
Castro Valley:
6.0% (97)
California:
7.2% (58,687)
Number of households with income > $200k:
Castro Valley:
8.5% (137)
State:
9.3% (75,487)
Aggregate household income in Castro Valley in 2022: $107,963,800
Median family income in Castro Valley in 2022:
Castro Valley:
$89,746
State:
$77,263
Number of families with income < $10k:
Castro Valley:
1.4% (15)
California:
5.9% (27,037)
Number of families with income $10k - 20k:
Castro Valley:
1.2% (13)
State:
6.4% (29,505)
Number of families with income $20k - 30k:
Castro Valley:
9.5% (104)
State:
5.6% (25,755)
Number of families with income $40k - 50k:
Castro Valley:
3.4% (37)
California:
8.3% (38,171)
Number of families with income $50k - 60k:
Castro Valley:
10.6% (116)
California:
7.0% (31,860)
Number of families with income $60k - 75k:
Castro Valley:
20.0% (219)
State:
8.7% (40,021)
Number of families with income $75k - 100k:
Castro Valley:
14.3% (157)
State:
12.4% (56,846)
Number of families with income $100k - 125k:
Castro Valley:
8.1% (88)
California:
9.8% (44,911)
Number of families with income $125k - 150k:
Castro Valley:
10.6% (116)
California:
7.5% (34,434)
Number of families with income $150k - 200k:
Castro Valley:
9.8% (107)
California:
9.3% (42,807)
Number of families with income > $200k:
Castro Valley:
11.3% (124)
California:
12.2% (56,093)
Median non-family income in Castro Valley in 2022:
Castro Valley:
$69,487
California:
$41,942
Change in median non-family income between 2000 and 2022:
Castro Valley, California:
+67.1%
State:
+72.0%
Median per capita income in Castro Valley in 2022:
Castro Valley:
$40,612
State:
$36,708
Change in median per capita income between 2000 and 2022:
Castro Valley, California:
+62.7%
State:
+110.4%
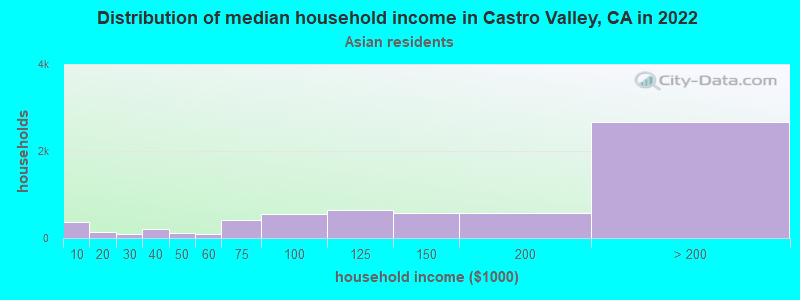
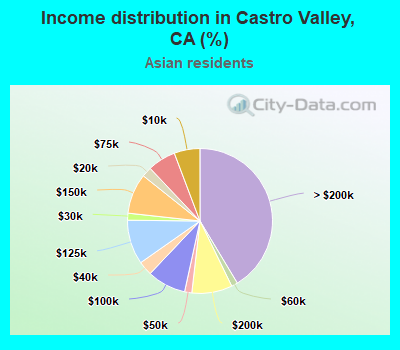
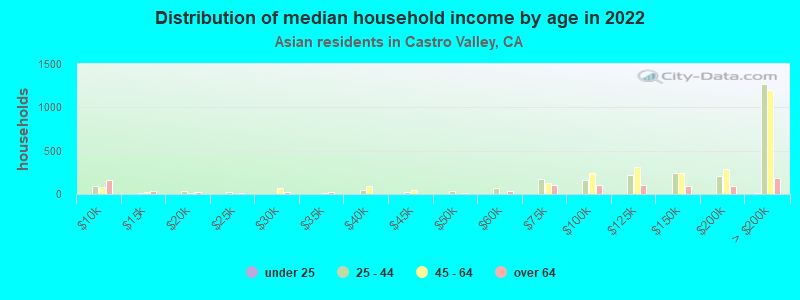
Income statistics for Asian residents
Median household income in Castro Valley, CA in 2022:
Castro Valley:
$173,821
California:
$119,861
Change in median household income between 2000 and 2022:
Castro Valley, California:
+110.6%
State:
+116.5%
Number of households with income < $10k:
Castro Valley:
5.8% (371)
State:
5.1% (106,273)
Number of households with income $10k - 20k:
Castro Valley:
2.2% (143)
California:
4.9% (101,815)
Number of households with income $20k - 30k:
Castro Valley:
1.6% (100)
California:
4.6% (94,414)
Number of households with income $30k - 40k:
Castro Valley:
3.2% (205)
State:
4.1% (84,491)
Number of households with income $40k - 50k:
Castro Valley:
1.6% (104)
California:
4.0% (81,758)
Number of households with income $50k - 60k:
Castro Valley:
1.4% (91)
California:
3.9% (80,971)
Number of households with income $60k - 75k:
Castro Valley:
6.3% (406)
State:
6.0% (124,194)
Number of households with income $75k - 100k:
Castro Valley:
8.7% (558)
State:
9.7% (200,337)
Number of households with income $100k - 125k:
Castro Valley:
9.9% (639)
State:
9.4% (193,488)
Number of households with income $125k - 150k:
Castro Valley:
9.0% (579)
California:
7.7% (158,253)
Number of households with income $150k - 200k:
Castro Valley:
9.0% (581)
State:
12.2% (252,139)
Number of households with income > $200k:
Castro Valley:
41.4% (2,667)
State:
28.4% (586,641)
Aggregate household income in Castro Valley in 2022: $1,470,078,400
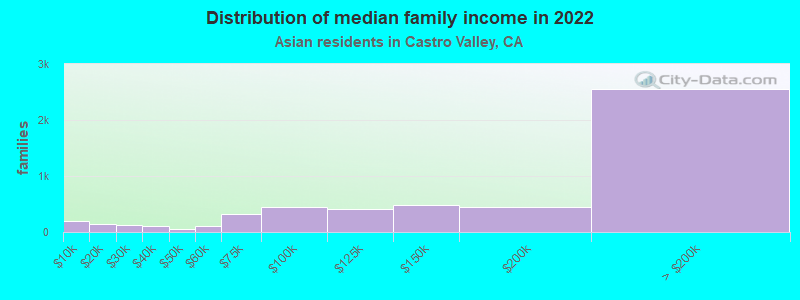
Median family income in Castro Valley in 2022:
Castro Valley:
$234,410
State:
$136,040
Number of families with income < $10k:
Castro Valley:
3.5% (189)
State:
2.8% (42,046)
Number of families with income $10k - 20k:
Castro Valley:
2.8% (151)
State:
3.1% (46,821)
Number of families with income $20k - 30k:
Castro Valley:
2.5% (133)
State:
4.1% (61,519)
Number of families with income $30k - 40k:
Castro Valley:
2.0% (109)
California:
3.7% (55,234)
Number of families with income $40k - 50k:
Castro Valley:
1.1% (62)
State:
3.9% (58,471)
Number of families with income $50k - 60k:
Castro Valley:
2.1% (115)
California:
3.9% (58,911)
Number of families with income $60k - 75k:
Castro Valley:
6.0% (327)
State:
5.9% (88,675)
Number of families with income $75k - 100k:
Castro Valley:
8.1% (439)
State:
9.5% (143,103)
Number of families with income $100k - 125k:
Castro Valley:
7.7% (416)
State:
9.4% (142,085)
Number of families with income $125k - 150k:
Castro Valley:
8.9% (483)
State:
8.0% (120,635)
Number of families with income $150k - 200k:
Castro Valley:
8.1% (440)
State:
13.2% (198,099)
Number of families with income > $200k:
Castro Valley:
47.2% (2,562)
California:
32.5% (489,303)
Median non-family income in Castro Valley in 2022:
Castro Valley:
$84,670
California:
$74,216
Change in median non-family income between 2000 and 2022:
Castro Valley, California:
+35.7%
State:
+136.3%
Median per capita income in Castro Valley in 2022:
Castro Valley:
$67,187
California:
$58,824
Change in median per capita income between 2000 and 2022:
Castro Valley, California:
+125.0%
California:
+166.8%
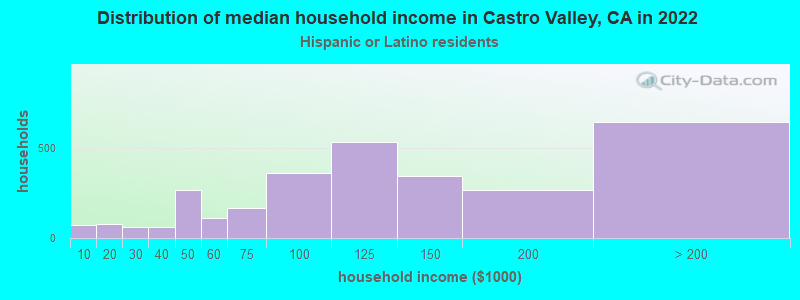
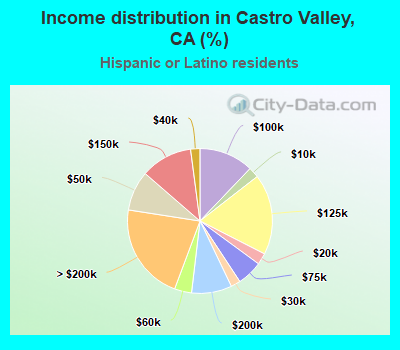
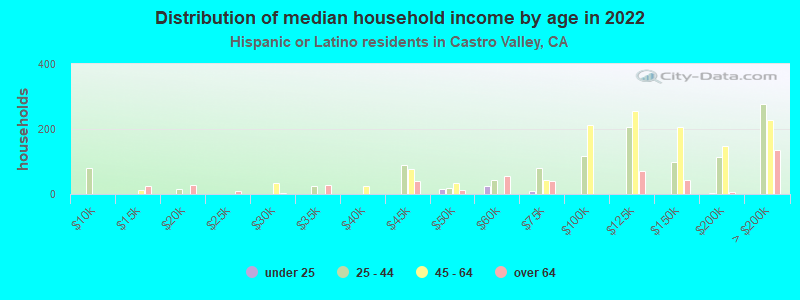
Income statistics for Hispanic or Latino residents
Median household income in Castro Valley, CA in 2022:
Castro Valley:
$110,509
California:
$75,698
Change in median household income between 2000 and 2022:
Castro Valley, California:
+89.7%
State:
+107.2%
Number of households with income < $10k:
Castro Valley:
2.3% (70)
California:
4.3% (183,294)
Number of households with income $10k - 20k:
Castro Valley:
2.6% (76)
State:
6.0% (253,903)
Number of households with income $20k - 30k:
Castro Valley:
2.1% (64)
State:
6.8% (286,386)
Number of households with income $30k - 40k:
Castro Valley:
2.1% (62)
California:
7.4% (313,728)
Number of households with income $40k - 50k:
Castro Valley:
8.9% (266)
California:
7.4% (313,199)
Number of households with income $50k - 60k:
Castro Valley:
3.8% (114)
State:
7.2% (305,366)
Number of households with income $60k - 75k:
Castro Valley:
5.7% (169)
California:
10.3% (434,937)
Number of households with income $75k - 100k:
Castro Valley:
12.1% (362)
State:
14.4% (607,302)
Number of households with income $100k - 125k:
Castro Valley:
18.0% (537)
State:
10.6% (447,424)
Number of households with income $125k - 150k:
Castro Valley:
11.5% (344)
State:
7.5% (316,022)
Number of households with income $150k - 200k:
Castro Valley:
9.0% (268)
State:
9.2% (386,269)
Number of households with income > $200k:
Castro Valley:
21.7% (648)
State:
8.8% (372,651)
Aggregate household income in Castro Valley in 2022: $507,461,800
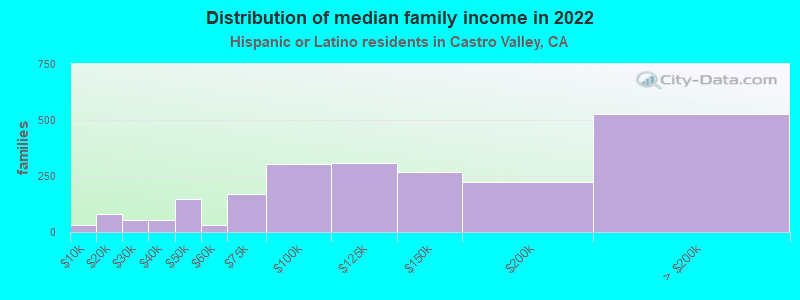
Median family income in Castro Valley in 2022:
Castro Valley:
$115,169
State:
$77,589
Number of families with income < $10k:
Castro Valley:
1.4% (31)
California:
3.9% (129,468)
Number of families with income $10k - 20k:
Castro Valley:
3.7% (82)
State:
4.6% (151,997)
Number of families with income $20k - 30k:
Castro Valley:
2.4% (53)
California:
6.6% (216,764)
Number of families with income $30k - 40k:
Castro Valley:
2.5% (55)
California:
7.6% (249,849)
Number of families with income $40k - 50k:
Castro Valley:
6.7% (148)
California:
7.7% (254,822)
Number of families with income $50k - 60k:
Castro Valley:
1.4% (31)
California:
7.4% (244,815)
Number of families with income $60k - 75k:
Castro Valley:
7.7% (168)
California:
10.5% (345,838)
Number of families with income $75k - 100k:
Castro Valley:
13.8% (303)
California:
14.9% (491,589)
Number of families with income $100k - 125k:
Castro Valley:
14.0% (308)
State:
10.7% (355,400)
Number of families with income $125k - 150k:
Castro Valley:
12.3% (270)
California:
7.8% (259,317)
Number of families with income $150k - 200k:
Castro Valley:
10.1% (223)
State:
9.3% (306,566)
Number of families with income > $200k:
Castro Valley:
23.9% (526)
State:
9.1% (299,984)
Median non-family income in Castro Valley in 2022:
Castro Valley:
$102,104
State:
$49,746
Median per capita income in Castro Valley in 2022:
Castro Valley:
$44,408
California:
$27,240
Change in median per capita income between 2000 and 2022:
Castro Valley, California:
+116.8%
California:
+133.3%
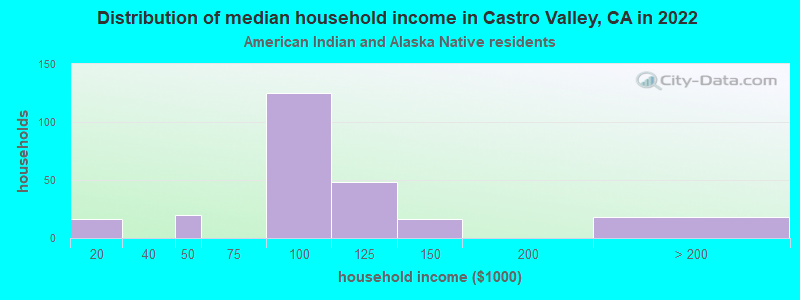
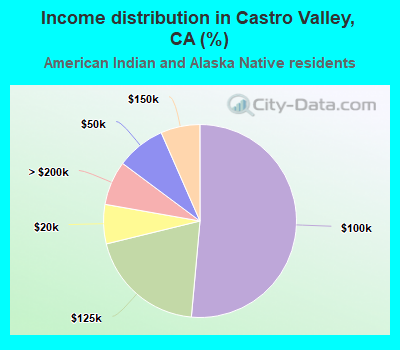
Income statistics for American Indian and Alaska Native residents
Median household income in Castro Valley, CA in 2022:
Castro Valley:
$91,687
State:
$76,752
Number of households with income < $10k:
Castro Valley:
0.0% (0)
State:
5.4% (8,471)
Number of households with income $10k - 20k:
Castro Valley:
6.6% (16)
California:
6.0% (9,381)
Number of households with income $20k - 30k:
Castro Valley:
0.0% (0)
California:
5.5% (8,668)
Number of households with income $30k - 40k:
Castro Valley:
0.0% (0)
State:
8.3% (13,030)
Number of households with income $40k - 50k:
Castro Valley:
8.2% (20)
State:
6.9% (10,908)
Number of households with income $50k - 60k:
Castro Valley:
0.0% (0)
State:
7.1% (11,198)
Number of households with income $60k - 75k:
Castro Valley:
0.0% (0)
California:
9.6% (15,190)
Number of households with income $75k - 100k:
Castro Valley:
51.4% (125)
State:
14.1% (22,274)
Number of households with income $100k - 125k:
Castro Valley:
19.8% (48)
California:
11.2% (17,643)
Number of households with income $125k - 150k:
Castro Valley:
6.6% (16)
State:
8.3% (13,117)
Number of households with income $150k - 200k:
Castro Valley:
0.0% (0)
State:
8.8% (13,853)
Number of households with income > $200k:
Castro Valley:
7.4% (18)
State:
8.8% (13,925)
Aggregate household income in Castro Valley in 2022: $33,583,100
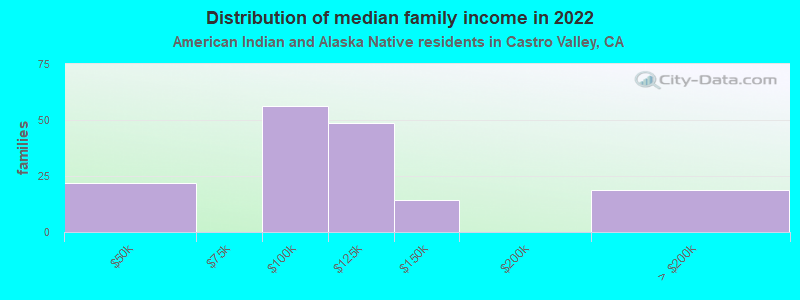
Median family income in Castro Valley in 2022:
Castro Valley:
$92,028
State:
$81,108
Number of families with income $40k - 50k:
Castro Valley:
13.7% (22)
State:
7.8% (8,776)
Number of families with income $75k - 100k:
Castro Valley:
35.2% (56)
State:
14.8% (16,731)
Number of families with income $100k - 125k:
Castro Valley:
30.4% (48)
California:
12.0% (13,609)
Number of families with income $125k - 150k:
Castro Valley:
8.9% (14)
California:
8.0% (9,104)
Number of families with income > $200k:
Castro Valley:
11.8% (19)
State:
10.1% (11,409)
Median per capita income in Castro Valley in 2022:
Castro Valley:
$29,235
State:
$30,289
Change in median per capita income between 2000 and 2022:
Castro Valley, California:
+9.4%
State:
+98.9%
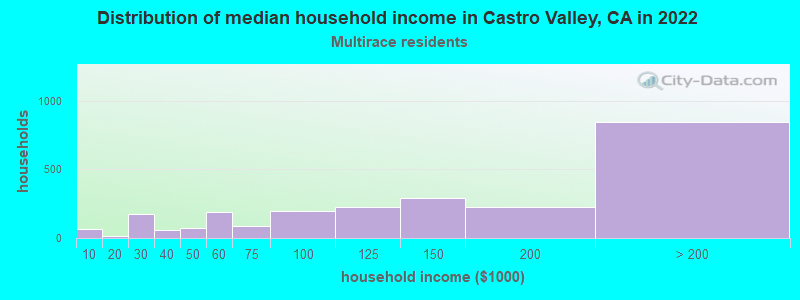
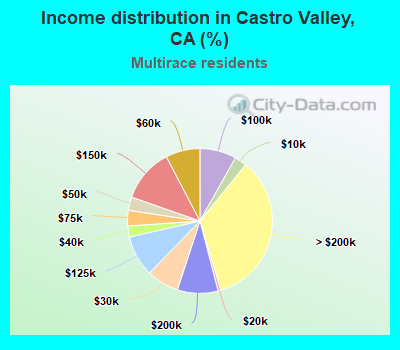
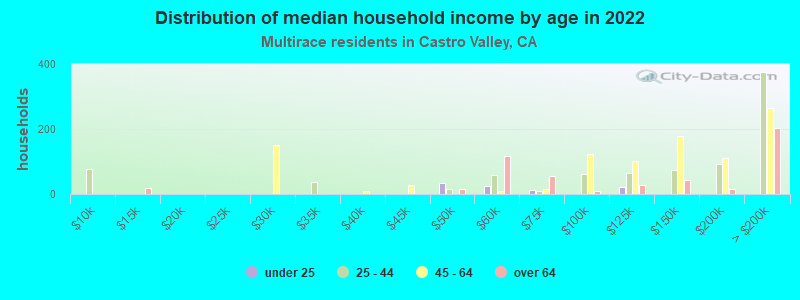
Income statistics for Multirace residents
Median household income in Castro Valley, CA in 2022:
Castro Valley:
$131,558
State:
$83,153
Change in median household income between 2000 and 2022:
Castro Valley, California:
+104.4%
California:
+106.0%
Number of households with income < $10k:
Castro Valley:
2.7% (66)
California:
4.2% (85,299)
Number of households with income $10k - 20k:
Castro Valley:
0.7% (16)
California:
6.1% (122,966)
Number of households with income $20k - 30k:
Castro Valley:
7.2% (177)
California:
6.4% (129,328)
Number of households with income $30k - 40k:
Castro Valley:
2.4% (60)
California:
6.4% (130,070)
Number of households with income $40k - 50k:
Castro Valley:
3.0% (73)
State:
6.5% (131,254)
Number of households with income $50k - 60k:
Castro Valley:
7.7% (188)
State:
6.5% (132,382)
Number of households with income $60k - 75k:
Castro Valley:
3.5% (85)
California:
9.4% (191,472)
Number of households with income $75k - 100k:
Castro Valley:
8.2% (200)
State:
13.3% (269,691)
Number of households with income $100k - 125k:
Castro Valley:
9.2% (225)
State:
10.2% (207,286)
Number of households with income $125k - 150k:
Castro Valley:
12.0% (294)
California:
7.8% (158,259)
Number of households with income $150k - 200k:
Castro Valley:
9.1% (223)
California:
10.3% (209,227)
Number of households with income > $200k:
Castro Valley:
34.5% (846)
State:
13.0% (263,210)
Aggregate household income in Castro Valley in 2022: $338,190,600
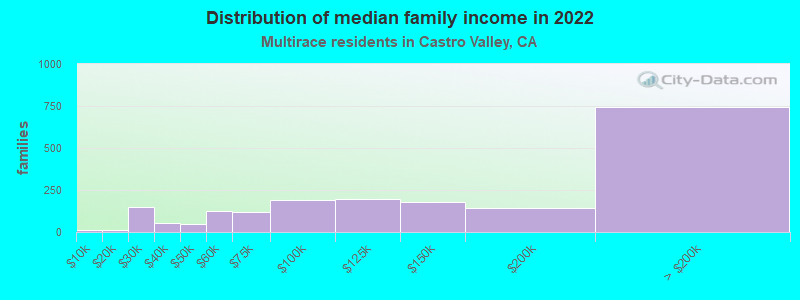
Median family income in Castro Valley in 2022:
Castro Valley:
$164,104
California:
$87,642
Number of families with income < $10k:
Castro Valley:
0.5% (10)
California:
3.2% (48,017)
Number of families with income $10k - 20k:
Castro Valley:
0.6% (11)
California:
4.1% (60,419)
Number of families with income $20k - 30k:
Castro Valley:
7.4% (147)
State:
6.1% (89,742)
Number of families with income $30k - 40k:
Castro Valley:
2.8% (56)
California:
6.2% (91,415)
Number of families with income $40k - 50k:
Castro Valley:
2.5% (50)
California:
6.8% (100,085)
Number of families with income $50k - 60k:
Castro Valley:
6.4% (126)
State:
6.7% (98,298)
Number of families with income $60k - 75k:
Castro Valley:
6.1% (122)
State:
9.5% (140,131)
Number of families with income $75k - 100k:
Castro Valley:
9.7% (193)
State:
13.8% (203,439)
Number of families with income $100k - 125k:
Castro Valley:
10.0% (199)
State:
10.4% (153,515)
Number of families with income $125k - 150k:
Castro Valley:
9.1% (180)
State:
8.4% (124,115)
Number of families with income $150k - 200k:
Castro Valley:
7.3% (145)
State:
10.9% (161,643)
Number of families with income > $200k:
Castro Valley:
37.5% (744)
State:
14.0% (207,317)
Median non-family income in Castro Valley in 2022:
Castro Valley:
$89,239
State:
$56,558
Median per capita income in Castro Valley in 2022:
Castro Valley:
$51,274
California:
$32,124
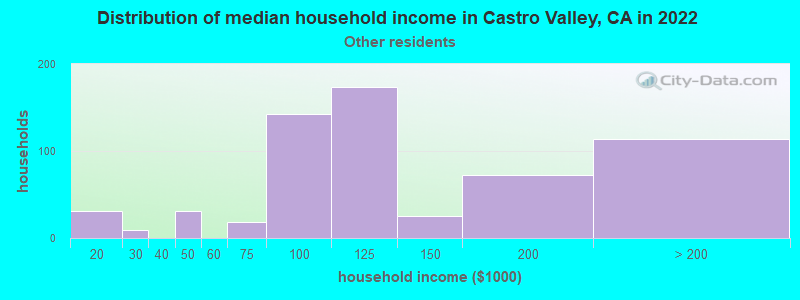
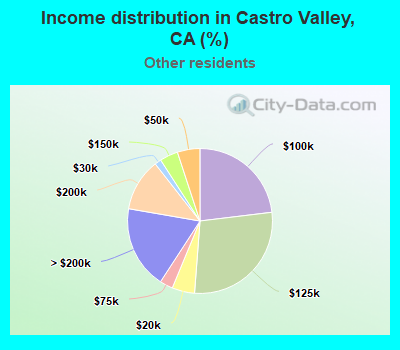
Income statistics for other residents
Median household income in Castro Valley, CA in 2022:
Castro Valley:
$106,441
State:
$71,383
Number of households with income < $10k:
Castro Valley:
0.0% (0)
California:
4.6% (93,035)
Number of households with income $10k - 20k:
Castro Valley:
5.0% (31)
State:
6.3% (126,222)
Number of households with income $20k - 30k:
Castro Valley:
1.5% (9)
State:
7.1% (142,656)
Number of households with income $30k - 40k:
Castro Valley:
0.0% (0)
State:
8.2% (165,018)
Number of households with income $40k - 50k:
Castro Valley:
5.0% (31)
State:
8.0% (161,732)
Number of households with income $50k - 60k:
Castro Valley:
0.0% (0)
State:
7.6% (152,152)
Number of households with income $60k - 75k:
Castro Valley:
2.9% (18)
California:
10.4% (209,951)
Number of households with income $75k - 100k:
Castro Valley:
23.1% (142)
State:
14.7% (296,102)
Number of households with income $100k - 125k:
Castro Valley:
28.1% (173)
State:
10.7% (214,281)
Number of households with income $125k - 150k:
Castro Valley:
4.1% (25)
State:
7.1% (143,092)
Number of households with income $150k - 200k:
Castro Valley:
11.7% (72)
California:
8.6% (172,215)
Number of households with income > $200k:
Castro Valley:
18.5% (114)
California:
6.7% (134,102)
Aggregate household income in Castro Valley in 2022: $153,857,400
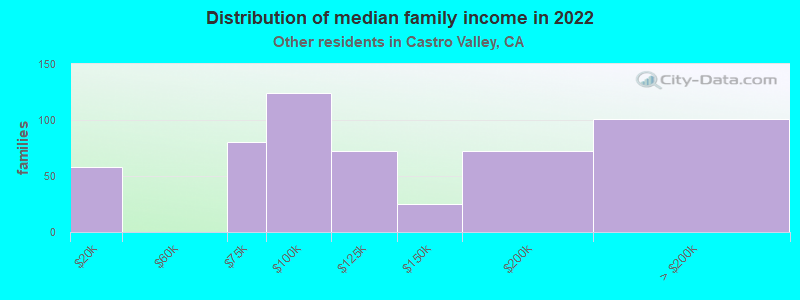
Median family income in Castro Valley in 2022:
Castro Valley:
$106,606
State:
$72,756
Number of families with income $10k - 20k:
Castro Valley:
11.0% (58)
State:
5.1% (82,116)
Number of families with income $60k - 75k:
Castro Valley:
15.0% (80)
California:
10.7% (173,628)
Number of families with income $75k - 100k:
Castro Valley:
23.4% (124)
California:
15.2% (245,724)
Number of families with income $100k - 125k:
Castro Valley:
13.6% (72)
State:
10.9% (176,716)
Number of families with income $125k - 150k:
Castro Valley:
4.6% (25)
State:
7.4% (119,985)
Number of families with income $150k - 200k:
Castro Valley:
13.5% (72)
State:
8.5% (137,332)
Number of families with income > $200k:
Castro Valley:
19.0% (101)
State:
6.6% (106,346)
Median per capita income in Castro Valley in 2022:
Castro Valley:
$54,570
State:
$25,164
Discuss Castro Valley, California (CA) on our hugely popular California forum.