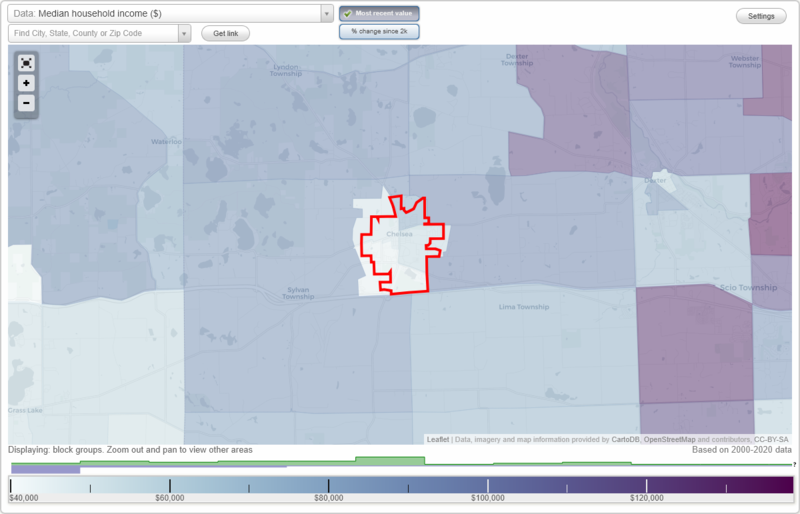
The median household income in Chelsea, MI in 2022 was $67,498, which was about the same as the median annual income of $66,986 across the entire state of Michigan. Compared to the median income of $51,132 in 2000 this represents an increase of 24.2%. The per capita income in 2022 was $49,704, which means an increase of 44.5% compared to 2000 when it was $27,608.
Whole page based on the data from 2000 / 2022 when the population of Chelsea, Michigan was 4,398 / 5,383
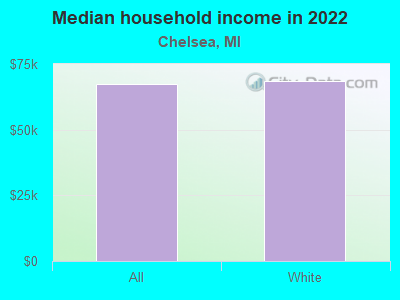
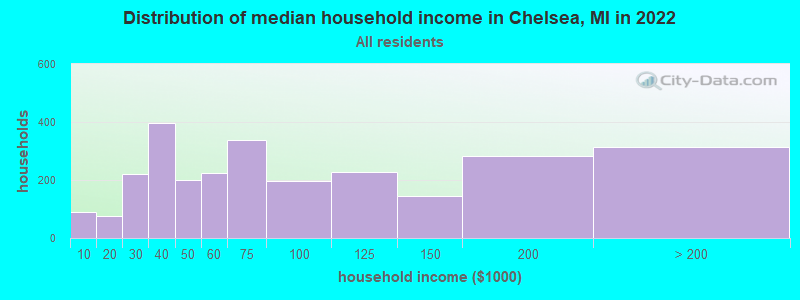
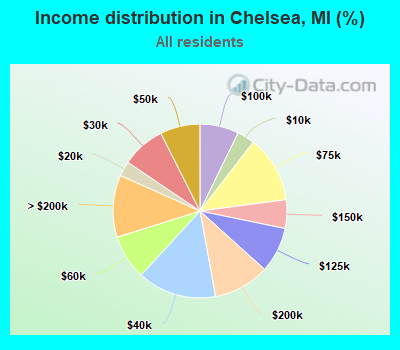
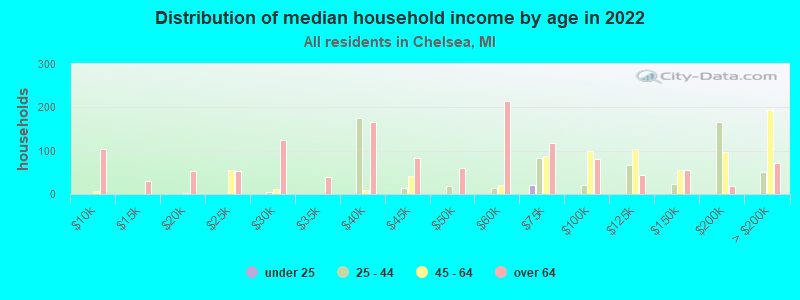
Income statistics for all residents
Median household income in Chelsea, MI in 2022:
Chelsea:
$67,498
State:
$66,986
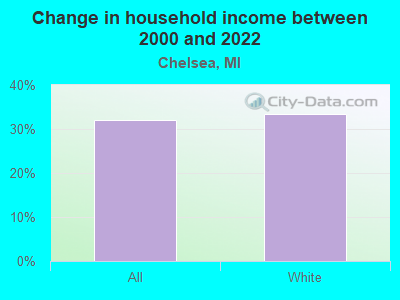
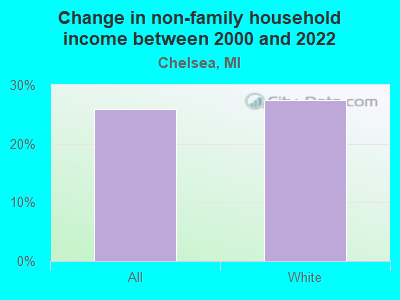
Change in median household income between 2000 and 2022:
Chelsea, Michigan:
+32.0%
State:
+50.0%
Number of households with income < $10k:
Chelsea:
3.2% (88)
State:
5.7% (231,223)
Number of households with income $10k - 20k:
Chelsea:
2.8% (75)
State:
7.5% (306,955)
Number of households with income $20k - 30k:
Chelsea:
8.1% (220)
Michigan:
7.9% (324,153)
Number of households with income $30k - 40k:
Chelsea:
14.7% (398)
Michigan:
8.3% (341,408)
Number of households with income $40k - 50k:
Chelsea:
7.4% (201)
State:
7.9% (322,255)
Number of households with income $50k - 60k:
Chelsea:
8.3% (225)
Michigan:
7.5% (305,914)
Number of households with income $60k - 75k:
Chelsea:
12.4% (337)
State:
10.1% (414,440)
Number of households with income $75k - 100k:
Chelsea:
7.2% (196)
Michigan:
13.2% (538,299)
Number of households with income $100k - 125k:
Chelsea:
8.5% (229)
State:
9.7% (396,282)
Number of households with income $125k - 150k:
Chelsea:
5.3% (144)
State:
6.7% (273,144)
Number of households with income $150k - 200k:
Chelsea:
10.4% (283)
State:
7.5% (305,077)
Number of households with income > $200k:
Chelsea:
11.6% (313)
State:
8.1% (330,644)
Aggregate household income in Chelsea in 2022: $266,528,038
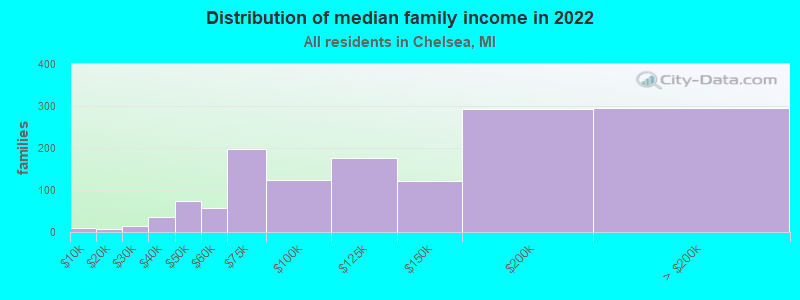
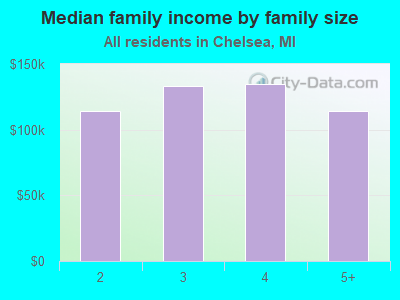
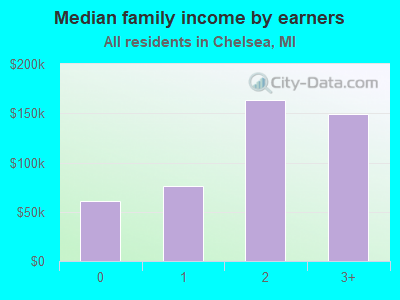
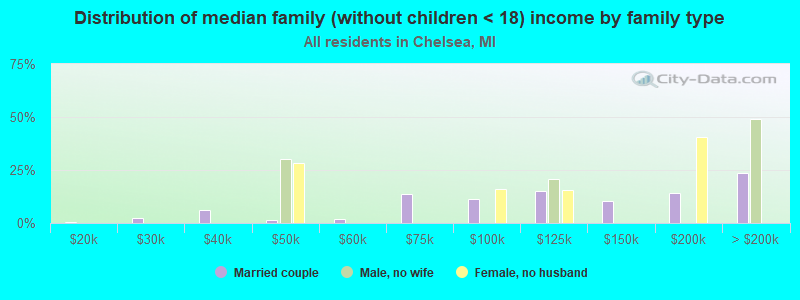
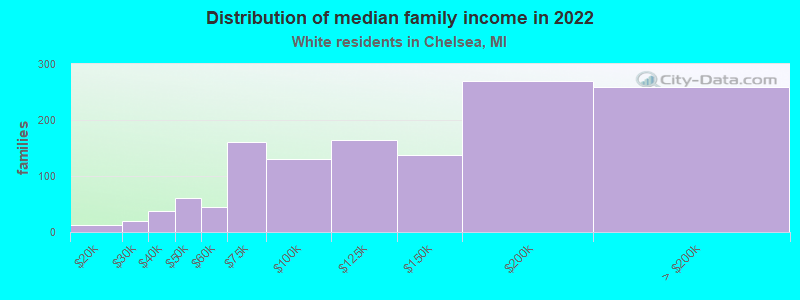
Median family income in Chelsea in 2022:
Chelsea:
$129,240
State:
$85,865
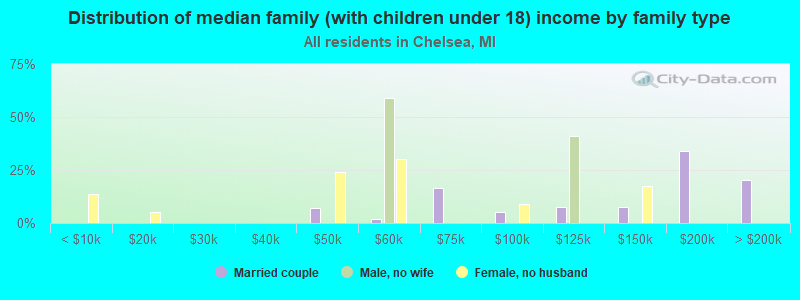
Number of families with income < $10k:
Chelsea:
0.7% (9)
State:
3.5% (89,010)
Number of families with income $10k - 20k:
Chelsea:
0.5% (7)
State:
3.9% (100,567)
Number of families with income $20k - 30k:
Chelsea:
1.0% (14)
Michigan:
5.0% (127,320)
Number of families with income $30k - 40k:
Chelsea:
2.5% (36)
State:
6.4% (163,565)
Number of families with income $40k - 50k:
Chelsea:
5.2% (73)
State:
6.8% (172,384)
Number of families with income $50k - 60k:
Chelsea:
4.1% (58)
State:
7.1% (179,870)
Number of families with income $60k - 75k:
Chelsea:
14.0% (197)
State:
10.3% (263,723)
Number of families with income $75k - 100k:
Chelsea:
8.9% (125)
State:
15.0% (383,364)
Number of families with income $100k - 125k:
Chelsea:
12.6% (177)
State:
11.8% (301,751)
Number of families with income $125k - 150k:
Chelsea:
8.7% (122)
Michigan:
8.6% (220,338)
Number of families with income $150k - 200k:
Chelsea:
20.8% (292)
Michigan:
10.2% (259,462)
Number of families with income > $200k:
Chelsea:
21.0% (295)
State:
11.3% (287,206)
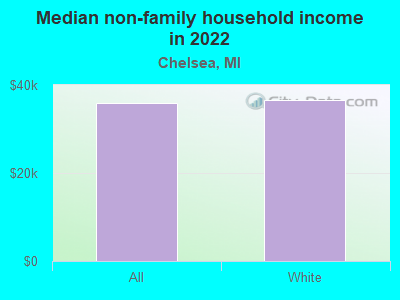
Median non-family income in Chelsea in 2022:
Chelsea:
$35,943
State:
$40,459
Change in median non-family income between 2000 and 2022:
Chelsea, Michigan:
+25.8%
State:
+54.5%
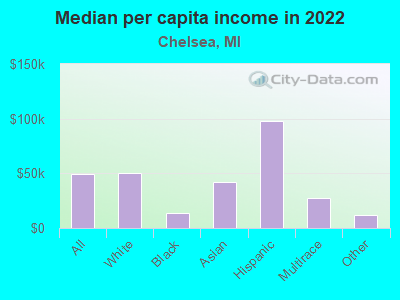
Median per capita income in Chelsea in 2022:
Chelsea:
$49,704
Michigan:
$38,151
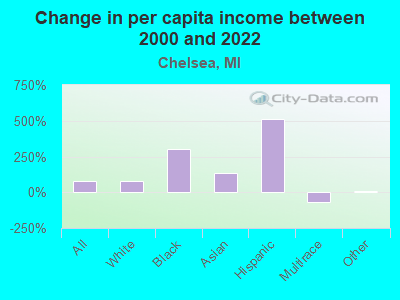
Change in median per capita income between 2000 and 2022:
Chelsea, Michigan:
+80.0%
Michigan:
+72.1%
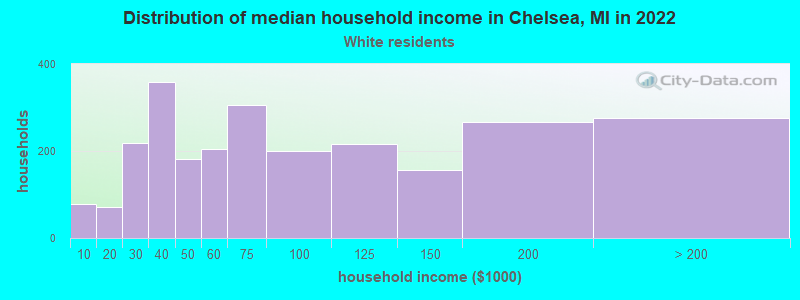
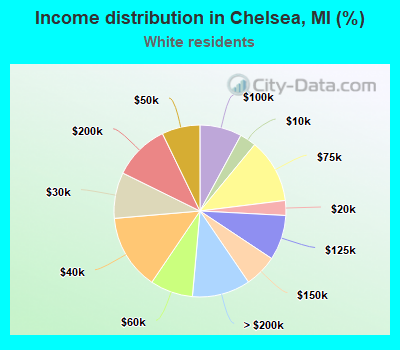
Income statistics for White residents
Median household income in Chelsea, MI in 2022:
Chelsea:
$68,674
Michigan:
$71,609
Change in median household income between 2000 and 2022:
Chelsea, Michigan:
+33.5%
Michigan:
+52.9%
Number of households with income < $10k:
Chelsea:
3.1% (78)
State:
4.4% (140,440)
Number of households with income $10k - 20k:
Chelsea:
2.8% (71)
Michigan:
6.5% (205,547)
Number of households with income $20k - 30k:
Chelsea:
8.6% (219)
State:
7.6% (242,254)
Number of households with income $30k - 40k:
Chelsea:
14.2% (359)
Michigan:
8.1% (257,175)
Number of households with income $40k - 50k:
Chelsea:
7.2% (182)
State:
7.8% (246,839)
Number of households with income $50k - 60k:
Chelsea:
8.1% (204)
State:
7.4% (233,723)
Number of households with income $60k - 75k:
Chelsea:
12.1% (306)
Michigan:
10.4% (328,664)
Number of households with income $75k - 100k:
Chelsea:
7.9% (200)
State:
13.6% (431,867)
Number of households with income $100k - 125k:
Chelsea:
8.5% (215)
State:
10.3% (325,164)
Number of households with income $125k - 150k:
Chelsea:
6.2% (156)
State:
7.1% (226,232)
Number of households with income $150k - 200k:
Chelsea:
10.5% (267)
Michigan:
8.1% (255,445)
Number of households with income > $200k:
Chelsea:
10.9% (277)
State:
8.7% (276,727)
Aggregate household income in Chelsea in 2022: $248,349,075
Median family income in Chelsea in 2022:
Chelsea:
$130,424
Michigan:
$90,317
Number of families with income $10k - 20k:
Chelsea:
1.0% (13)
Michigan:
3.2% (64,106)
Number of families with income $20k - 30k:
Chelsea:
1.6% (20)
Michigan:
4.6% (91,551)
Number of families with income $30k - 40k:
Chelsea:
2.8% (37)
State:
5.9% (117,356)
Number of families with income $40k - 50k:
Chelsea:
4.7% (61)
Michigan:
6.4% (127,491)
Number of families with income $50k - 60k:
Chelsea:
3.4% (45)
Michigan:
6.8% (135,883)
Number of families with income $60k - 75k:
Chelsea:
12.4% (161)
State:
10.5% (209,130)
Number of families with income $75k - 100k:
Chelsea:
10.0% (130)
Michigan:
15.5% (309,815)
Number of families with income $100k - 125k:
Chelsea:
12.7% (164)
State:
12.4% (248,235)
Number of families with income $125k - 150k:
Chelsea:
10.6% (137)
State:
9.2% (182,895)
Number of families with income $150k - 200k:
Chelsea:
20.8% (270)
State:
11.0% (218,573)
Number of families with income > $200k:
Chelsea:
20.0% (259)
State:
12.0% (239,713)
Median non-family income in Chelsea in 2022:
Chelsea:
$36,627
Michigan:
$42,438
Change in median non-family income between 2000 and 2022:
Chelsea, Michigan:
+27.5%
Michigan:
+56.8%
Median per capita income in Chelsea in 2022:
Chelsea:
$50,432
State:
$41,514
Change in median per capita income between 2000 and 2022:
Chelsea, Michigan:
+82.2%
State:
+75.2%
Income statistics for Black or African American residents
Aggregate household income in Chelsea in 2022: $335,586
Median per capita income in Chelsea in 2022:
Chelsea:
$14,046
Michigan:
$25,207
Income statistics for Asian residents
Aggregate household income in Chelsea in 2022: $456,812
Median per capita income in Chelsea in 2022:
Chelsea:
$42,358
Michigan:
$48,128
Change in median per capita income between 2000 and 2022:
Chelsea, Michigan:
+135.3%
State:
+95.8%
Income statistics for Hispanic or Latino residents
Number of households with income < $10k:
Chelsea:
0.0% (0)
State:
6.0% (10,028)
Number of households with income $10k - 20k:
Chelsea:
0.0% (0)
State:
6.5% (10,959)
Number of households with income $20k - 30k:
Chelsea:
0.0% (0)
State:
9.1% (15,369)
Number of households with income $30k - 40k:
Chelsea:
0.0% (0)
Michigan:
7.9% (13,373)
Number of households with income $40k - 50k:
Chelsea:
0.0% (0)
State:
9.1% (15,369)
Number of households with income $50k - 60k:
Chelsea:
0.0% (0)
State:
8.9% (14,990)
Number of households with income $60k - 75k:
Chelsea:
0.0% (0)
Michigan:
11.5% (19,325)
Number of households with income $75k - 100k:
Chelsea:
0.0% (0)
State:
14.9% (25,158)
Number of households with income $100k - 125k:
Chelsea:
0.0% (0)
State:
8.8% (14,758)
Number of households with income $125k - 150k:
Chelsea:
0.0% (0)
Michigan:
5.3% (8,915)
Number of households with income $150k - 200k:
Chelsea:
0.0% (0)
State:
6.7% (11,249)
Number of households with income > $200k:
Chelsea:
100.0% (45)
State:
5.3% (8,978)
Aggregate household income in Chelsea in 2022: $18,446,040
Median per capita income in Chelsea in 2022:
Chelsea:
$97,891
State:
$25,462
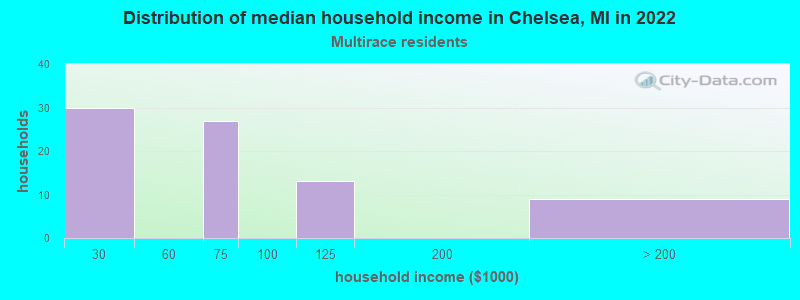
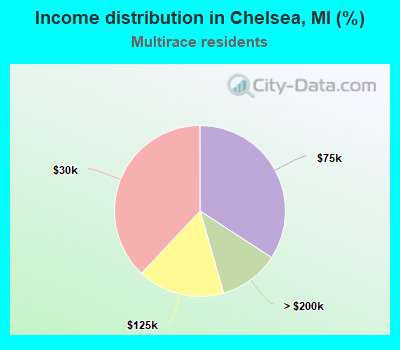
Income statistics for Multirace residents
Number of households with income < $10k:
Chelsea:
0.0% (0)
State:
6.1% (12,463)
Number of households with income $10k - 20k:
Chelsea:
0.0% (0)
State:
8.7% (17,830)
Number of households with income $20k - 30k:
Chelsea:
38.0% (30)
Michigan:
7.6% (15,686)
Number of households with income $30k - 40k:
Chelsea:
0.0% (0)
State:
9.5% (19,444)
Number of households with income $40k - 50k:
Chelsea:
0.0% (0)
State:
7.5% (15,476)
Number of households with income $50k - 60k:
Chelsea:
0.0% (0)
State:
8.1% (16,622)
Number of households with income $60k - 75k:
Chelsea:
34.2% (27)
State:
10.6% (21,725)
Number of households with income $75k - 100k:
Chelsea:
0.0% (0)
Michigan:
14.4% (29,501)
Number of households with income $100k - 125k:
Chelsea:
16.5% (13)
State:
8.9% (18,231)
Number of households with income $125k - 150k:
Chelsea:
0.0% (0)
State:
5.8% (11,923)
Number of households with income $150k - 200k:
Chelsea:
0.0% (0)
Michigan:
6.8% (13,956)
Number of households with income > $200k:
Chelsea:
11.4% (9)
State:
6.2% (12,672)
Aggregate household income in Chelsea in 2022: $9,932,620
Median per capita income in Chelsea in 2022:
Chelsea:
$27,118
Michigan:
$26,098
Change in median per capita income between 2000 and 2022:: -68.7%
Chelsea, Michigan:
-68.7%
State:
+106.5%
Income statistics for other residents
Number of households with income < $10k:
Chelsea:
0.0% (0)
State:
7.8% (4,680)
Number of households with income $10k - 20k:
Chelsea:
0.0% (0)
Michigan:
6.4% (3,815)
Number of households with income $20k - 30k:
Chelsea:
0.0% (0)
Michigan:
9.4% (5,582)
Number of households with income $30k - 40k:
Chelsea:
0.0% (0)
State:
7.3% (4,338)
Number of households with income $40k - 50k:
Chelsea:
0.0% (0)
State:
10.2% (6,092)
Number of households with income $50k - 60k:
Chelsea:
0.0% (0)
State:
8.2% (4,875)
Number of households with income $60k - 75k:
Chelsea:
0.0% (0)
Michigan:
11.6% (6,923)
Number of households with income $75k - 100k:
Chelsea:
0.0% (0)
State:
16.3% (9,741)
Number of households with income $100k - 125k:
Chelsea:
0.0% (0)
State:
8.5% (5,050)
Number of households with income $125k - 150k:
Chelsea:
0.0% (0)
State:
4.7% (2,776)
Number of households with income $150k - 200k:
Chelsea:
0.0% (0)
Michigan:
4.5% (2,682)
Number of households with income > $200k:
Chelsea:
100.0% (27)
State:
5.2% (3,111)
Aggregate household income in Chelsea in 2022: $1,418,274
Median per capita income in Chelsea in 2022:
Chelsea:
$12,210
State:
$27,114
Change in median per capita income between 2000 and 2022:
Chelsea, Michigan:
+9.5%
Michigan:
+104.6%
Discuss Chelsea, Michigan (MI) on our hugely popular Michigan forum.