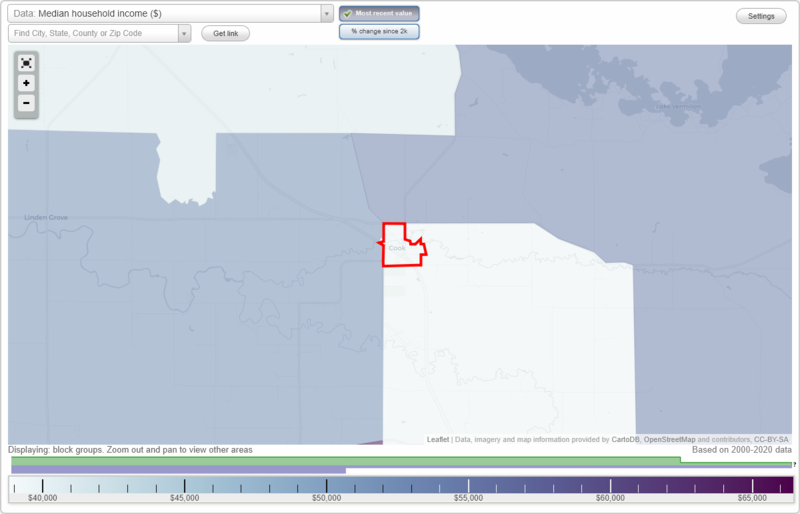
The median household income in Cook, MN in 2022 was $41,258, which was 99.6% less than the median annual income of $82,338 across the entire state of Minnesota. Compared to the median income of $21,607 in 2000 this represents an increase of 47.6%. The per capita income in 2022 was $35,580, which means an increase of 55.5% compared to 2000 when it was $15,848.
Whole page based on the data from 2000 / 2022 when the population of Cook, Minnesota was 622 / 458
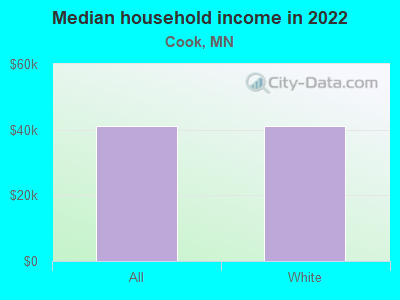
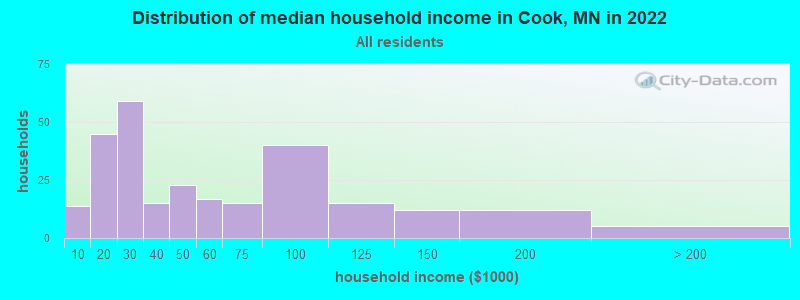
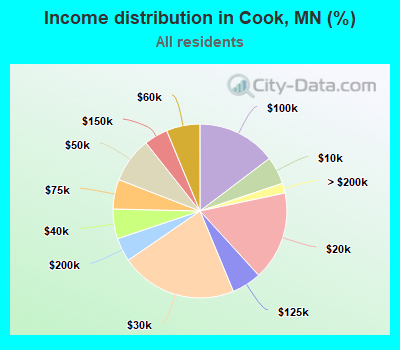
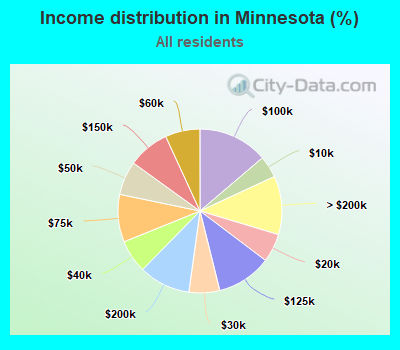
Income statistics for all residents
Median household income in Cook, MN in 2022:
Cook:
$41,258
State:
$82,338
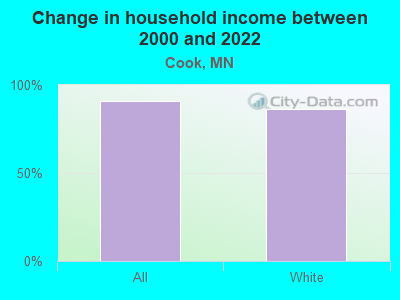
Change in median household income between 2000 and 2022:
Cook, Minnesota:
+90.9%
State:
+74.8%
Number of households with income < $10k:
Cook:
5.1% (14)
State:
4.3% (100,518)
Number of households with income $10k - 20k:
Cook:
16.5% (45)
State:
5.6% (130,945)
Number of households with income $20k - 30k:
Cook:
21.7% (59)
State:
6.1% (140,637)
Number of households with income $30k - 40k:
Cook:
5.5% (15)
State:
6.5% (151,862)
Number of households with income $40k - 50k:
Cook:
8.5% (23)
Minnesota:
6.7% (154,930)
Number of households with income $50k - 60k:
Cook:
6.2% (17)
State:
6.9% (159,181)
Number of households with income $60k - 75k:
Cook:
5.5% (15)
State:
9.4% (218,220)
Number of households with income $75k - 100k:
Cook:
14.7% (40)
State:
13.8% (319,951)
Number of households with income $100k - 125k:
Cook:
5.5% (15)
State:
10.8% (251,243)
Number of households with income $125k - 150k:
Cook:
4.4% (12)
State:
8.2% (190,349)
Number of households with income $150k - 200k:
Cook:
4.4% (12)
State:
10.2% (236,018)
Number of households with income > $200k:
Cook:
1.8% (5)
State:
11.6% (268,336)
Aggregate household income in Cook in 2022: $15,820,201
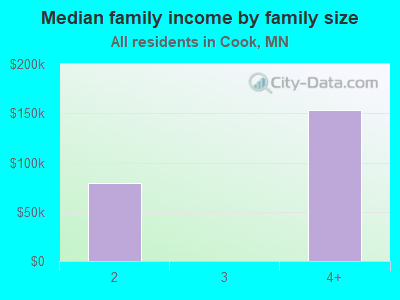
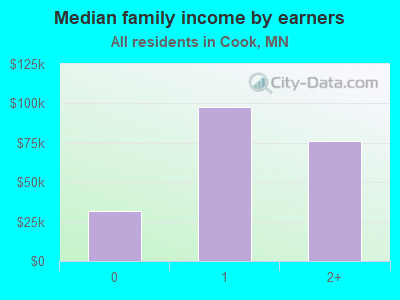
Median family income in Cook in 2022:
Cook:
$77,026
State:
$105,324
Number of families with income < $10k:
Cook:
2.5% (2)
State:
2.2% (31,728)
Number of families with income $10k - 20k:
Cook:
3.7% (3)
State:
2.5% (36,635)
Number of families with income $20k - 30k:
Cook:
11.0% (9)
State:
3.5% (50,742)
Number of families with income $30k - 40k:
Cook:
3.9% (3)
State:
4.4% (64,281)
Number of families with income $40k - 50k:
Cook:
5.6% (5)
State:
5.2% (76,436)
Number of families with income $50k - 60k:
Cook:
5.5% (5)
State:
5.7% (83,050)
Number of families with income $60k - 75k:
Cook:
10.6% (9)
Minnesota:
8.8% (127,783)
Number of families with income $75k - 100k:
Cook:
19.2% (16)
State:
14.7% (214,426)
Number of families with income $100k - 125k:
Cook:
15.4% (13)
State:
13.1% (190,094)
Number of families with income $125k - 150k:
Cook:
9.9% (8)
State:
10.3% (149,830)
Number of families with income $150k - 200k:
Cook:
6.9% (6)
State:
13.6% (197,479)
Number of families with income > $200k:
Cook:
5.9% (5)
State:
16.1% (233,828)
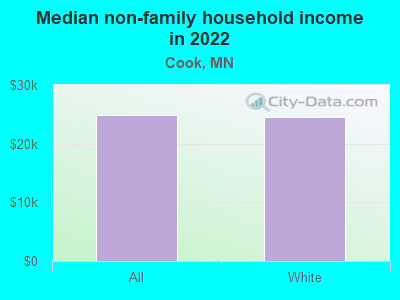
Median non-family income in Cook in 2022:
Cook:
$24,918
State:
$48,461
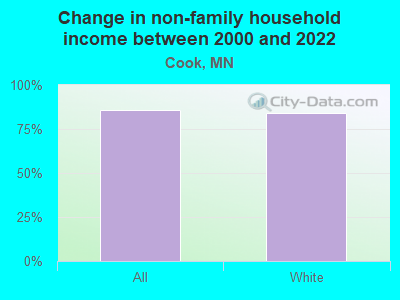
Change in median non-family income between 2000 and 2022:
Cook, Minnesota:
+86.1%
State:
+73.6%
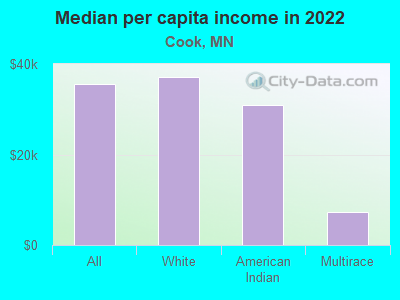
Median per capita income in Cook in 2022:
Cook:
$35,581
Minnesota:
$45,021
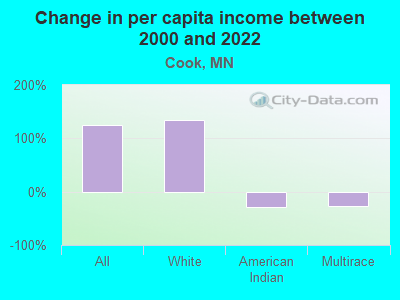
Change in median per capita income between 2000 and 2022:
Cook, Minnesota:
+124.5%
State:
+94.1%
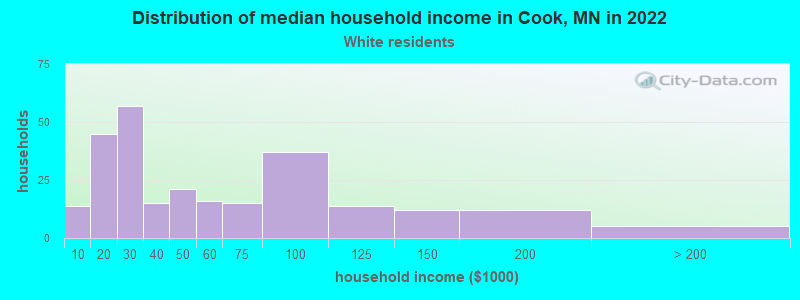
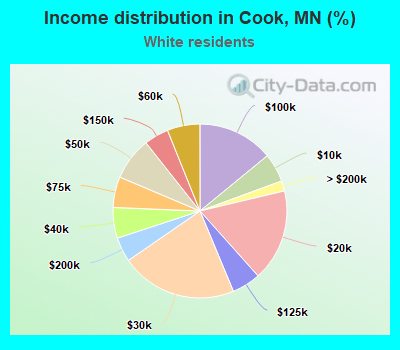
Income statistics for White residents
Median household income in Cook, MN in 2022:
Cook:
$41,221
State:
$85,697
Change in median household income between 2000 and 2022:
Cook, Minnesota:
+86.2%
State:
+77.5%
Number of households with income < $10k:
Cook:
5.3% (14)
Minnesota:
3.9% (74,145)
Number of households with income $10k - 20k:
Cook:
17.1% (45)
State:
5.1% (97,289)
Number of households with income $20k - 30k:
Cook:
21.7% (57)
Minnesota:
5.8% (111,536)
Number of households with income $30k - 40k:
Cook:
5.7% (15)
State:
6.2% (118,402)
Number of households with income $40k - 50k:
Cook:
8.0% (21)
State:
6.6% (126,331)
Number of households with income $50k - 60k:
Cook:
6.1% (16)
State:
6.8% (129,961)
Number of households with income $60k - 75k:
Cook:
5.7% (15)
State:
9.4% (181,337)
Number of households with income $75k - 100k:
Cook:
14.1% (37)
Minnesota:
13.8% (265,776)
Number of households with income $100k - 125k:
Cook:
5.3% (14)
State:
11.2% (214,803)
Number of households with income $125k - 150k:
Cook:
4.6% (12)
State:
8.6% (164,715)
Number of households with income $150k - 200k:
Cook:
4.6% (12)
Minnesota:
10.6% (203,283)
Number of households with income > $200k:
Cook:
1.9% (5)
Minnesota:
12.2% (233,694)
Aggregate household income in Cook in 2022: $15,464,290
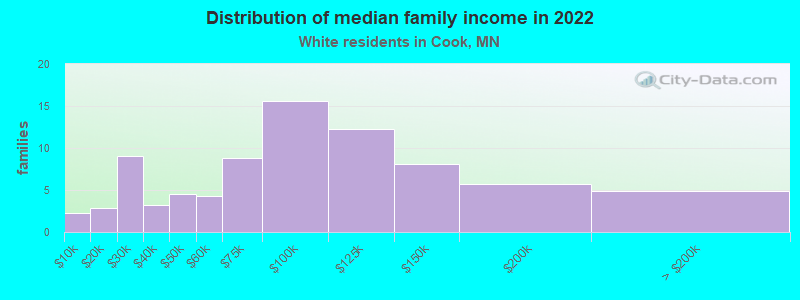
Median family income in Cook in 2022:
Cook:
$77,167
Minnesota:
$110,049
Number of families with income < $10k:
Cook:
2.8% (2)
State:
1.5% (17,407)
Number of families with income $10k - 20k:
Cook:
3.5% (3)
State:
1.9% (22,955)
Number of families with income $20k - 30k:
Cook:
11.1% (9)
Minnesota:
2.9% (34,913)
Number of families with income $30k - 40k:
Cook:
4.0% (3)
State:
3.7% (44,598)
Number of families with income $40k - 50k:
Cook:
5.6% (5)
Minnesota:
4.9% (58,683)
Number of families with income $50k - 60k:
Cook:
5.3% (4)
State:
5.4% (64,644)
Number of families with income $60k - 75k:
Cook:
10.8% (9)
Minnesota:
8.9% (105,839)
Number of families with income $75k - 100k:
Cook:
19.2% (16)
State:
14.8% (177,106)
Number of families with income $100k - 125k:
Cook:
15.0% (12)
State:
13.6% (162,292)
Number of families with income $125k - 150k:
Cook:
9.9% (8)
State:
10.9% (130,417)
Number of families with income $150k - 200k:
Cook:
7.0% (6)
State:
14.3% (171,257)
Number of families with income > $200k:
Cook:
6.0% (5)
State:
17.1% (204,721)
Median non-family income in Cook in 2022:
Cook:
$24,628
State:
$49,920
Change in median non-family income between 2000 and 2022:
Cook, Minnesota:
+83.9%
State:
+76.0%
Median per capita income in Cook in 2022:
Cook:
$37,018
Minnesota:
$49,507
Change in median per capita income between 2000 and 2022:
Cook, Minnesota:
+134.5%
State:
+103.3%
Income statistics for American Indian and Alaska Native residents
Aggregate household income in Cook in 2022: $1,196,882
Median per capita income in Cook in 2022:
Cook:
$30,993
State:
$24,180
Change in median per capita income between 2000 and 2022:: -27.9%
Cook, Minnesota:
-27.9%
State:
+85.4%
Income statistics for Multirace residents
Median per capita income in Cook in 2022:
Cook:
$7,251
State:
$28,529
Change in median per capita income between 2000 and 2022:: -26.3%
Cook, Minnesota:
-26.3%
State:
+155.0%
Discuss Cook, Minnesota (MN) on our hugely popular Minnesota forum.