Derby, Vermont (VT) income map, earnings map, and wages data
The median household income in Derby, VT in 2022 was $64,388, which was 14.9% less than the median annual income of $73,991 across the entire state of Vermont. Compared to the median income of $35,313 in 2000 this represents an increase of 45.2%. The per capita income in 2022 was $35,210, which means an increase of 51.2% compared to 2000 when it was $17,192.
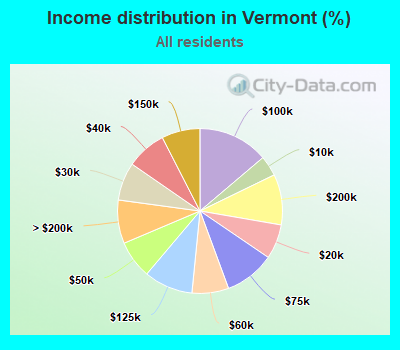
Income statistics for all residents
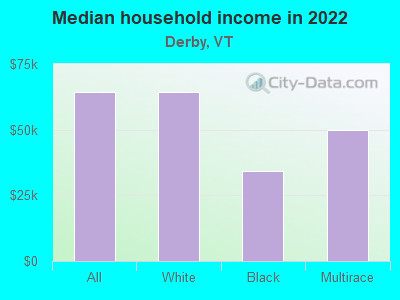
Median household income in Derby, VT in 2022:| Derby: | $64,388 |
| State: | $73,991 |
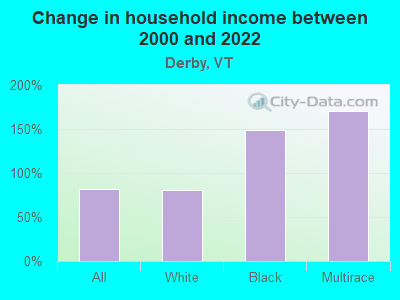
Change in median household income between 2000 and 2022:| Derby, Vermont: | +82.3% |
| Vermont: | +81.1% |
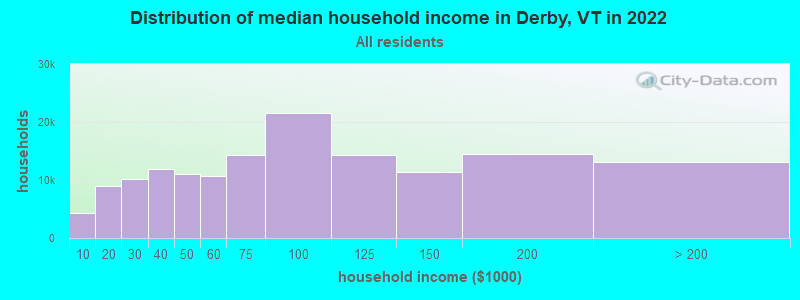
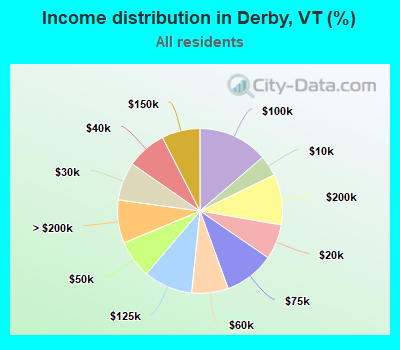
Number of households with income < $10k:| Derby: | 4.1% (4,917) |
| State: | 4.0% (11,050) |
Number of households with income $10k - 20k:| Derby: | 6.9% (8,280) |
| Vermont: | 6.8% (18,853) |
Number of households with income $20k - 30k:| Derby: | 7.5% (9,045) |
| State: | 7.5% (20,673) |
Number of households with income $30k - 40k:| Derby: | 7.8% (9,431) |
| Vermont: | 7.8% (21,750) |
Number of households with income $40k - 50k:| Derby: | 7.4% (8,970) |
| State: | 7.4% (20,642) |
Number of households with income $50k - 60k:| Derby: | 7.2% (8,640) |
| State: | 7.2% (19,901) |
Number of households with income $60k - 75k:| Derby: | 9.9% (11,909) |
| State: | 9.9% (27,351) |
Number of households with income $75k - 100k:| Derby: | 13.7% (16,544) |
| State: | 13.8% (38,275) |
Number of households with income $100k - 125k:| Derby: | 9.6% (11,566) |
| State: | 9.6% (26,632) |
Number of households with income $125k - 150k:| Derby: | 7.5% (9,041) |
| Vermont: | 7.5% (20,857) |
Number of households with income $150k - 200k:| Derby: | 9.9% (11,948) |
| Vermont: | 9.9% (27,469) |
Number of households with income > $200k:| Derby: | 8.5% (10,235) |
| State: | 8.5% (23,637) |
Aggregate household income in Derby in 2022: $492,887,007
Median family income in Derby in 2022:| Derby: | $80,444 |
| State: | $96,345 |
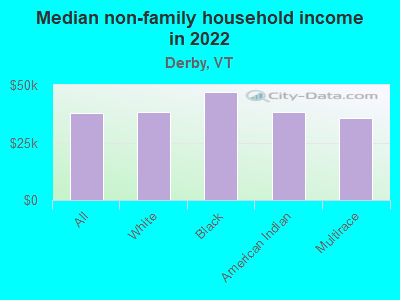
Median non-family income in Derby in 2022:| Derby: | $38,038 |
| State: | $46,022 |
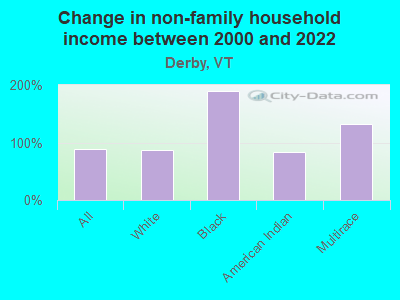
Change in median non-family income between 2000 and 2022:| Derby, Vermont: | +87.9% |
| State: | +87.4% |
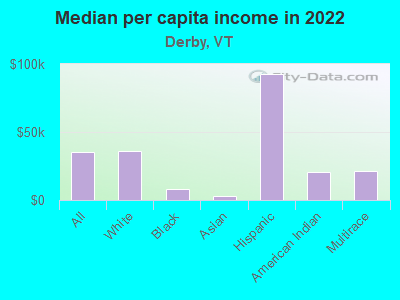
Median per capita income in Derby in 2022:| Derby: | $35,211 |
| State: | $42,251 |
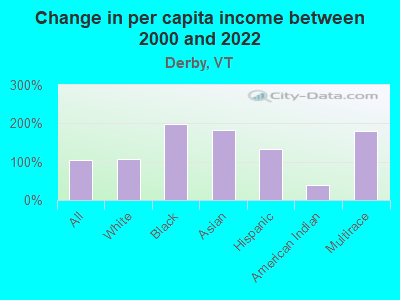
Change in median per capita income between 2000 and 2022:| Derby, Vermont: | +104.8% |
| Vermont: | +104.9% |
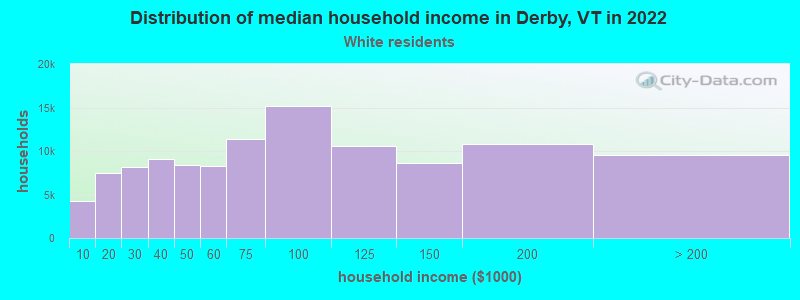
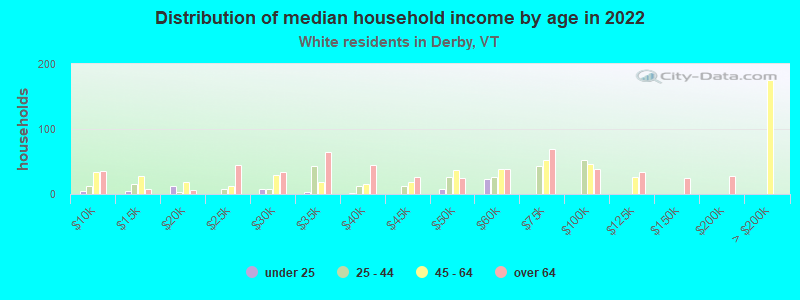
Income statistics for White residents
Median household income in Derby, VT in 2022:| Derby: | $64,390 |
| Vermont: | $73,591 |
Change in median household income between 2000 and 2022:| Derby, Vermont: | +80.8% |
| State: | +79.2% |
Number of households with income < $10k:| Derby: | 3.8% (4,221) |
| Vermont: | 3.7% (9,508) |
Number of households with income $10k - 20k:| Derby: | 6.7% (7,507) |
| State: | 6.7% (17,064) |
Number of households with income $20k - 30k:| Derby: | 7.3% (8,130) |
| State: | 7.2% (18,552) |
Number of households with income $30k - 40k:| Derby: | 8.1% (9,083) |
| Vermont: | 8.2% (20,886) |
Number of households with income $40k - 50k:| Derby: | 7.5% (8,358) |
| Vermont: | 7.5% (19,216) |
Number of households with income $50k - 60k:| Derby: | 7.4% (8,222) |
| Vermont: | 7.4% (18,898) |
Number of households with income $60k - 75k:| Derby: | 10.2% (11,334) |
| Vermont: | 10.1% (25,944) |
Number of households with income $75k - 100k:| Derby: | 13.6% (15,147) |
| State: | 13.7% (34,991) |
Number of households with income $100k - 125k:| Derby: | 9.5% (10,607) |
| State: | 9.5% (24,409) |
Number of households with income $125k - 150k:| Derby: | 7.7% (8,571) |
| Vermont: | 7.7% (19,710) |
Number of households with income $150k - 200k:| Derby: | 9.7% (10,781) |
| State: | 9.7% (24,802) |
Number of households with income > $200k:| Derby: | 8.5% (9,526) |
| State: | 8.6% (21,983) |
Aggregate household income in Derby in 2022: $450,706,644
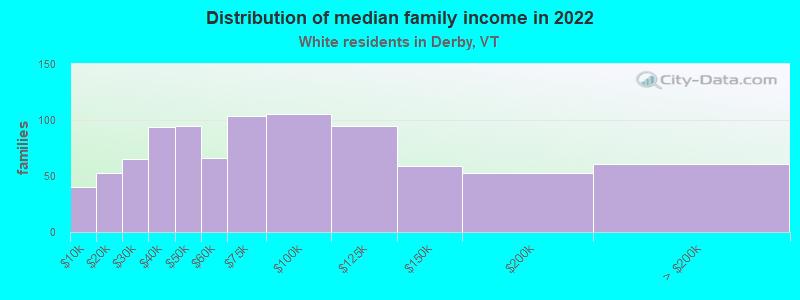
Median family income in Derby in 2022:| Derby: | $80,003 |
| State: | $96,147 |
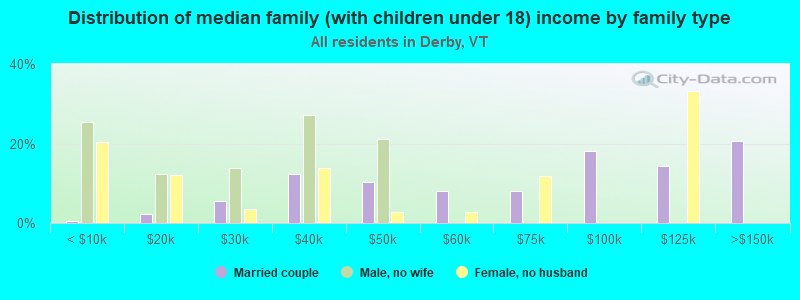
Number of families with income < $10k:| Derby: | 4.5% (40) |
| State: | 1.8% (2,669) |
Number of families with income $10k - 20k:| Derby: | 6.0% (53) |
| Vermont: | 3.1% (4,686) |
Number of families with income $20k - 30k:| Derby: | 7.3% (65) |
| Vermont: | 4.1% (6,266) |
Number of families with income $30k - 40k:| Derby: | 10.6% (94) |
| State: | 6.1% (9,273) |
Number of families with income $40k - 50k:| Derby: | 10.6% (95) |
| Vermont: | 6.4% (9,714) |
Number of families with income $50k - 60k:| Derby: | 7.4% (66) |
| Vermont: | 6.1% (9,310) |
Number of families with income $60k - 75k:| Derby: | 11.7% (104) |
| Vermont: | 9.3% (14,175) |
Number of families with income $75k - 100k:| Derby: | 11.8% (105) |
| State: | 15.5% (23,673) |
Number of families with income $100k - 125k:| Derby: | 10.7% (95) |
| Vermont: | 12.7% (19,323) |
Number of families with income $125k - 150k:| Derby: | 6.6% (59) |
| State: | 9.7% (14,805) |
Number of families with income $150k - 200k:| Derby: | 6.0% (53) |
| Vermont: | 13.1% (20,018) |
Number of families with income > $200k:| Derby: | 6.8% (61) |
| State: | 12.1% (18,463) |
Median non-family income in Derby in 2022:| Derby: | $38,284 |
| State: | $45,952 |
Change in median non-family income between 2000 and 2022:| Derby, Vermont: | +86.8% |
| Vermont: | +86.1% |
Median per capita income in Derby in 2022:| Derby: | $36,124 |
| State: | $43,031 |
Change in median per capita income between 2000 and 2022:| Derby, Vermont: | +106.2% |
| State: | +106.0% |
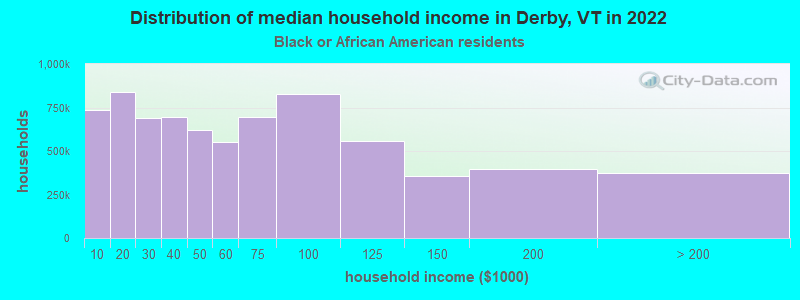
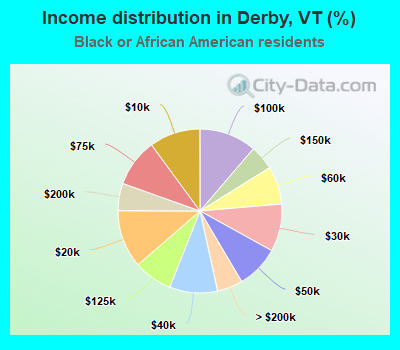
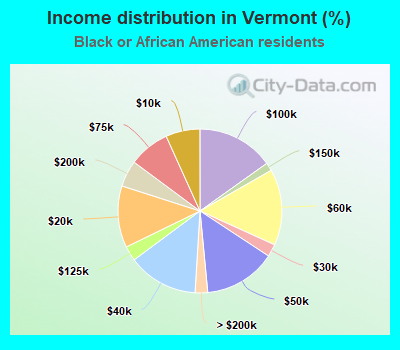
Income statistics for Black or African American residents
Median household income in Derby, VT in 2022:| Derby: | $34,222 |
| State: | $78,611 |
Change in median household income between 2000 and 2022:| Derby, Vermont: | +148.9% |
| State: | +148.9% |
Number of households with income < $10k:| Derby: | 10.1% (737,954) |
| State: | 6.8% (152) |
Number of households with income $10k - 20k:| Derby: | 11.4% (836,873) |
| Vermont: | 12.2% (274) |
Number of households with income $20k - 30k:| Derby: | 9.4% (688,544) |
| State: | 2.5% (56) |
Number of households with income $30k - 40k:| Derby: | 9.5% (693,664) |
| State: | 13.9% (312) |
Number of households with income $40k - 50k:| Derby: | 8.5% (621,773) |
| State: | 14.2% (320) |
Number of households with income $50k - 60k:| Derby: | 7.5% (549,306) |
| Vermont: | 15.0% (338) |
Number of households with income $60k - 75k:| Derby: | 9.5% (695,333) |
| State: | 8.1% (182) |
Number of households with income $75k - 100k:| Derby: | 11.3% (828,854) |
| State: | 15.2% (341) |
Number of households with income $100k - 125k:| Derby: | 7.6% (559,994) |
| Vermont: | 2.9% (66) |
Number of households with income $125k - 150k:| Derby: | 4.9% (356,613) |
| State: | 1.6% (36) |
Number of households with income $150k - 200k:| Derby: | 5.4% (396,155) |
| State: | 5.2% (117) |
Number of households with income > $200k:| Derby: | 5.1% (371,237) |
| Vermont: | 2.5% (56) |
Aggregate household income in Derby in 2022: $671,353
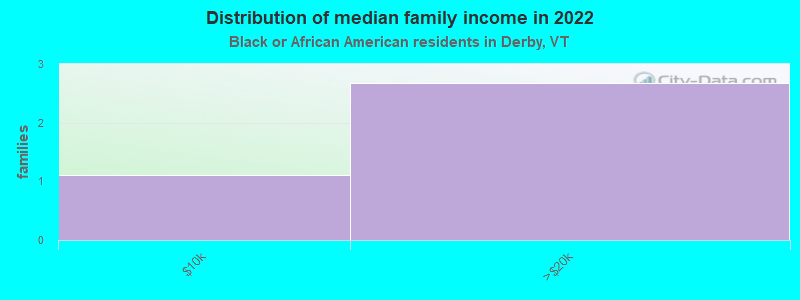
Median family income in Derby in 2022:| Derby: | $41,950 |
| Vermont: | $120,113 |
Median non-family income in Derby in 2022:| Derby: | $47,140 |
| State: | $73,733 |
Median per capita income in Derby in 2022:| Derby: | $8,129 |
| State: | $40,315 |
Income statistics for Asian residents
Number of households with income < $10k:| Derby: | 5.3% (18,077) |
| State: | 8.9% (278) |
Number of households with income $10k - 20k:| Derby: | 4.8% (16,318) |
| State: | 5.9% (184) |
Number of households with income $20k - 30k:| Derby: | 4.7% (15,972) |
| State: | 8.3% (258) |
Number of households with income $30k - 40k:| Derby: | 4.7% (15,854) |
| Vermont: | 8.8% (273) |
Number of households with income $40k - 50k:| Derby: | 4.6% (15,612) |
| State: | 9.7% (302) |
Number of households with income $50k - 60k:| Derby: | 4.8% (16,204) |
| State: | 3.4% (106) |
Number of households with income $60k - 75k:| Derby: | 6.9% (23,238) |
| State: | 6.5% (202) |
Number of households with income $75k - 100k:| Derby: | 10.9% (36,813) |
| State: | 14.6% (455) |
Number of households with income $100k - 125k:| Derby: | 10.0% (33,748) |
| Vermont: | 9.8% (305) |
Number of households with income $125k - 150k:| Derby: | 7.8% (26,556) |
| State: | 2.7% (85) |
Number of households with income $150k - 200k:| Derby: | 11.8% (40,080) |
| Vermont: | 11.8% (369) |
Number of households with income > $200k:| Derby: | 23.7% (80,463) |
| State: | 9.6% (299) |
Median per capita income in Derby in 2022:| Derby: | $3,077 |
| Vermont: | $32,037 |
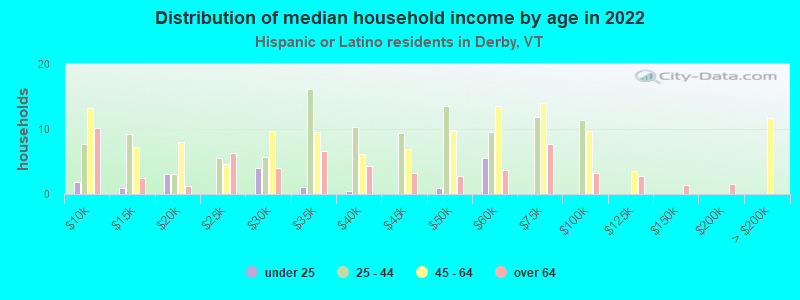
Income statistics for Hispanic or Latino residents
Number of households with income < $10k:| Derby: | 9.2% (1,273) |
| State: | 9.2% (500) |
Number of households with income $10k - 20k:| Derby: | 5.3% (733) |
| State: | 5.3% (288) |
Number of households with income $20k - 30k:| Derby: | 3.7% (516) |
| State: | 3.7% (203) |
Number of households with income $30k - 40k:| Derby: | 5.3% (733) |
| Vermont: | 5.3% (288) |
Number of households with income $40k - 50k:| Derby: | 7.0% (965) |
| State: | 7.0% (379) |
Number of households with income $50k - 60k:| Derby: | 6.9% (957) |
| State: | 6.9% (376) |
Number of households with income $60k - 75k:| Derby: | 5.2% (718) |
| Vermont: | 5.2% (282) |
Number of households with income $75k - 100k:| Derby: | 16.7% (2,304) |
| State: | 16.7% (905) |
Number of households with income $100k - 125k:| Derby: | 12.6% (1,736) |
| Vermont: | 12.6% (682) |
Number of households with income $125k - 150k:| Derby: | 12.3% (1,703) |
| State: | 12.3% (669) |
Number of households with income $150k - 200k:| Derby: | 7.6% (1,049) |
| State: | 7.6% (412) |
Number of households with income > $200k:| Derby: | 8.3% (1,145) |
| State: | 8.3% (450) |
Median per capita income in Derby in 2022:| Derby: | $92,954 |
| State: | $36,311 |
Change in median per capita income between 2000 and 2022:| Derby, Vermont: | +132.4% |
| State: | +131.1% |
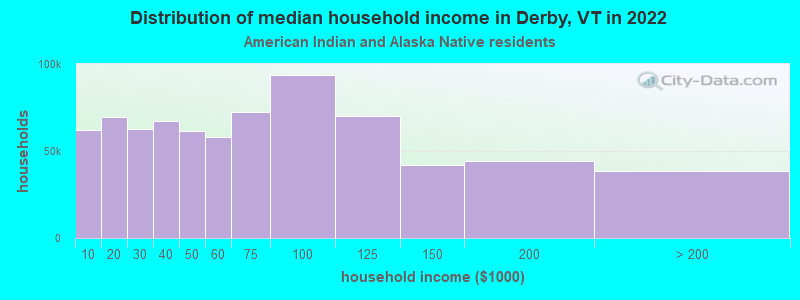
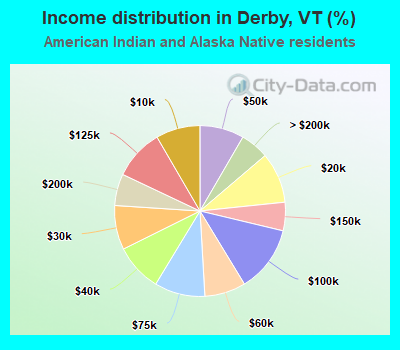
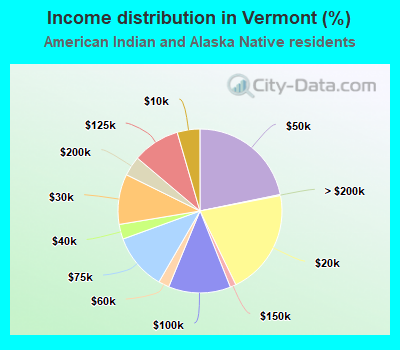
Income statistics for American Indian and Alaska Native residents
Number of households with income < $10k:| Derby: | 8.4% (14) |
| State: | 4.5% (23) |
Number of households with income $10k - 20k:| Derby: | 9.6% (16) |
| Vermont: | 20.8% (107) |
Number of households with income $20k - 30k:| Derby: | 8.4% (14) |
| Vermont: | 9.9% (51) |
Number of households with income $30k - 40k:| Derby: | 9.0% (15) |
| Vermont: | 2.9% (15) |
Number of households with income $40k - 50k:| Derby: | 8.4% (14) |
| Vermont: | 21.8% (112) |
Number of households with income $50k - 60k:| Derby: | 7.8% (13) |
| Vermont: | 2.1% (11) |
Number of households with income $60k - 75k:| Derby: | 9.6% (16) |
| State: | 11.1% (57) |
Number of households with income $75k - 100k:| Derby: | 12.6% (21) |
| State: | 12.3% (63) |
Number of households with income $100k - 125k:| Derby: | 9.6% (16) |
| Vermont: | 9.3% (48) |
Number of households with income $125k - 150k:| Derby: | 5.4% (9) |
| State: | 1.2% (6) |
Number of households with income $150k - 200k:| Derby: | 6.0% (10) |
| State: | 3.9% (20) |
Number of households with income > $200k:| Derby: | 5.4% (9) |
| Vermont: | 0.2% (1) |
Aggregate household income in Derby in 2022: $219,223
Median non-family income in Derby in 2022:| Derby: | $38,218 |
| State: | $47,925 |
Change in median non-family income between 2000 and 2022:| Derby, Vermont: | +83.4% |
| Vermont: | +130.6% |
Median per capita income in Derby in 2022:| Derby: | $20,582 |
| State: | $19,747 |
Change in median per capita income between 2000 and 2022:| Derby, Vermont: | +37.8% |
| State: | +41.4% |
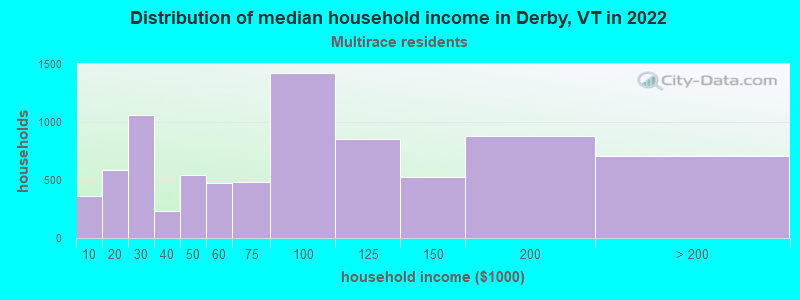
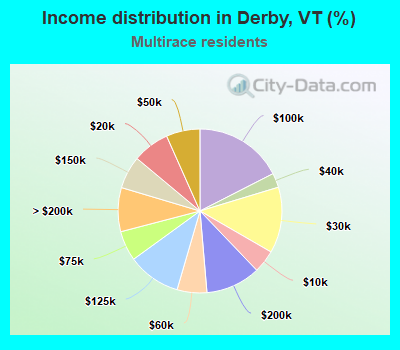
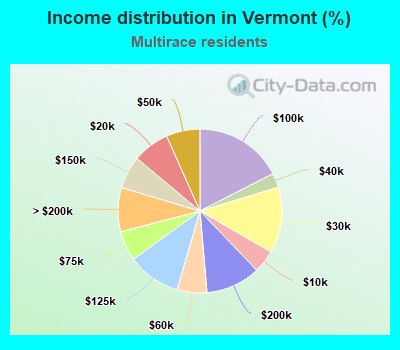
Income statistics for Multirace residents
Median household income in Derby, VT in 2022:| Derby: | $50,015 |
| State: | $81,819 |
Number of households with income < $10k:| Derby: | 4.5% (366) |
| State: | 4.5% (613) |
Number of households with income $10k - 20k:| Derby: | 7.3% (590) |
| State: | 7.3% (988) |
Number of households with income $20k - 30k:| Derby: | 13.0% (1,057) |
| Vermont: | 13.0% (1,770) |
Number of households with income $30k - 40k:| Derby: | 2.8% (230) |
| State: | 2.8% (386) |
Number of households with income $40k - 50k:| Derby: | 6.7% (540) |
| State: | 6.7% (904) |
Number of households with income $50k - 60k:| Derby: | 5.9% (476) |
| Vermont: | 5.9% (797) |
Number of households with income $60k - 75k:| Derby: | 5.9% (480) |
| Vermont: | 5.9% (804) |
Number of households with income $75k - 100k:| Derby: | 17.5% (1,419) |
| State: | 17.5% (2,376) |
Number of households with income $100k - 125k:| Derby: | 10.5% (852) |
| State: | 10.5% (1,427) |
Number of households with income $125k - 150k:| Derby: | 6.5% (524) |
| State: | 6.5% (877) |
Number of households with income $150k - 200k:| Derby: | 10.8% (876) |
| State: | 10.8% (1,467) |
Number of households with income > $200k:| Derby: | 8.7% (705) |
| State: | 8.7% (1,180) |
Aggregate household income in Derby in 2022: $6,601,009
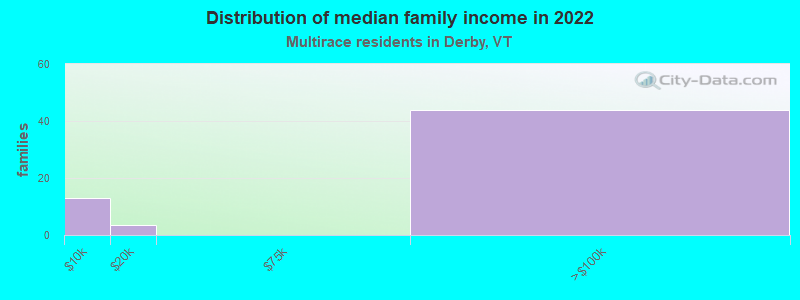
Median family income in Derby in 2022:| Derby: | $56,267 |
| State: | $98,198 |
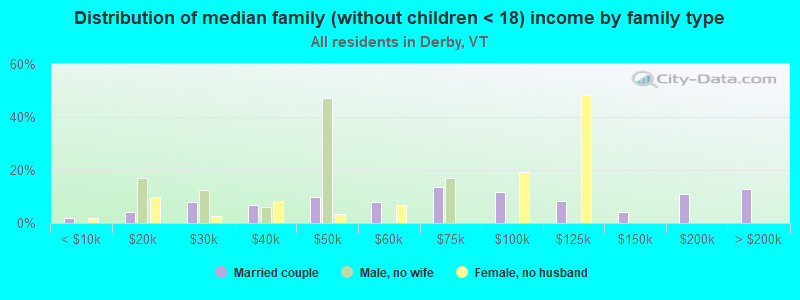
Number of families with income < $10k:| Derby: | 21.5% (13) |
| Vermont: | 5.7% (461) |
Number of families with income $10k - 20k:| Derby: | 6.0% (4) |
| State: | 7.0% (571) |
Number of families with income $75k - 100k:| Derby: | 72.6% (44) |
| State: | 19.2% (1,562) |
Median non-family income in Derby in 2022:| Derby: | $35,775 |
| State: | $44,940 |
Change in median non-family income between 2000 and 2022:| Derby, Vermont: | +132.0% |
| State: | +160.3% |
Median per capita income in Derby in 2022:| Derby: | $21,108 |
| State: | $34,567 |