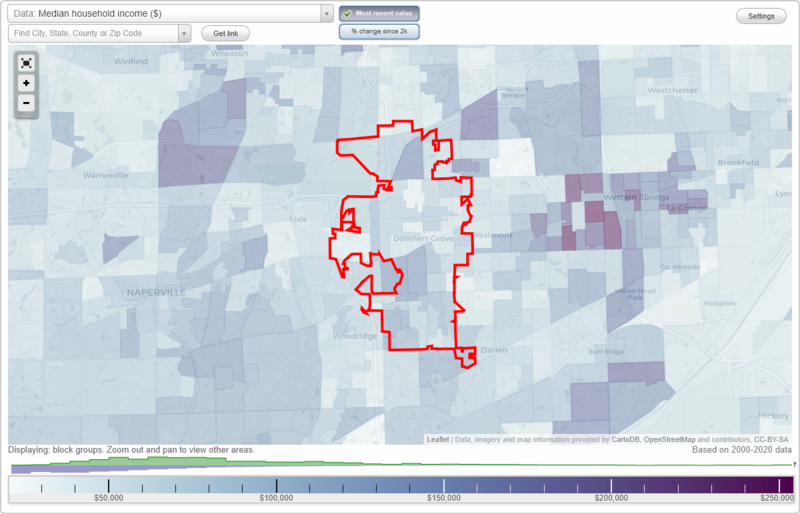
The median household income in Downers Grove, IL in 2022 was $110,193, which was 30.4% greater than the median annual income of $76,708 across the entire state of Illinois. Compared to the median income of $65,539 in 2000 this represents an increase of 40.5%. The per capita income in 2022 was $65,349, which means an increase of 51.7% compared to 2000 when it was $31,580.
Whole page based on the data from 2000 / 2022 when the population of Downers Grove, Illinois was 48,724 / 49,477
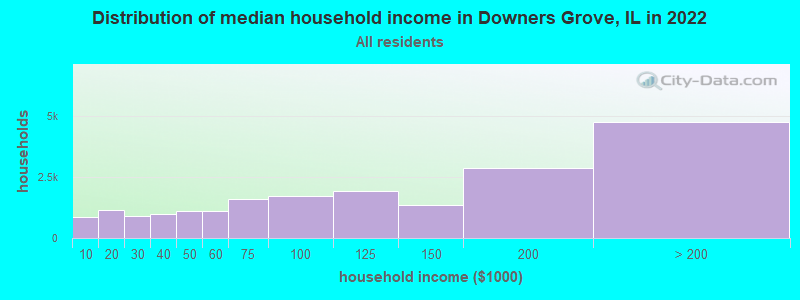
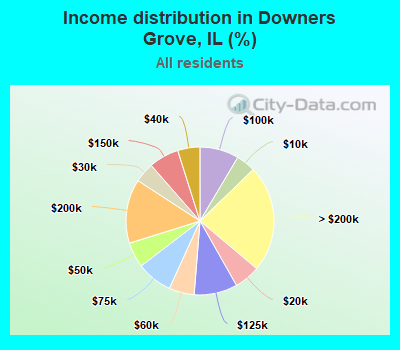
Income statistics for all residents
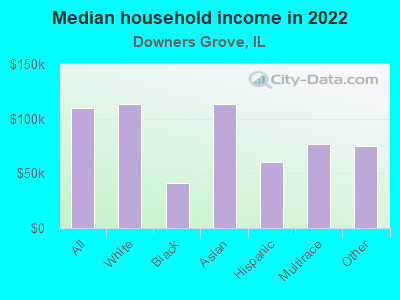
Median household income in Downers Grove, IL in 2022:
Downers Grove:
$110,194
State:
$76,708
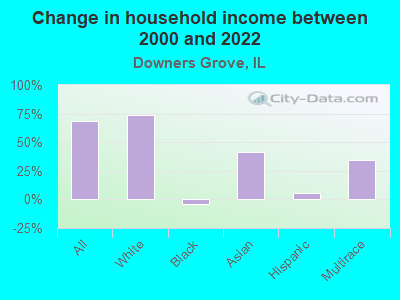
Change in median household income between 2000 and 2022:
Downers Grove, Illinois:
+68.1%
State:
+64.6%
Number of households with income < $10k:
Downers Grove:
4.2% (856)
Illinois:
5.9% (296,090)
Number of households with income $10k - 20k:
Downers Grove:
5.7% (1,156)
State:
6.6% (333,259)
Number of households with income $20k - 30k:
Downers Grove:
4.4% (886)
Illinois:
6.8% (342,921)
Number of households with income $30k - 40k:
Downers Grove:
4.9% (988)
State:
7.0% (355,254)
Number of households with income $40k - 50k:
Downers Grove:
5.5% (1,125)
State:
6.7% (340,678)
Number of households with income $50k - 60k:
Downers Grove:
5.5% (1,123)
State:
6.7% (339,405)
Number of households with income $60k - 75k:
Downers Grove:
7.8% (1,590)
Illinois:
9.2% (465,709)
Number of households with income $75k - 100k:
Downers Grove:
8.5% (1,737)
State:
12.9% (651,353)
Number of households with income $100k - 125k:
Downers Grove:
9.5% (1,922)
State:
10.3% (522,359)
Number of households with income $125k - 150k:
Downers Grove:
6.6% (1,339)
Illinois:
7.3% (367,136)
Number of households with income $150k - 200k:
Downers Grove:
14.0% (2,848)
State:
9.0% (455,249)
Number of households with income > $200k:
Downers Grove:
23.4% (4,746)
State:
11.6% (586,947)
Aggregate household income in Downers Grove in 2022: $3,204,178,499
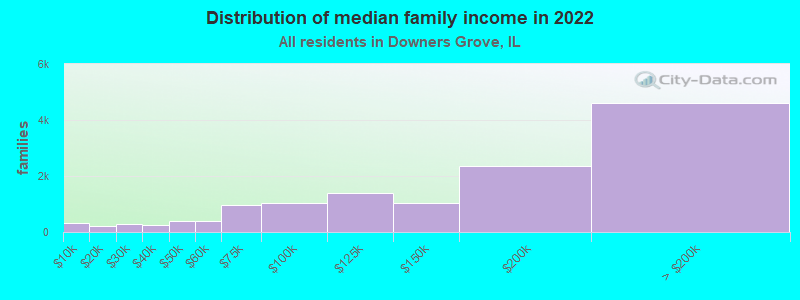
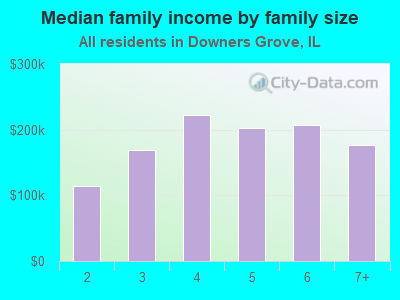
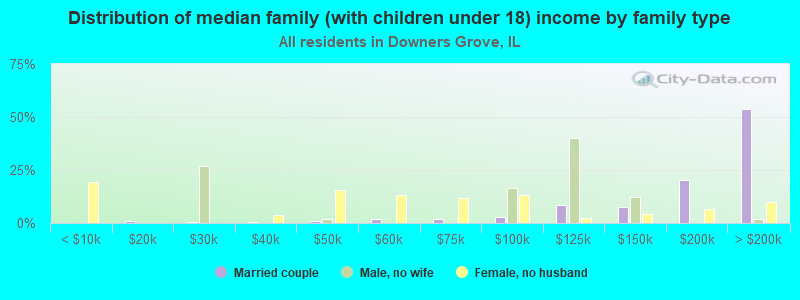
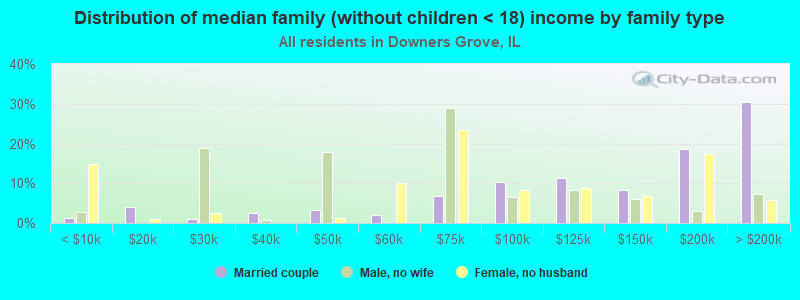
Median family income in Downers Grove in 2022:
Downers Grove:
$152,126
Illinois:
$96,948
Number of families with income < $10k:
Downers Grove:
2.5% (335)
Illinois:
3.4% (105,875)
Number of families with income $10k - 20k:
Downers Grove:
1.6% (208)
State:
3.3% (105,017)
Number of families with income $20k - 30k:
Downers Grove:
2.1% (281)
State:
4.7% (146,403)
Number of families with income $30k - 40k:
Downers Grove:
1.8% (236)
State:
5.3% (167,069)
Number of families with income $40k - 50k:
Downers Grove:
3.0% (397)
State:
5.8% (181,164)
Number of families with income $50k - 60k:
Downers Grove:
2.9% (386)
State:
6.1% (191,561)
Number of families with income $60k - 75k:
Downers Grove:
7.2% (959)
Illinois:
9.0% (282,985)
Number of families with income $75k - 100k:
Downers Grove:
7.9% (1,052)
Illinois:
13.8% (432,725)
Number of families with income $100k - 125k:
Downers Grove:
10.6% (1,408)
State:
11.9% (373,296)
Number of families with income $125k - 150k:
Downers Grove:
7.9% (1,046)
Illinois:
8.9% (279,791)
Number of families with income $150k - 200k:
Downers Grove:
17.7% (2,352)
Illinois:
11.9% (372,004)
Number of families with income > $200k:
Downers Grove:
34.7% (4,605)
State:
15.9% (500,033)
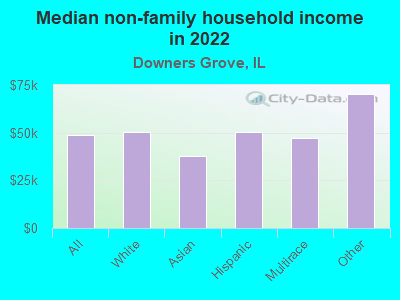
Median non-family income in Downers Grove in 2022:
Downers Grove:
$48,648
State:
$46,533
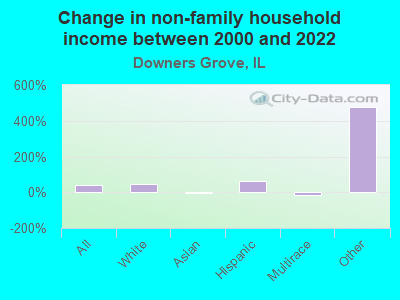
Change in median non-family income between 2000 and 2022:
Downers Grove, Illinois:
+42.9%
State:
+64.0%
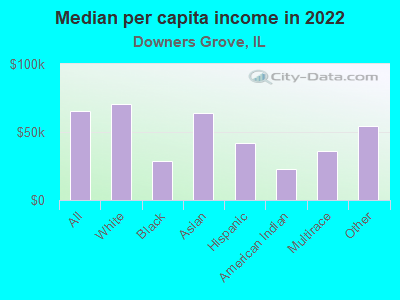
Median per capita income in Downers Grove in 2022:
Downers Grove:
$65,350
Illinois:
$43,317
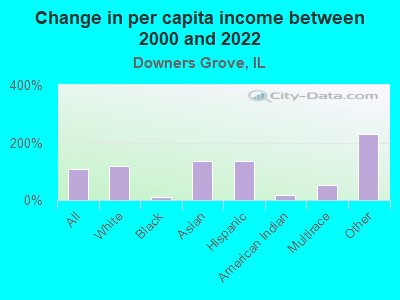
Change in median per capita income between 2000 and 2022:
Downers Grove, Illinois:
+106.9%
Illinois:
+87.5%
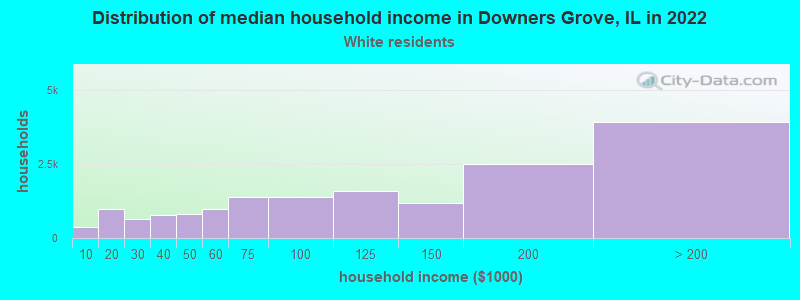
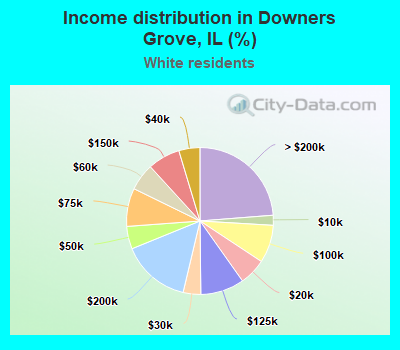
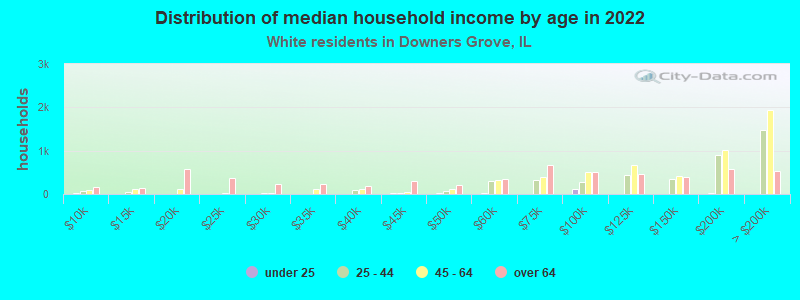
Income statistics for White residents
Median household income in Downers Grove, IL in 2022:
Downers Grove:
$113,530
State:
$83,346
Change in median household income between 2000 and 2022:
Downers Grove, Illinois:
+73.7%
State:
+67.5%
Number of households with income < $10k:
Downers Grove:
2.2% (363)
State:
4.5% (149,895)
Number of households with income $10k - 20k:
Downers Grove:
5.9% (975)
Illinois:
5.5% (184,529)
Number of households with income $20k - 30k:
Downers Grove:
3.9% (642)
State:
6.1% (205,767)
Number of households with income $30k - 40k:
Downers Grove:
4.6% (765)
Illinois:
6.7% (225,572)
Number of households with income $40k - 50k:
Downers Grove:
5.0% (823)
State:
6.5% (216,965)
Number of households with income $50k - 60k:
Downers Grove:
6.0% (988)
State:
6.6% (222,841)
Number of households with income $60k - 75k:
Downers Grove:
8.4% (1,390)
State:
9.3% (312,758)
Number of households with income $75k - 100k:
Downers Grove:
8.3% (1,378)
State:
12.9% (433,180)
Number of households with income $100k - 125k:
Downers Grove:
9.6% (1,590)
State:
10.7% (360,753)
Number of households with income $125k - 150k:
Downers Grove:
7.1% (1,180)
State:
7.9% (266,532)
Number of households with income $150k - 200k:
Downers Grove:
15.1% (2,498)
Illinois:
10.0% (337,357)
Number of households with income > $200k:
Downers Grove:
23.8% (3,924)
State:
13.3% (446,069)
Aggregate household income in Downers Grove in 2022: $2,722,407,630
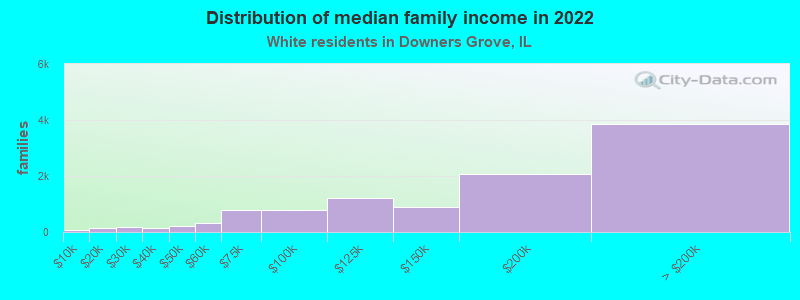
Median family income in Downers Grove in 2022:
Downers Grove:
$165,250
State:
$107,938
Number of families with income < $10k:
Downers Grove:
0.6% (64)
State:
2.2% (45,983)
Number of families with income $10k - 20k:
Downers Grove:
1.3% (136)
State:
2.5% (50,574)
Number of families with income $20k - 30k:
Downers Grove:
1.5% (165)
Illinois:
3.5% (70,927)
Number of families with income $30k - 40k:
Downers Grove:
1.3% (143)
State:
4.4% (90,563)
Number of families with income $40k - 50k:
Downers Grove:
2.0% (216)
State:
5.0% (102,597)
Number of families with income $50k - 60k:
Downers Grove:
3.2% (339)
Illinois:
5.8% (119,129)
Number of families with income $60k - 75k:
Downers Grove:
7.4% (795)
State:
8.8% (179,665)
Number of families with income $75k - 100k:
Downers Grove:
7.3% (780)
State:
13.5% (276,887)
Number of families with income $100k - 125k:
Downers Grove:
11.3% (1,208)
Illinois:
12.5% (256,099)
Number of families with income $125k - 150k:
Downers Grove:
8.4% (900)
State:
9.8% (199,855)
Number of families with income $150k - 200k:
Downers Grove:
19.5% (2,087)
Illinois:
13.4% (274,569)
Number of families with income > $200k:
Downers Grove:
36.0% (3,851)
State:
18.6% (381,354)
Median non-family income in Downers Grove in 2022:
Downers Grove:
$50,276
Illinois:
$50,934
Change in median non-family income between 2000 and 2022:
Downers Grove, Illinois:
+47.2%
State:
+70.7%
Median per capita income in Downers Grove in 2022:
Downers Grove:
$70,669
Illinois:
$50,738
Change in median per capita income between 2000 and 2022:
Downers Grove, Illinois:
+118.4%
State:
+95.5%
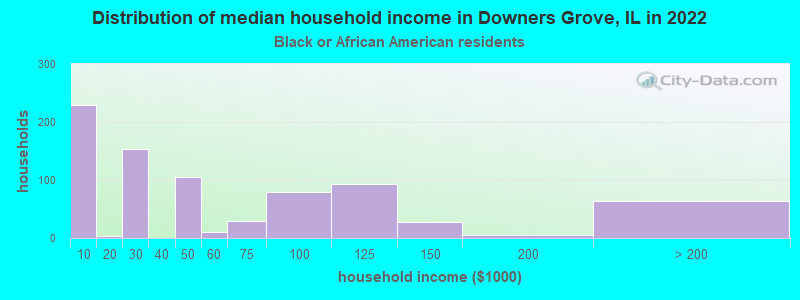
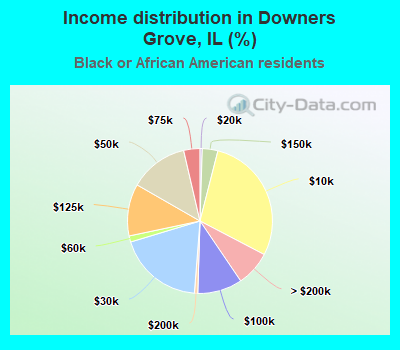
Income statistics for Black or African American residents
Median household income in Downers Grove, IL in 2022:
Downers Grove:
$41,534
State:
$45,019
Change in median household income between 2000 and 2022:: -4.1%
Downers Grove, Illinois:
-4.1%
Illinois:
+42.0%
Number of households with income < $10k:
Downers Grove:
28.7% (230)
State:
13.3% (92,224)
Number of households with income $10k - 20k:
Downers Grove:
0.5% (4)
State:
13.5% (93,732)
Number of households with income $20k - 30k:
Downers Grove:
19.1% (153)
Illinois:
9.9% (68,453)
Number of households with income $30k - 40k:
Downers Grove:
0.0% (0)
Illinois:
8.5% (59,072)
Number of households with income $40k - 50k:
Downers Grove:
13.1% (105)
State:
7.9% (55,033)
Number of households with income $50k - 60k:
Downers Grove:
1.4% (11)
State:
7.2% (49,556)
Number of households with income $60k - 75k:
Downers Grove:
3.6% (29)
Illinois:
7.8% (53,726)
Number of households with income $75k - 100k:
Downers Grove:
10.0% (80)
Illinois:
11.6% (80,439)
Number of households with income $100k - 125k:
Downers Grove:
11.6% (93)
State:
7.5% (52,244)
Number of households with income $125k - 150k:
Downers Grove:
3.5% (28)
State:
3.9% (27,058)
Number of households with income $150k - 200k:
Downers Grove:
0.7% (6)
State:
4.6% (32,057)
Number of households with income > $200k:
Downers Grove:
7.9% (63)
Illinois:
4.1% (28,731)
Aggregate household income in Downers Grove in 2022: $40,939,290
Median per capita income in Downers Grove in 2022:
Downers Grove:
$28,352
State:
$28,045
Change in median per capita income between 2000 and 2022:
Downers Grove, Illinois:
+9.9%
State:
+90.2%
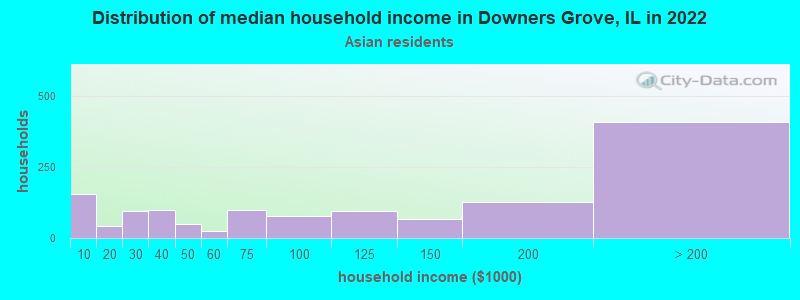
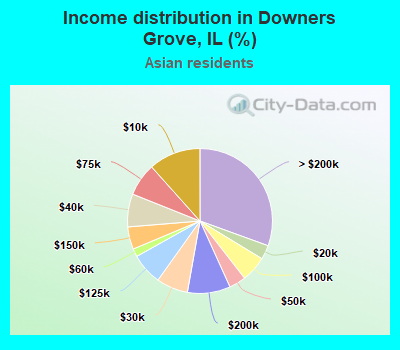
Income statistics for Asian residents
Median household income in Downers Grove, IL in 2022:
Downers Grove:
$113,806
Illinois:
$104,287
Change in median household income between 2000 and 2022:
Downers Grove, Illinois:
+41.6%
State:
+81.9%
Number of households with income < $10k:
Downers Grove:
11.6% (155)
State:
5.3% (14,653)
Number of households with income $10k - 20k:
Downers Grove:
3.1% (42)
State:
4.5% (12,283)
Number of households with income $20k - 30k:
Downers Grove:
7.0% (94)
State:
4.8% (13,135)
Number of households with income $30k - 40k:
Downers Grove:
7.3% (98)
Illinois:
5.0% (13,655)
Number of households with income $40k - 50k:
Downers Grove:
3.7% (50)
Illinois:
4.5% (12,357)
Number of households with income $50k - 60k:
Downers Grove:
1.8% (24)
State:
4.9% (13,568)
Number of households with income $60k - 75k:
Downers Grove:
7.3% (98)
State:
7.1% (19,606)
Number of households with income $75k - 100k:
Downers Grove:
5.8% (77)
State:
12.1% (33,349)
Number of households with income $100k - 125k:
Downers Grove:
7.0% (94)
State:
9.7% (26,669)
Number of households with income $125k - 150k:
Downers Grove:
5.0% (67)
Illinois:
7.3% (20,172)
Number of households with income $150k - 200k:
Downers Grove:
9.6% (128)
Illinois:
11.5% (31,711)
Number of households with income > $200k:
Downers Grove:
30.6% (408)
State:
23.1% (63,411)
Aggregate household income in Downers Grove in 2022: $197,732,340
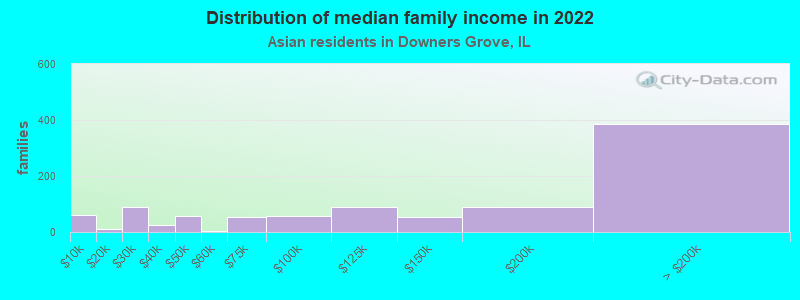
Median family income in Downers Grove in 2022:
Downers Grove:
$132,722
Illinois:
$124,630
Number of families with income < $10k:
Downers Grove:
6.0% (59)
State:
2.0% (3,841)
Number of families with income $10k - 20k:
Downers Grove:
1.2% (12)
Illinois:
2.6% (5,077)
Number of families with income $20k - 30k:
Downers Grove:
9.4% (91)
Illinois:
4.4% (8,618)
Number of families with income $30k - 40k:
Downers Grove:
2.4% (24)
State:
4.4% (8,628)
Number of families with income $40k - 50k:
Downers Grove:
5.9% (58)
Illinois:
3.9% (7,584)
Number of families with income $50k - 60k:
Downers Grove:
0.6% (5)
Illinois:
4.1% (7,974)
Number of families with income $60k - 75k:
Downers Grove:
5.4% (53)
Illinois:
7.0% (13,773)
Number of families with income $75k - 100k:
Downers Grove:
5.9% (58)
Illinois:
12.3% (24,156)
Number of families with income $100k - 125k:
Downers Grove:
9.1% (89)
Illinois:
9.6% (18,808)
Number of families with income $125k - 150k:
Downers Grove:
5.5% (54)
Illinois:
8.0% (15,639)
Number of families with income $150k - 200k:
Downers Grove:
9.3% (90)
State:
13.9% (27,222)
Number of families with income > $200k:
Downers Grove:
39.3% (384)
State:
28.0% (54,999)
Median non-family income in Downers Grove in 2022:
Downers Grove:
$37,937
State:
$57,292
Change in median non-family income between 2000 and 2022:: -6.2%
Downers Grove, Illinois:
-6.2%
State:
+78.3%
Median per capita income in Downers Grove in 2022:
Downers Grove:
$63,925
State:
$52,977
Change in median per capita income between 2000 and 2022:
Downers Grove, Illinois:
+136.3%
State:
+119.5%
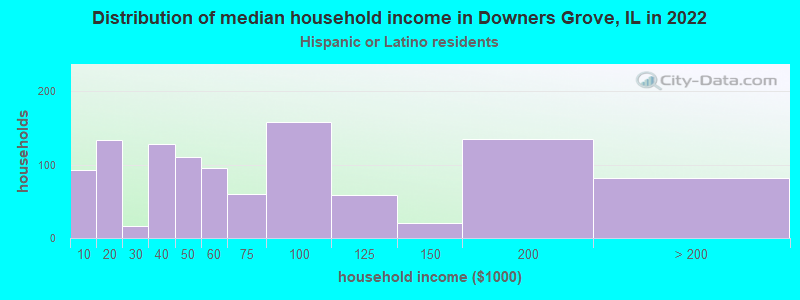
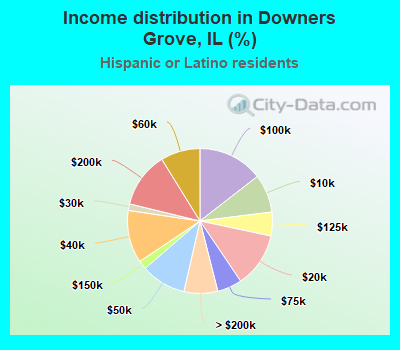
Income statistics for Hispanic or Latino residents
Median household income in Downers Grove, IL in 2022:
Downers Grove:
$60,273
State:
$72,139
Change in median household income between 2000 and 2022:
Downers Grove, Illinois:
+5.8%
Illinois:
+75.7%
Number of households with income < $10k:
Downers Grove:
8.5% (93)
State:
4.9% (33,145)
Number of households with income $10k - 20k:
Downers Grove:
12.2% (133)
State:
5.4% (36,345)
Number of households with income $20k - 30k:
Downers Grove:
1.5% (16)
State:
7.5% (50,677)
Number of households with income $30k - 40k:
Downers Grove:
11.7% (128)
State:
7.7% (52,008)
Number of households with income $40k - 50k:
Downers Grove:
10.1% (110)
State:
8.1% (54,702)
Number of households with income $50k - 60k:
Downers Grove:
8.8% (96)
State:
7.5% (51,062)
Number of households with income $60k - 75k:
Downers Grove:
5.5% (60)
State:
11.3% (76,576)
Number of households with income $75k - 100k:
Downers Grove:
14.5% (158)
State:
15.5% (105,152)
Number of households with income $100k - 125k:
Downers Grove:
5.3% (58)
Illinois:
11.5% (77,760)
Number of households with income $125k - 150k:
Downers Grove:
1.9% (21)
State:
7.3% (49,310)
Number of households with income $150k - 200k:
Downers Grove:
12.4% (135)
State:
7.6% (51,233)
Number of households with income > $200k:
Downers Grove:
7.5% (82)
Illinois:
5.9% (40,028)
Aggregate household income in Downers Grove in 2022: $96,803,892
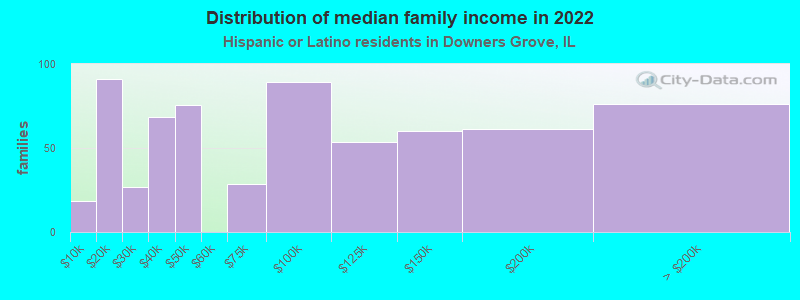
Median family income in Downers Grove in 2022:
Downers Grove:
$75,038
State:
$76,467
Number of families with income < $10k:
Downers Grove:
2.8% (18)
Illinois:
3.8% (19,330)
Number of families with income $10k - 20k:
Downers Grove:
14.0% (91)
State:
3.8% (19,314)
Number of families with income $20k - 30k:
Downers Grove:
4.1% (27)
Illinois:
6.8% (34,467)
Number of families with income $30k - 40k:
Downers Grove:
10.5% (68)
State:
7.5% (37,976)
Number of families with income $40k - 50k:
Downers Grove:
11.7% (76)
State:
7.7% (38,858)
Number of families with income $60k - 75k:
Downers Grove:
4.4% (29)
State:
11.5% (58,164)
Number of families with income $75k - 100k:
Downers Grove:
13.8% (90)
Illinois:
16.0% (81,055)
Number of families with income $100k - 125k:
Downers Grove:
8.2% (53)
State:
12.1% (61,491)
Number of families with income $125k - 150k:
Downers Grove:
9.2% (60)
State:
8.0% (40,271)
Number of families with income $150k - 200k:
Downers Grove:
9.4% (61)
State:
8.6% (43,536)
Number of families with income > $200k:
Downers Grove:
11.7% (76)
Illinois:
6.6% (33,240)
Median non-family income in Downers Grove in 2022:
Downers Grove:
$50,379
State:
$45,965
Change in median non-family income between 2000 and 2022:
Downers Grove, Illinois:
+61.9%
State:
+75.9%
Median per capita income in Downers Grove in 2022:
Downers Grove:
$42,263
State:
$26,551
Change in median per capita income between 2000 and 2022:
Downers Grove, Illinois:
+133.8%
Illinois:
+111.0%
Income statistics for American Indian and Alaska Native residents
Aggregate household income in Downers Grove in 2022: $8,683,902
Median per capita income in Downers Grove in 2022:
Downers Grove:
$22,709
State:
$26,979
Change in median per capita income between 2000 and 2022:
Downers Grove, Illinois:
+16.2%
State:
+64.2%
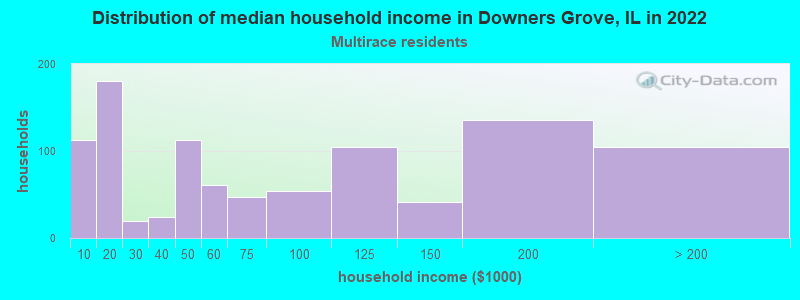
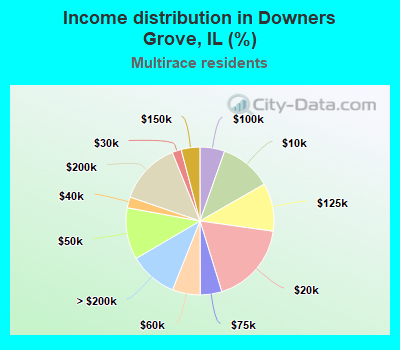
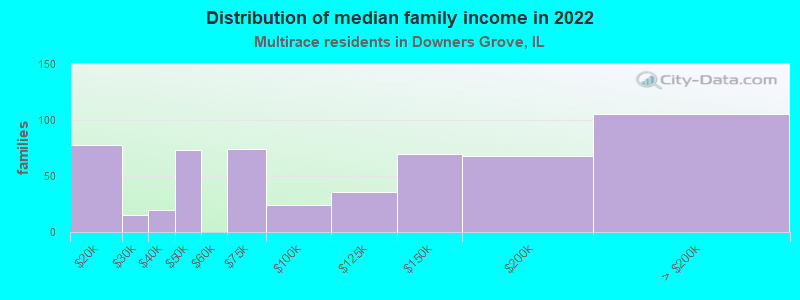
Income statistics for Multirace residents
Median household income in Downers Grove, IL in 2022:
Downers Grove:
$76,815
State:
$71,185
Change in median household income between 2000 and 2022:
Downers Grove, Illinois:
+34.5%
Illinois:
+81.4%
Number of households with income < $10k:
Downers Grove:
11.3% (113)
State:
5.3% (21,595)
Number of households with income $10k - 20k:
Downers Grove:
18.0% (180)
State:
6.5% (26,720)
Number of households with income $20k - 30k:
Downers Grove:
2.0% (20)
State:
8.0% (32,573)
Number of households with income $30k - 40k:
Downers Grove:
2.4% (24)
State:
8.4% (34,383)
Number of households with income $40k - 50k:
Downers Grove:
11.3% (113)
Illinois:
7.4% (30,234)
Number of households with income $50k - 60k:
Downers Grove:
6.1% (61)
Illinois:
6.9% (28,432)
Number of households with income $60k - 75k:
Downers Grove:
4.7% (47)
Illinois:
10.2% (41,780)
Number of households with income $75k - 100k:
Downers Grove:
5.4% (54)
State:
13.0% (53,426)
Number of households with income $100k - 125k:
Downers Grove:
10.5% (105)
Illinois:
10.5% (43,126)
Number of households with income $125k - 150k:
Downers Grove:
4.1% (41)
State:
7.6% (31,153)
Number of households with income $150k - 200k:
Downers Grove:
13.6% (136)
Illinois:
7.6% (30,946)
Number of households with income > $200k:
Downers Grove:
10.5% (105)
Illinois:
8.6% (35,208)
Aggregate household income in Downers Grove in 2022: $111,190,773
Median family income in Downers Grove in 2022:
Downers Grove:
$78,620
Illinois:
$84,400
Number of families with income $10k - 20k:
Downers Grove:
13.9% (78)
State:
4.2% (11,692)
Number of families with income $20k - 30k:
Downers Grove:
2.7% (15)
Illinois:
6.3% (17,559)
Number of families with income $30k - 40k:
Downers Grove:
3.5% (20)
State:
7.5% (20,780)
Number of families with income $40k - 50k:
Downers Grove:
12.9% (73)
Illinois:
7.1% (19,595)
Number of families with income $60k - 75k:
Downers Grove:
13.2% (74)
State:
9.3% (25,936)
Number of families with income $75k - 100k:
Downers Grove:
4.2% (24)
Illinois:
13.6% (37,857)
Number of families with income $100k - 125k:
Downers Grove:
6.3% (36)
Illinois:
12.2% (33,852)
Number of families with income $125k - 150k:
Downers Grove:
12.4% (70)
State:
9.0% (25,085)
Number of families with income $150k - 200k:
Downers Grove:
12.1% (68)
Illinois:
9.5% (26,306)
Number of families with income > $200k:
Downers Grove:
18.7% (105)
State:
10.4% (28,926)
Median non-family income in Downers Grove in 2022:
Downers Grove:
$47,442
State:
$43,615
Change in median non-family income between 2000 and 2022:: -14.8%
Downers Grove, Illinois:
-14.8%
Illinois:
+77.3%
Median per capita income in Downers Grove in 2022:
Downers Grove:
$35,686
State:
$29,285
Change in median per capita income between 2000 and 2022:
Downers Grove, Illinois:
+51.5%
State:
+112.9%
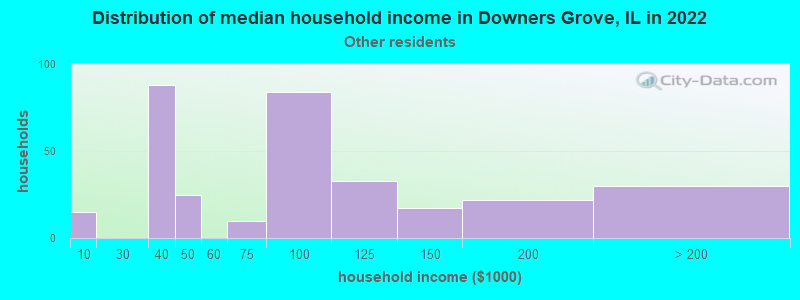
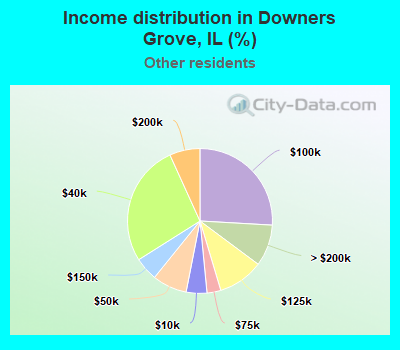
Income statistics for other residents
Median household income in Downers Grove, IL in 2022:
Downers Grove:
$75,329
State:
$71,711
Number of households with income < $10k:
Downers Grove:
4.6% (15)
Illinois:
5.7% (16,383)
Number of households with income $10k - 20k:
Downers Grove:
0.0% (0)
State:
4.8% (13,886)
Number of households with income $20k - 30k:
Downers Grove:
0.0% (0)
Illinois:
7.0% (20,054)
Number of households with income $30k - 40k:
Downers Grove:
27.2% (88)
State:
7.0% (20,038)
Number of households with income $40k - 50k:
Downers Grove:
7.7% (25)
State:
8.3% (23,759)
Number of households with income $50k - 60k:
Downers Grove:
0.0% (0)
Illinois:
7.8% (22,410)
Number of households with income $60k - 75k:
Downers Grove:
3.1% (10)
State:
12.0% (34,448)
Number of households with income $75k - 100k:
Downers Grove:
25.9% (84)
State:
16.2% (46,508)
Number of households with income $100k - 125k:
Downers Grove:
10.2% (33)
Illinois:
12.5% (35,952)
Number of households with income $125k - 150k:
Downers Grove:
5.2% (17)
State:
6.9% (19,732)
Number of households with income $150k - 200k:
Downers Grove:
6.8% (22)
Illinois:
7.5% (21,422)
Number of households with income > $200k:
Downers Grove:
9.3% (30)
State:
4.3% (12,194)
Aggregate household income in Downers Grove in 2022: $41,450,620
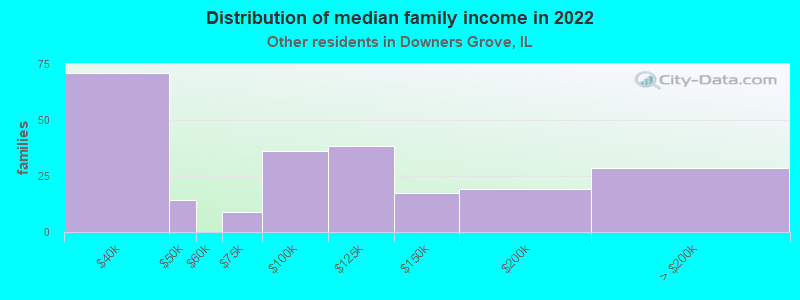
Median family income in Downers Grove in 2022:
Downers Grove:
$101,930
State:
$74,069
Number of families with income $30k - 40k:
Downers Grove:
30.4% (71)
Illinois:
7.6% (17,087)
Number of families with income $40k - 50k:
Downers Grove:
6.1% (14)
Illinois:
8.1% (18,155)
Number of families with income $60k - 75k:
Downers Grove:
3.8% (9)
State:
13.4% (30,011)
Number of families with income $75k - 100k:
Downers Grove:
15.5% (36)
Illinois:
17.2% (38,560)
Number of families with income $100k - 125k:
Downers Grove:
16.4% (38)
State:
12.3% (27,638)
Number of families with income $125k - 150k:
Downers Grove:
7.4% (17)
State:
7.3% (16,287)
Number of families with income $150k - 200k:
Downers Grove:
8.2% (19)
State:
7.7% (17,122)
Number of families with income > $200k:
Downers Grove:
12.2% (29)
Illinois:
4.6% (10,400)
Median non-family income in Downers Grove in 2022:
Downers Grove:
$70,291
State:
$44,975
Median per capita income in Downers Grove in 2022:
Downers Grove:
$54,469
State:
$25,392
Discuss Downers Grove, Illinois (IL) on our hugely popular Illinois forum.