The median household income in East Merrimack, NH in 2022 was $81,760, which was 10.1% less than the median annual income of $89,992 across the entire state of New Hampshire. Compared to the median income of $47,130 in 2000 this represents an increase of 42.4%. The per capita income in 2022 was $49,536, which means an increase of 47.8% compared to 2000 when it was $25,880.
Whole page based on the data from 2000 / 2022 when the population of East Merrimack, New Hampshire was 3,784 / 4,685
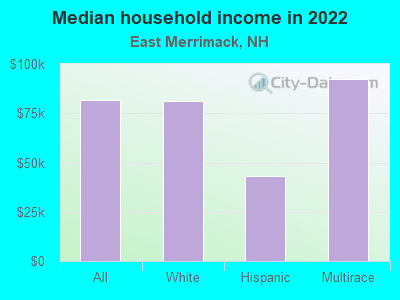
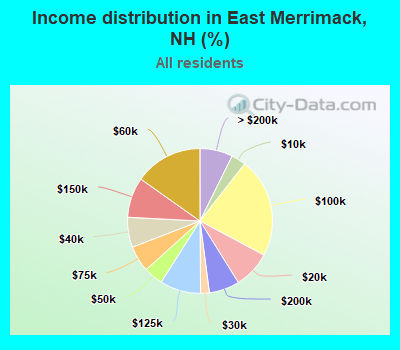
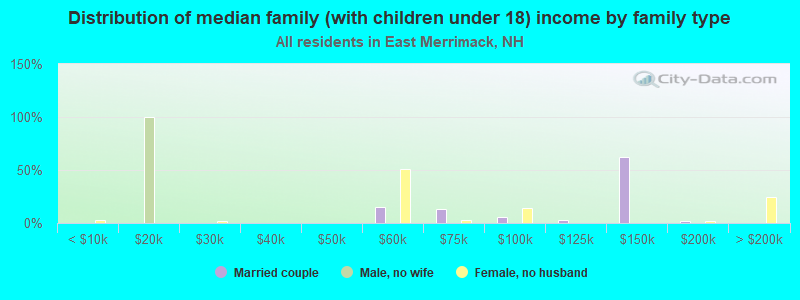
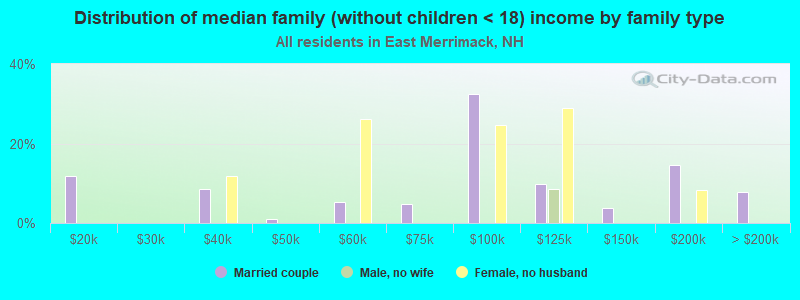
Income statistics for all residents
Median household income in East Merrimack, NH in 2022:
East Merrimack:
$81,760
State:
$89,992
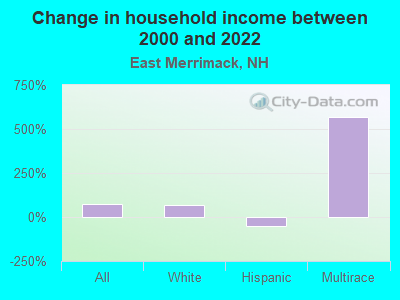
Change in median household income between 2000 and 2022:
East Merrimack, New Hampshire:
+73.5%
State:
+81.9%
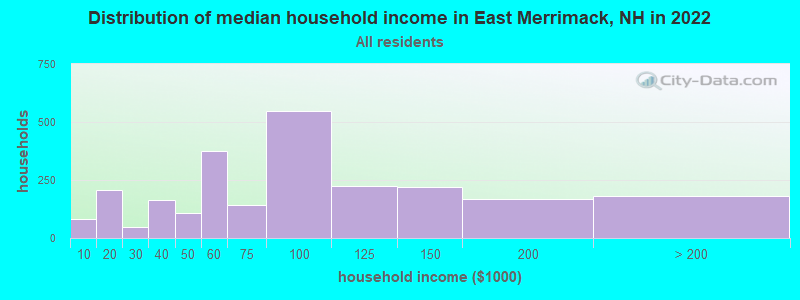
Number of households with income < $10k:
East Merrimack:
3.2% (80)
New Hampshire:
3.1% (17,541)
Number of households with income $10k - 20k:
East Merrimack:
8.3% (205)
New Hampshire:
5.4% (29,916)
Number of households with income $20k - 30k:
East Merrimack:
1.9% (48)
State:
5.5% (30,783)
Number of households with income $30k - 40k:
East Merrimack:
6.7% (165)
State:
5.9% (32,868)
Number of households with income $40k - 50k:
East Merrimack:
4.3% (106)
State:
5.9% (32,728)
Number of households with income $50k - 60k:
East Merrimack:
15.2% (374)
State:
6.9% (38,422)
Number of households with income $60k - 75k:
East Merrimack:
5.8% (143)
State:
9.1% (50,552)
Number of households with income $75k - 100k:
East Merrimack:
22.3% (548)
State:
13.1% (73,145)
Number of households with income $100k - 125k:
East Merrimack:
9.1% (225)
New Hampshire:
10.5% (58,593)
Number of households with income $125k - 150k:
East Merrimack:
9.0% (221)
State:
8.1% (44,878)
Number of households with income $150k - 200k:
East Merrimack:
6.8% (167)
State:
11.5% (64,340)
Number of households with income > $200k:
East Merrimack:
7.3% (180)
State:
15.0% (83,454)
Aggregate household income in East Merrimack in 2022: $229,266,917
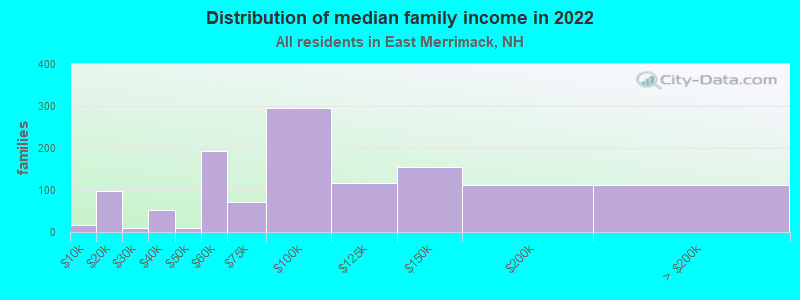
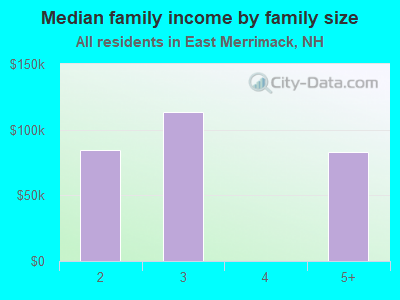
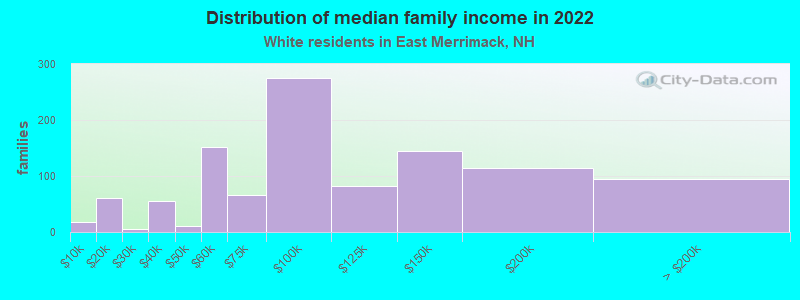
Median family income in East Merrimack in 2022:
East Merrimack:
$88,937
State:
$112,950
Number of families with income < $10k:
East Merrimack:
1.3% (16)
State:
1.6% (5,702)
Number of families with income $10k - 20k:
East Merrimack:
7.9% (98)
New Hampshire:
2.0% (7,188)
Number of families with income $20k - 30k:
East Merrimack:
0.7% (9)
State:
2.9% (10,424)
Number of families with income $30k - 40k:
East Merrimack:
4.3% (53)
State:
4.2% (15,188)
Number of families with income $40k - 50k:
East Merrimack:
0.8% (10)
New Hampshire:
4.6% (16,458)
Number of families with income $50k - 60k:
East Merrimack:
15.6% (193)
State:
5.6% (20,061)
Number of families with income $60k - 75k:
East Merrimack:
5.7% (71)
State:
8.5% (30,386)
Number of families with income $75k - 100k:
East Merrimack:
23.9% (296)
State:
13.9% (49,922)
Number of families with income $100k - 125k:
East Merrimack:
9.3% (116)
New Hampshire:
12.2% (43,562)
Number of families with income $125k - 150k:
East Merrimack:
12.5% (155)
State:
10.1% (36,190)
Number of families with income $150k - 200k:
East Merrimack:
9.1% (113)
New Hampshire:
14.9% (53,418)
Number of families with income > $200k:
East Merrimack:
8.9% (111)
New Hampshire:
19.4% (69,621)
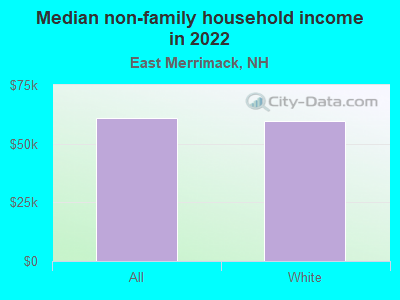
Median non-family income in East Merrimack in 2022:
East Merrimack:
$60,882
New Hampshire:
$52,292
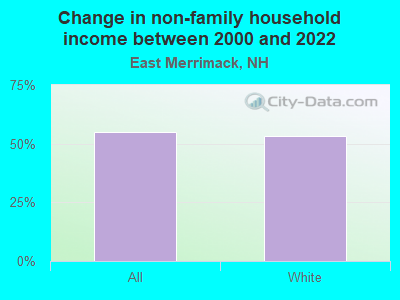
Change in median non-family income between 2000 and 2022:
East Merrimack, New Hampshire:
+55.0%
New Hampshire:
+80.7%
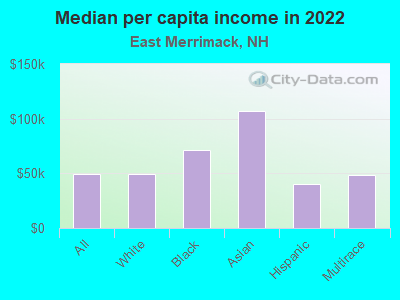
Median per capita income in East Merrimack in 2022:
East Merrimack:
$49,537
State:
$49,281
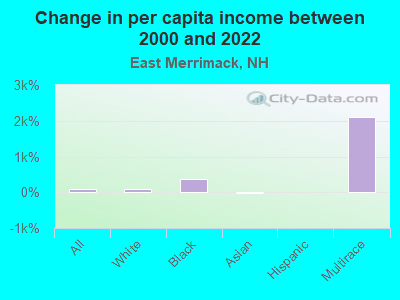
Change in median per capita income between 2000 and 2022:
East Merrimack, New Hampshire:
+91.4%
State:
+106.7%
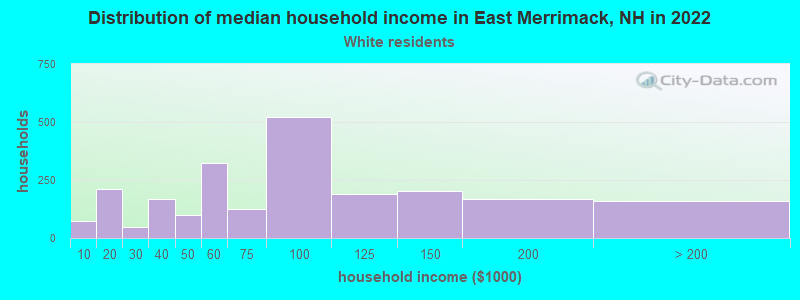
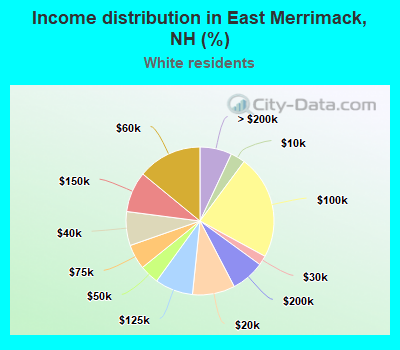
Income statistics for White residents
Median household income in East Merrimack, NH in 2022:
East Merrimack:
$80,975
State:
$90,839
Change in median household income between 2000 and 2022:
East Merrimack, New Hampshire:
+70.5%
State:
+82.8%
Number of households with income < $10k:
East Merrimack:
3.2% (73)
State:
3.1% (15,499)
Number of households with income $10k - 20k:
East Merrimack:
9.3% (213)
State:
5.6% (27,915)
Number of households with income $20k - 30k:
East Merrimack:
2.1% (48)
State:
5.4% (27,382)
Number of households with income $30k - 40k:
East Merrimack:
7.4% (170)
New Hampshire:
5.9% (29,681)
Number of households with income $40k - 50k:
East Merrimack:
4.2% (97)
New Hampshire:
5.7% (28,456)
Number of households with income $50k - 60k:
East Merrimack:
14.0% (322)
State:
6.9% (34,641)
Number of households with income $60k - 75k:
East Merrimack:
5.5% (125)
State:
9.0% (45,144)
Number of households with income $75k - 100k:
East Merrimack:
22.8% (522)
State:
13.0% (65,259)
Number of households with income $100k - 125k:
East Merrimack:
8.3% (191)
State:
10.7% (53,931)
Number of households with income $125k - 150k:
East Merrimack:
8.9% (204)
State:
8.1% (40,466)
Number of households with income $150k - 200k:
East Merrimack:
7.3% (168)
State:
11.9% (59,781)
Number of households with income > $200k:
East Merrimack:
7.0% (160)
State:
14.8% (74,387)
Aggregate household income in East Merrimack in 2022: $209,789,317
Median family income in East Merrimack in 2022:
East Merrimack:
$89,880
State:
$115,125
Number of families with income < $10k:
East Merrimack:
1.7% (18)
New Hampshire:
1.5% (4,767)
Number of families with income $10k - 20k:
East Merrimack:
5.6% (60)
State:
2.1% (6,602)
Number of families with income $20k - 30k:
East Merrimack:
0.5% (5)
State:
2.7% (8,511)
Number of families with income $30k - 40k:
East Merrimack:
5.1% (55)
New Hampshire:
4.0% (12,696)
Number of families with income $40k - 50k:
East Merrimack:
0.9% (10)
State:
4.3% (13,626)
Number of families with income $50k - 60k:
East Merrimack:
14.1% (152)
New Hampshire:
5.6% (17,792)
Number of families with income $60k - 75k:
East Merrimack:
6.2% (66)
State:
8.4% (26,945)
Number of families with income $75k - 100k:
East Merrimack:
25.5% (275)
New Hampshire:
13.8% (44,284)
Number of families with income $100k - 125k:
East Merrimack:
7.7% (83)
New Hampshire:
12.5% (39,959)
Number of families with income $125k - 150k:
East Merrimack:
13.4% (145)
State:
10.3% (33,038)
Number of families with income $150k - 200k:
East Merrimack:
10.5% (114)
State:
15.4% (49,456)
Number of families with income > $200k:
East Merrimack:
8.7% (94)
State:
19.5% (62,442)
Median non-family income in East Merrimack in 2022:
East Merrimack:
$59,745
State:
$51,861
Change in median non-family income between 2000 and 2022:
East Merrimack, New Hampshire:
+53.1%
State:
+79.2%
Median per capita income in East Merrimack in 2022:
East Merrimack:
$49,514
State:
$50,469
Change in median per capita income between 2000 and 2022:
East Merrimack, New Hampshire:
+96.2%
New Hampshire:
+109.2%
Income statistics for Black or African American residents
Median per capita income in East Merrimack in 2022:
East Merrimack:
$71,320
New Hampshire:
$31,675
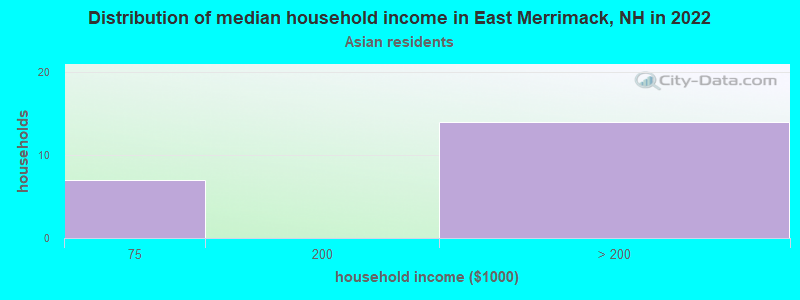
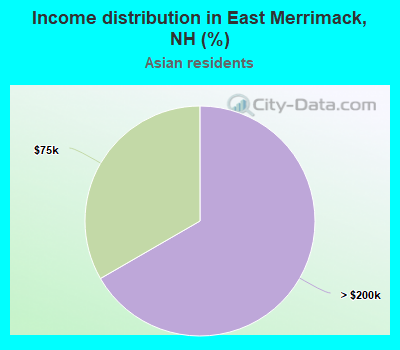
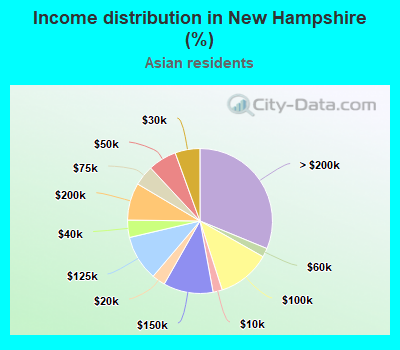
Income statistics for Asian residents
Number of households with income < $10k:
East Merrimack:
0.0% (0)
New Hampshire:
2.1% (271)
Number of households with income $10k - 20k:
East Merrimack:
0.0% (0)
State:
3.0% (393)
Number of households with income $20k - 30k:
East Merrimack:
0.0% (0)
New Hampshire:
5.5% (729)
Number of households with income $30k - 40k:
East Merrimack:
0.0% (0)
State:
3.9% (510)
Number of households with income $40k - 50k:
East Merrimack:
0.0% (0)
New Hampshire:
6.4% (842)
Number of households with income $50k - 60k:
East Merrimack:
0.0% (0)
State:
2.0% (261)
Number of households with income $60k - 75k:
East Merrimack:
33.3% (7)
State:
4.5% (597)
Number of households with income $75k - 100k:
East Merrimack:
0.0% (0)
State:
11.8% (1,559)
Number of households with income $100k - 125k:
East Merrimack:
0.0% (0)
New Hampshire:
10.1% (1,334)
Number of households with income $125k - 150k:
East Merrimack:
0.0% (0)
State:
11.1% (1,463)
Number of households with income $150k - 200k:
East Merrimack:
0.0% (0)
State:
8.3% (1,095)
Number of households with income > $200k:
East Merrimack:
66.7% (14)
State:
31.2% (4,111)
Aggregate household income in East Merrimack in 2022: $10,195,098
Median per capita income in East Merrimack in 2022:
East Merrimack:
$106,773
State:
$64,014
Change in median per capita income between 2000 and 2022:: -13.1%
East Merrimack, New Hampshire:
-13.1%
State:
+197.2%
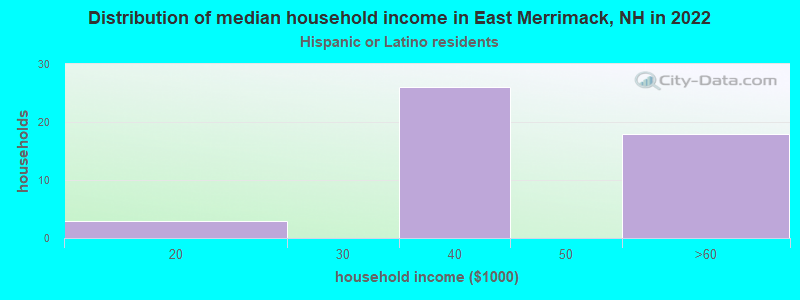
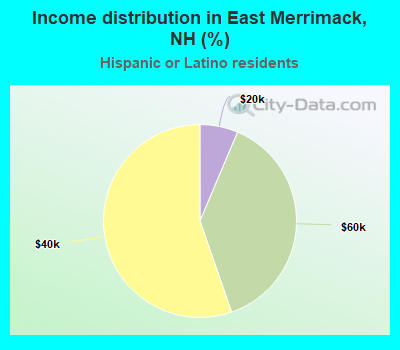
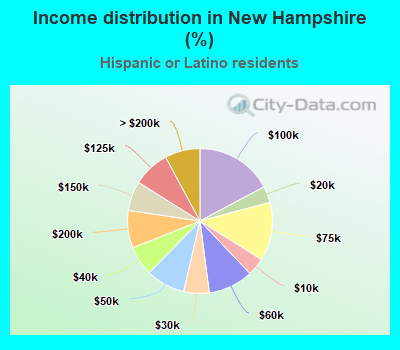
Income statistics for Hispanic or Latino residents
Median household income in East Merrimack, NH in 2022:
East Merrimack:
$42,935
State:
$73,813
Change in median household income between 2000 and 2022:: -52.8%
East Merrimack, New Hampshire:
-52.8%
New Hampshire:
+84.6%
Number of households with income < $10k:
East Merrimack:
0.0% (0)
State:
4.0% (695)
Number of households with income $10k - 20k:
East Merrimack:
6.4% (3)
State:
3.7% (639)
Number of households with income $20k - 30k:
East Merrimack:
0.0% (0)
New Hampshire:
5.7% (998)
Number of households with income $30k - 40k:
East Merrimack:
55.3% (26)
New Hampshire:
6.6% (1,151)
Number of households with income $40k - 50k:
East Merrimack:
0.0% (0)
New Hampshire:
8.7% (1,521)
Number of households with income $50k - 60k:
East Merrimack:
38.3% (18)
New Hampshire:
10.0% (1,751)
Number of households with income $60k - 75k:
East Merrimack:
0.0% (0)
State:
13.1% (2,284)
Number of households with income $75k - 100k:
East Merrimack:
0.0% (0)
State:
17.2% (3,004)
Number of households with income $100k - 125k:
East Merrimack:
0.0% (0)
State:
8.2% (1,430)
Number of households with income $125k - 150k:
East Merrimack:
0.0% (0)
State:
6.6% (1,154)
Number of households with income $150k - 200k:
East Merrimack:
0.0% (0)
State:
8.4% (1,462)
Number of households with income > $200k:
East Merrimack:
0.0% (0)
State:
7.9% (1,371)
Aggregate household income in East Merrimack in 2022: $2,424,623
Median per capita income in East Merrimack in 2022:
East Merrimack:
$40,096
State:
$32,911
Change in median per capita income between 2000 and 2022:
East Merrimack, New Hampshire:
+12.6%
New Hampshire:
+127.3%
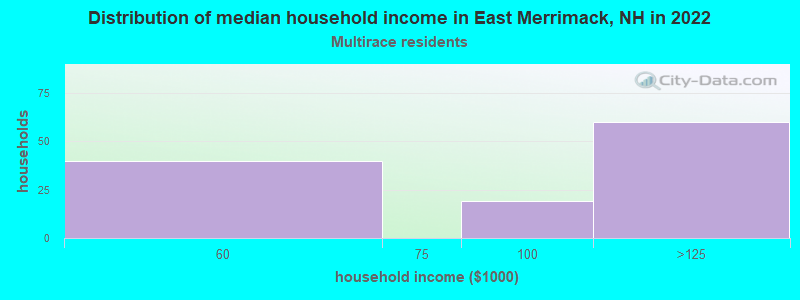
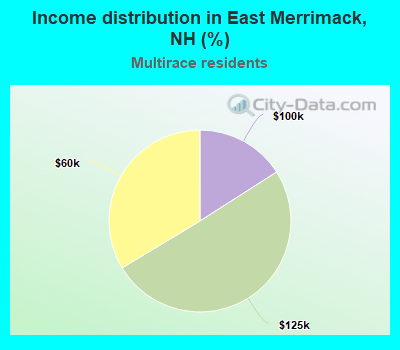
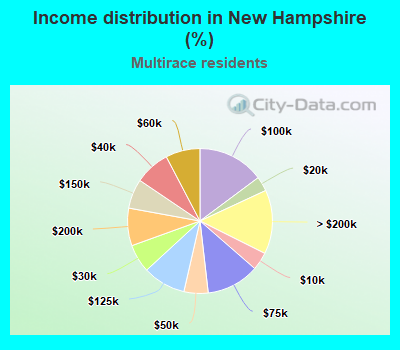
Income statistics for Multirace residents
Median household income in East Merrimack, NH in 2022:
East Merrimack:
$92,199
New Hampshire:
$81,037
Number of households with income < $10k:
East Merrimack:
0.0% (0)
State:
4.0% (1,057)
Number of households with income $10k - 20k:
East Merrimack:
0.0% (0)
State:
3.3% (864)
Number of households with income $20k - 30k:
East Merrimack:
0.0% (0)
State:
6.3% (1,664)
Number of households with income $30k - 40k:
East Merrimack:
0.0% (0)
New Hampshire:
7.9% (2,072)
Number of households with income $40k - 50k:
East Merrimack:
0.0% (0)
State:
5.4% (1,422)
Number of households with income $50k - 60k:
East Merrimack:
33.6% (40)
State:
7.7% (2,024)
Number of households with income $60k - 75k:
East Merrimack:
0.0% (0)
State:
11.8% (3,109)
Number of households with income $75k - 100k:
East Merrimack:
16.0% (19)
New Hampshire:
14.8% (3,906)
Number of households with income $100k - 125k:
East Merrimack:
50.4% (60)
State:
9.6% (2,523)
Number of households with income $125k - 150k:
East Merrimack:
0.0% (0)
New Hampshire:
6.6% (1,734)
Number of households with income $150k - 200k:
East Merrimack:
0.0% (0)
State:
8.4% (2,213)
Number of households with income > $200k:
East Merrimack:
0.0% (0)
State:
14.3% (3,765)
Aggregate household income in East Merrimack in 2022: $9,011,539
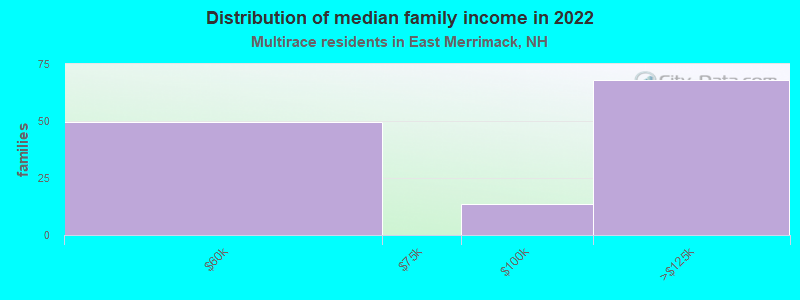
Median family income in East Merrimack in 2022:
East Merrimack:
$99,082
State:
$87,413
Number of families with income $50k - 60k:
East Merrimack:
37.6% (49)
State:
7.4% (1,409)
Number of families with income $75k - 100k:
East Merrimack:
10.5% (14)
State:
17.1% (3,272)
Number of families with income $100k - 125k:
East Merrimack:
51.9% (68)
State:
10.6% (2,030)
Median per capita income in East Merrimack in 2022:
East Merrimack:
$48,902
State:
$34,906
Discuss East Merrimack, New Hampshire (NH) on our hugely popular New Hampshire forum.