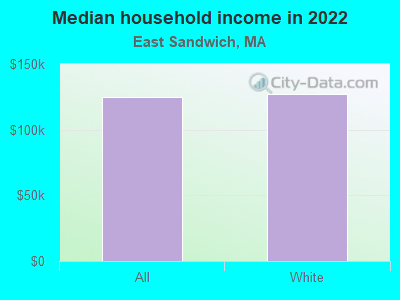
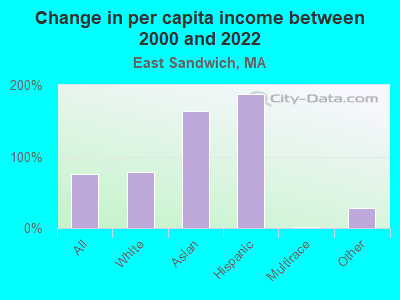
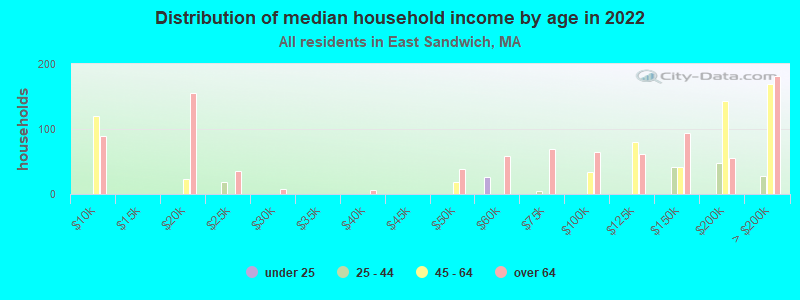
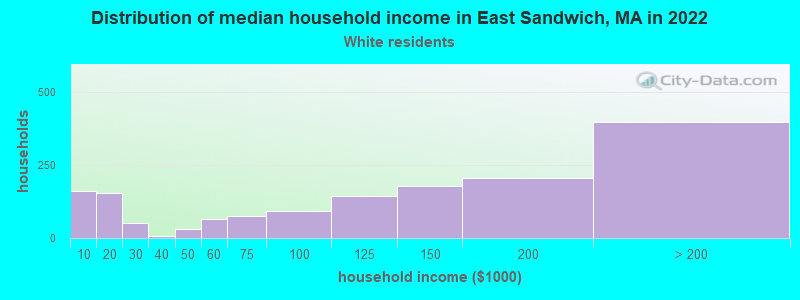
The median household income in East Sandwich, MA in 2022 was $124,924, which was 24.4% greater than the median annual income of $94,488 across the entire state of Massachusetts. Compared to the median income of $66,318 in 2000 this represents an increase of 46.9%. The per capita income in 2022 was $57,220, which means an increase of 42.9% compared to 2000 when it was $32,676.
Whole page based on the data from 2000 / 2022 when the population of East Sandwich, Massachusetts was 3,720 / 3,837
Income statistics for all residents
Median household income in East Sandwich, MA in 2022:
East Sandwich:
$124,925
State:
$94,488
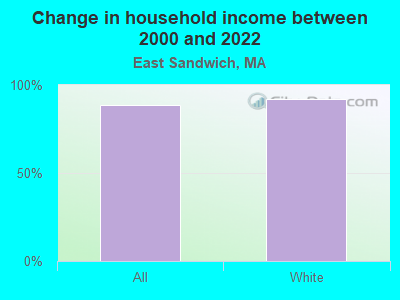
Change in median household income between 2000 and 2022:
East Sandwich, Massachusetts:
+88.4%
State:
+87.1%
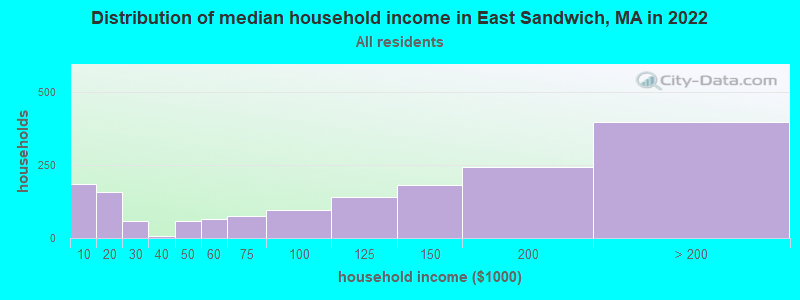
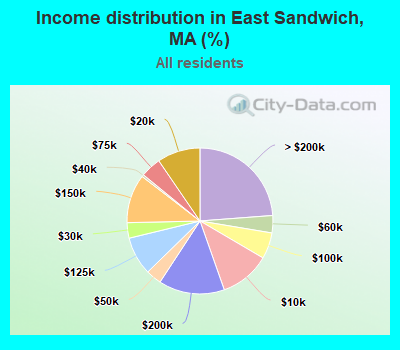
Number of households with income < $10k:
East Sandwich:
11.2% (186)
State:
5.2% (146,170)
Number of households with income $10k - 20k:
East Sandwich:
9.5% (159)
State:
6.4% (180,001)
Number of households with income $20k - 30k:
East Sandwich:
3.4% (57)
State:
5.6% (156,667)
Number of households with income $30k - 40k:
East Sandwich:
0.5% (8)
State:
5.6% (157,168)
Number of households with income $40k - 50k:
East Sandwich:
3.5% (58)
Massachusetts:
5.4% (151,455)
Number of households with income $50k - 60k:
East Sandwich:
3.8% (64)
State:
5.1% (142,726)
Number of households with income $60k - 75k:
East Sandwich:
4.6% (76)
State:
7.6% (212,203)
Number of households with income $75k - 100k:
East Sandwich:
5.8% (97)
State:
11.3% (317,064)
Number of households with income $100k - 125k:
East Sandwich:
8.5% (142)
State:
9.7% (270,603)
Number of households with income $125k - 150k:
East Sandwich:
10.8% (180)
State:
8.0% (223,140)
Number of households with income $150k - 200k:
East Sandwich:
14.6% (244)
State:
11.0% (308,695)
Number of households with income > $200k:
East Sandwich:
23.8% (397)
State:
19.0% (531,884)
Aggregate household income in East Sandwich in 2022: $217,718,019
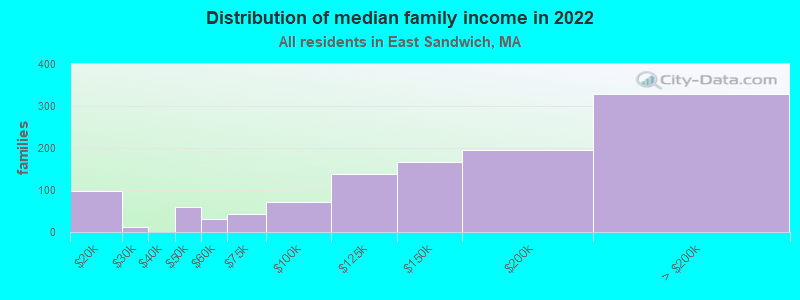
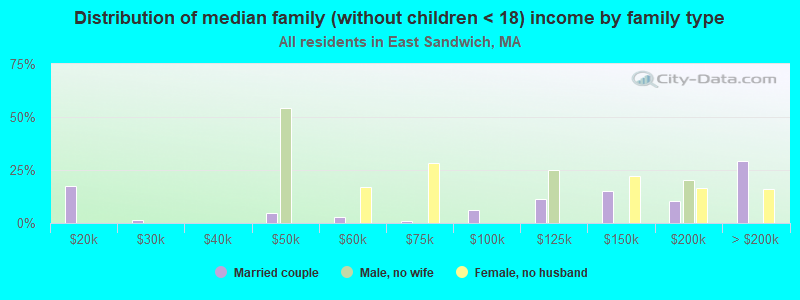
Median family income in East Sandwich in 2022:
East Sandwich:
$141,721
State:
$120,263
Number of families with income $10k - 20k:
East Sandwich:
8.4% (97)
State:
2.9% (50,542)
Number of families with income $20k - 30k:
East Sandwich:
1.1% (13)
State:
3.9% (66,398)
Number of families with income $40k - 50k:
East Sandwich:
5.3% (60)
State:
4.5% (77,656)
Number of families with income $50k - 60k:
East Sandwich:
2.8% (32)
State:
4.5% (77,928)
Number of families with income $60k - 75k:
East Sandwich:
3.8% (44)
Massachusetts:
7.0% (120,295)
Number of families with income $75k - 100k:
East Sandwich:
6.2% (71)
Massachusetts:
11.1% (192,172)
Number of families with income $100k - 125k:
East Sandwich:
12.1% (138)
State:
10.6% (182,105)
Number of families with income $125k - 150k:
East Sandwich:
14.5% (166)
Massachusetts:
9.3% (159,566)
Number of families with income $150k - 200k:
East Sandwich:
17.1% (196)
State:
13.4% (231,410)
Number of families with income > $200k:
East Sandwich:
28.7% (328)
Massachusetts:
25.4% (438,378)
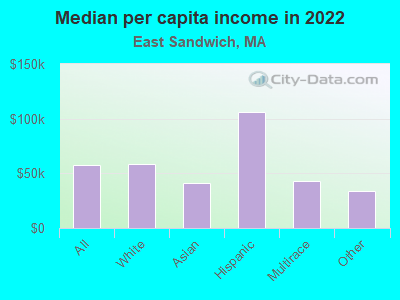
Median per capita income in East Sandwich in 2022:
East Sandwich:
$57,220
State:
$54,025
Change in median per capita income between 2000 and 2022:
East Sandwich, Massachusetts:
+75.1%
State:
+108.2%
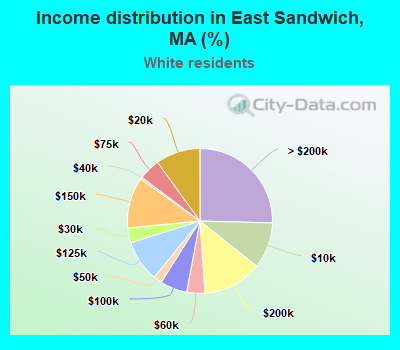
Income statistics for White residents
Median household income in East Sandwich, MA in 2022:
East Sandwich:
$127,536
State:
$101,391
Change in median household income between 2000 and 2022:
East Sandwich, Massachusetts:
+92.0%
State:
+93.3%
Number of households with income < $10k:
East Sandwich:
10.3% (161)
State:
4.4% (91,120)
Number of households with income $10k - 20k:
East Sandwich:
10.0% (156)
State:
5.9% (122,055)
Number of households with income $20k - 30k:
East Sandwich:
3.3% (52)
Massachusetts:
5.1% (105,311)
Number of households with income $30k - 40k:
East Sandwich:
0.5% (8)
Massachusetts:
5.3% (110,239)
Number of households with income $40k - 50k:
East Sandwich:
1.9% (30)
State:
5.0% (104,636)
Number of households with income $50k - 60k:
East Sandwich:
4.1% (64)
State:
4.8% (99,486)
Number of households with income $60k - 75k:
East Sandwich:
4.7% (74)
State:
7.5% (155,124)
Number of households with income $75k - 100k:
East Sandwich:
6.0% (94)
State:
11.4% (236,252)
Number of households with income $100k - 125k:
East Sandwich:
9.3% (145)
State:
9.9% (204,731)
Number of households with income $125k - 150k:
East Sandwich:
11.3% (177)
Massachusetts:
8.5% (175,324)
Number of households with income $150k - 200k:
East Sandwich:
13.2% (206)
State:
11.7% (242,980)
Number of households with income > $200k:
East Sandwich:
25.4% (398)
State:
20.5% (425,966)
Aggregate household income in East Sandwich in 2022: $209,447,715
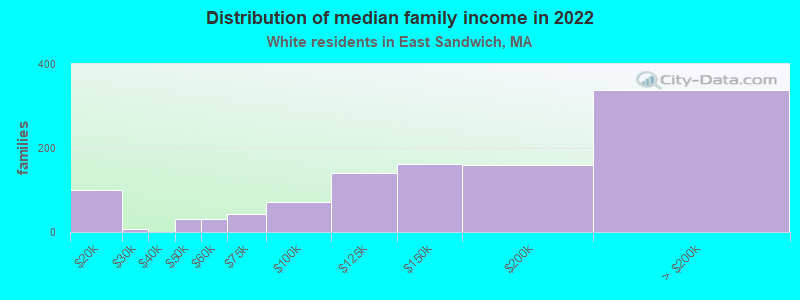
Median family income in East Sandwich in 2022:
East Sandwich:
$144,217
State:
$133,153
Number of families with income $10k - 20k:
East Sandwich:
9.3% (100)
State:
2.1% (26,403)
Number of families with income $20k - 30k:
East Sandwich:
0.7% (8)
State:
2.6% (32,525)
Number of families with income $40k - 50k:
East Sandwich:
2.7% (30)
Massachusetts:
3.8% (46,908)
Number of families with income $50k - 60k:
East Sandwich:
2.8% (30)
Massachusetts:
3.8% (46,476)
Number of families with income $60k - 75k:
East Sandwich:
3.9% (42)
Massachusetts:
6.4% (79,040)
Number of families with income $75k - 100k:
East Sandwich:
6.7% (72)
Massachusetts:
11.1% (137,395)
Number of families with income $100k - 125k:
East Sandwich:
13.0% (141)
State:
11.1% (136,771)
Number of families with income $125k - 150k:
East Sandwich:
15.0% (163)
Massachusetts:
10.0% (123,709)
Number of families with income $150k - 200k:
East Sandwich:
14.8% (160)
State:
14.7% (181,602)
Number of families with income > $200k:
East Sandwich:
31.1% (337)
Massachusetts:
28.5% (351,887)
Median per capita income in East Sandwich in 2022:
East Sandwich:
$58,178
State:
$60,804
Change in median per capita income between 2000 and 2022:
East Sandwich, Massachusetts:
+78.1%
State:
+118.7%
Income statistics for Asian residents
Number of households with income < $10k:
East Sandwich:
0.0% (0)
Massachusetts:
6.8% (11,982)
Number of households with income $10k - 20k:
East Sandwich:
0.0% (0)
State:
4.8% (8,376)
Number of households with income $20k - 30k:
East Sandwich:
0.0% (0)
State:
3.7% (6,558)
Number of households with income $30k - 40k:
East Sandwich:
0.0% (0)
State:
3.3% (5,748)
Number of households with income $40k - 50k:
East Sandwich:
0.0% (0)
Massachusetts:
4.1% (7,192)
Number of households with income $50k - 60k:
East Sandwich:
0.0% (0)
State:
5.0% (8,734)
Number of households with income $60k - 75k:
East Sandwich:
0.0% (0)
Massachusetts:
5.8% (10,203)
Number of households with income $75k - 100k:
East Sandwich:
0.0% (0)
Massachusetts:
8.6% (15,154)
Number of households with income $100k - 125k:
East Sandwich:
0.0% (0)
Massachusetts:
10.8% (18,942)
Number of households with income $125k - 150k:
East Sandwich:
0.0% (0)
State:
8.0% (14,037)
Number of households with income $150k - 200k:
East Sandwich:
100.0% (19)
Massachusetts:
12.5% (21,856)
Number of households with income > $200k:
East Sandwich:
0.0% (0)
Massachusetts:
26.6% (46,694)
Aggregate household income in East Sandwich in 2022: $1,375,615
Median per capita income in East Sandwich in 2022:
East Sandwich:
$41,194
State:
$58,900
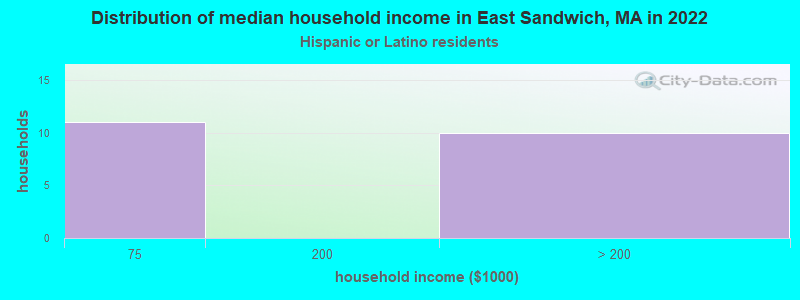
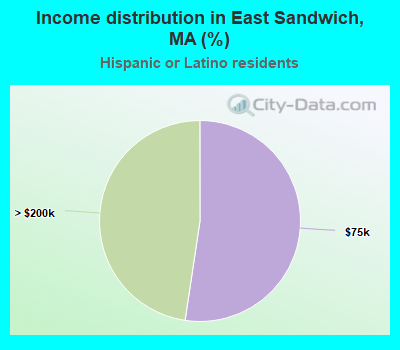
Income statistics for Hispanic or Latino residents
Number of households with income < $10k:
East Sandwich:
0.0% (0)
Massachusetts:
8.8% (25,307)
Number of households with income $10k - 20k:
East Sandwich:
0.0% (0)
State:
10.0% (28,653)
Number of households with income $20k - 30k:
East Sandwich:
0.0% (0)
State:
8.8% (25,189)
Number of households with income $30k - 40k:
East Sandwich:
0.0% (0)
State:
7.2% (20,822)
Number of households with income $40k - 50k:
East Sandwich:
0.0% (0)
State:
7.2% (20,817)
Number of households with income $50k - 60k:
East Sandwich:
0.0% (0)
Massachusetts:
6.5% (18,748)
Number of households with income $60k - 75k:
East Sandwich:
52.4% (11)
Massachusetts:
8.8% (25,390)
Number of households with income $75k - 100k:
East Sandwich:
0.0% (0)
State:
12.0% (34,488)
Number of households with income $100k - 125k:
East Sandwich:
0.0% (0)
State:
8.6% (24,599)
Number of households with income $125k - 150k:
East Sandwich:
0.0% (0)
Massachusetts:
6.2% (17,743)
Number of households with income $150k - 200k:
East Sandwich:
0.0% (0)
Massachusetts:
7.3% (21,017)
Number of households with income > $200k:
East Sandwich:
47.6% (10)
State:
8.6% (24,606)
Aggregate household income in East Sandwich in 2022: $22,226,813
Median per capita income in East Sandwich in 2022:
East Sandwich:
$106,329
State:
$28,993
Income statistics for Multirace residents
Number of households with income < $10k:
East Sandwich:
0.0% (0)
State:
6.6% (15,127)
Number of households with income $10k - 20k:
East Sandwich:
0.0% (0)
State:
9.2% (21,158)
Number of households with income $20k - 30k:
East Sandwich:
0.0% (0)
Massachusetts:
7.8% (18,016)
Number of households with income $30k - 40k:
East Sandwich:
0.0% (0)
State:
7.9% (18,260)
Number of households with income $40k - 50k:
East Sandwich:
100.0% (24)
State:
5.6% (13,027)
Number of households with income $50k - 60k:
East Sandwich:
0.0% (0)
Massachusetts:
5.6% (12,909)
Number of households with income $60k - 75k:
East Sandwich:
0.0% (0)
State:
9.0% (20,800)
Number of households with income $75k - 100k:
East Sandwich:
0.0% (0)
State:
12.1% (27,875)
Number of households with income $100k - 125k:
East Sandwich:
0.0% (0)
Massachusetts:
8.1% (18,754)
Number of households with income $125k - 150k:
East Sandwich:
0.0% (0)
State:
6.8% (15,621)
Number of households with income $150k - 200k:
East Sandwich:
0.0% (0)
State:
9.4% (21,618)
Number of households with income > $200k:
East Sandwich:
0.0% (0)
State:
12.0% (27,592)
Aggregate household income in East Sandwich in 2022: $24,085,357
Median per capita income in East Sandwich in 2022:
East Sandwich:
$42,630
State:
$34,029
Change in median per capita income between 2000 and 2022:
East Sandwich, Massachusetts:
+1.5%
State:
+132.1%
Income statistics for other residents
Aggregate household income in East Sandwich in 2022: $1,598,735
Median per capita income in East Sandwich in 2022:
East Sandwich:
$33,393
Massachusetts:
$30,797
Change in median per capita income between 2000 and 2022:
East Sandwich, Massachusetts:
+28.4%
State:
+188.5%
Discuss East Sandwich, Massachusetts (MA) on our hugely popular Massachusetts forum.