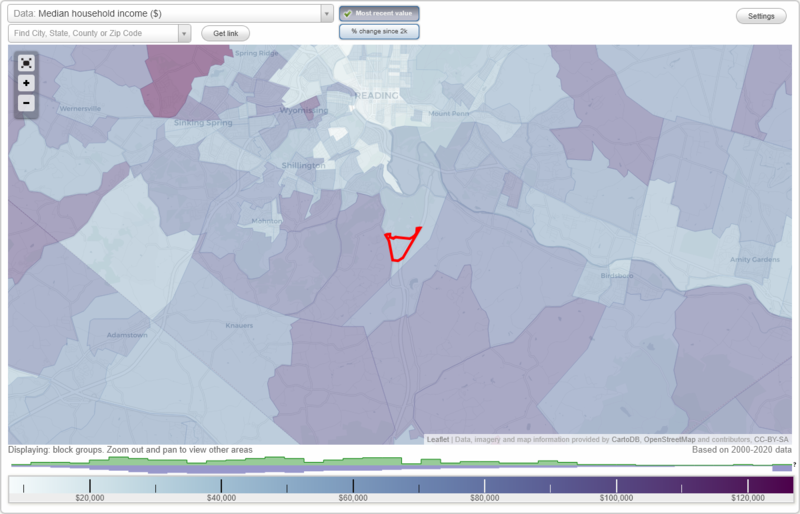
The median household income in Flying Hills, PA in 2022 was $84,596, which was 15.1% greater than the median annual income of $71,798 across the entire state of Pennsylvania. Compared to the median income of $59,596 in 2000 this represents an increase of 29.6%. The per capita income in 2022 was $61,153, which means an increase of 39.8% compared to 2000 when it was $36,822.
Whole page based on the data from 2000 / 2022 when the population of Flying Hills, Pennsylvania was 1,191 / 1,724
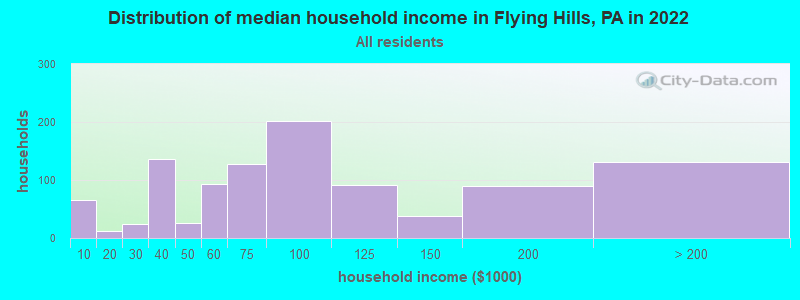
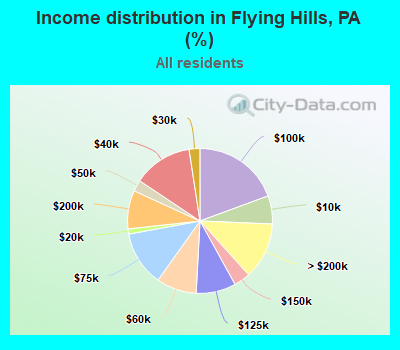
Income statistics for all residents
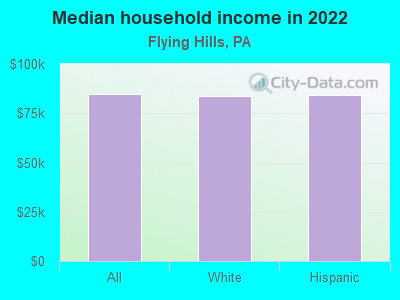
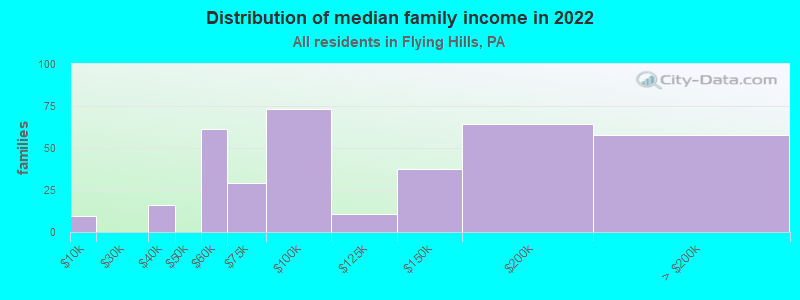
Median household income in Flying Hills, PA in 2022:
Flying Hills:
$84,596
Pennsylvania:
$71,798
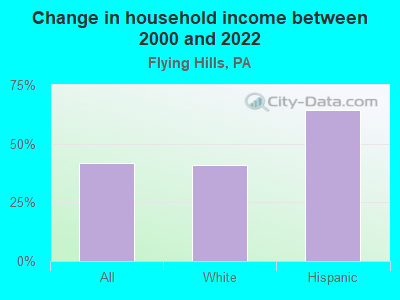
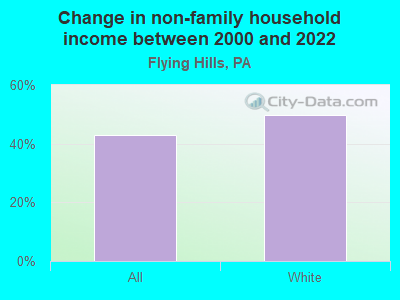
Change in median household income between 2000 and 2022:
Flying Hills, Pennsylvania:
+41.9%
State:
+79.0%
Number of households with income < $10k:
Flying Hills:
6.3% (65)
Pennsylvania:
5.5% (291,562)
Number of households with income $10k - 20k:
Flying Hills:
1.2% (12)
Pennsylvania:
7.3% (384,726)
Number of households with income $20k - 30k:
Flying Hills:
2.4% (25)
State:
7.4% (389,464)
Number of households with income $30k - 40k:
Flying Hills:
13.2% (137)
State:
7.6% (402,138)
Number of households with income $40k - 50k:
Flying Hills:
2.5% (26)
State:
7.3% (387,945)
Number of households with income $50k - 60k:
Flying Hills:
9.0% (93)
State:
7.0% (372,468)
Number of households with income $60k - 75k:
Flying Hills:
12.3% (127)
Pennsylvania:
9.9% (524,786)
Number of households with income $75k - 100k:
Flying Hills:
19.4% (201)
State:
12.6% (666,253)
Number of households with income $100k - 125k:
Flying Hills:
8.9% (92)
State:
9.9% (526,402)
Number of households with income $125k - 150k:
Flying Hills:
3.7% (38)
Pennsylvania:
6.9% (362,702)
Number of households with income $150k - 200k:
Flying Hills:
8.6% (89)
State:
8.3% (440,827)
Number of households with income > $200k:
Flying Hills:
12.6% (131)
Pennsylvania:
10.3% (544,792)
Aggregate household income in Flying Hills in 2022: $105,389,153
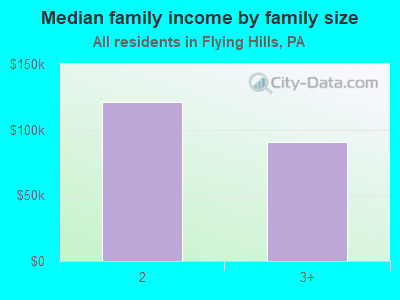
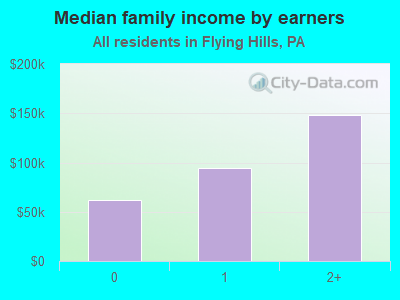
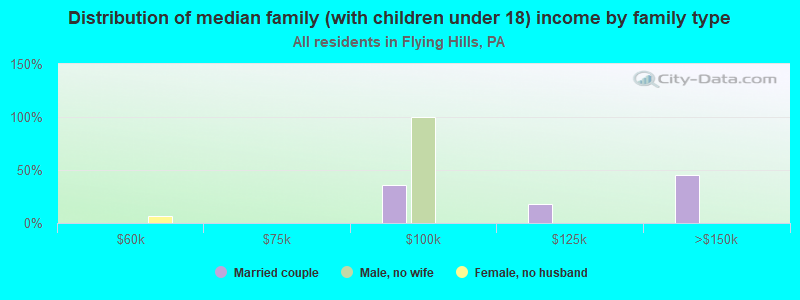
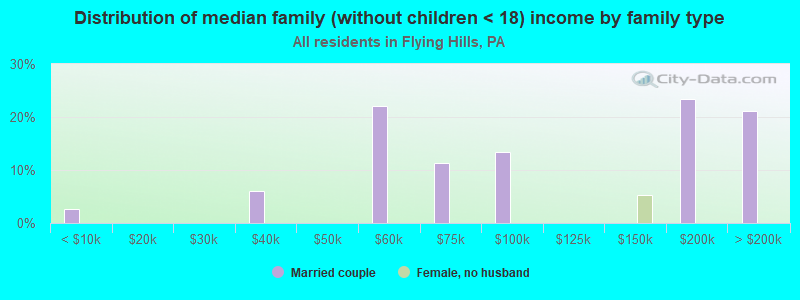
Median family income in Flying Hills in 2022:
Flying Hills:
$94,257
Pennsylvania:
$93,029
Number of families with income < $10k:
Flying Hills:
2.6% (9)
State:
3.1% (101,868)
Number of families with income $30k - 40k:
Flying Hills:
4.4% (16)
State:
5.8% (191,305)
Number of families with income $50k - 60k:
Flying Hills:
17.1% (61)
State:
6.4% (209,910)
Number of families with income $60k - 75k:
Flying Hills:
8.1% (29)
State:
9.7% (318,991)
Number of families with income $75k - 100k:
Flying Hills:
20.4% (73)
State:
14.0% (461,021)
Number of families with income $100k - 125k:
Flying Hills:
2.9% (11)
State:
12.2% (400,961)
Number of families with income $125k - 150k:
Flying Hills:
10.4% (37)
State:
8.8% (288,471)
Number of families with income $150k - 200k:
Flying Hills:
17.9% (64)
Pennsylvania:
11.2% (367,642)
Number of families with income > $200k:
Flying Hills:
16.1% (58)
Pennsylvania:
14.3% (470,863)
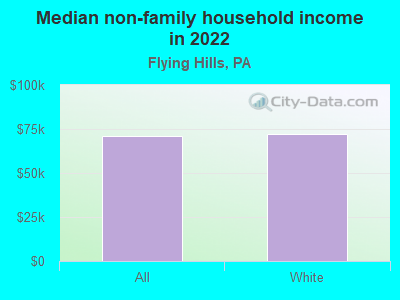
Median non-family income in Flying Hills in 2022:
Flying Hills:
$71,070
Pennsylvania:
$42,203
Change in median non-family income between 2000 and 2022:
Flying Hills, Pennsylvania:
+42.9%
Pennsylvania:
+90.1%
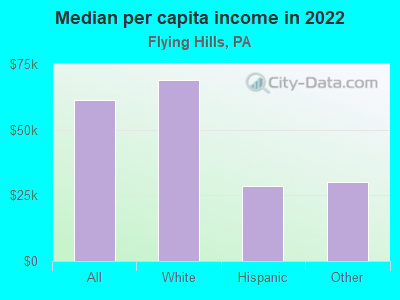
Median per capita income in Flying Hills in 2022:
Flying Hills:
$61,153
State:
$41,489
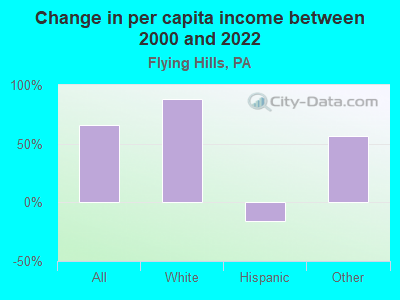
Change in median per capita income between 2000 and 2022:
Flying Hills, Pennsylvania:
+66.1%
Pennsylvania:
+98.7%
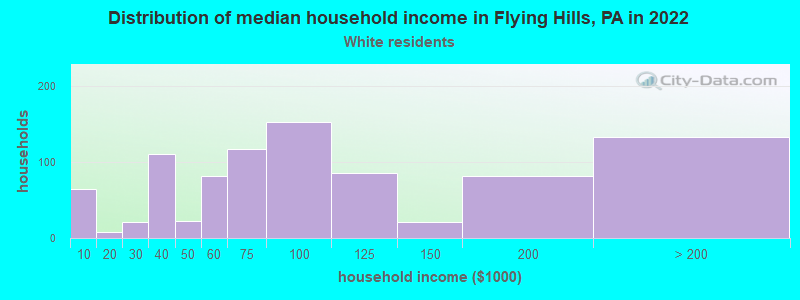
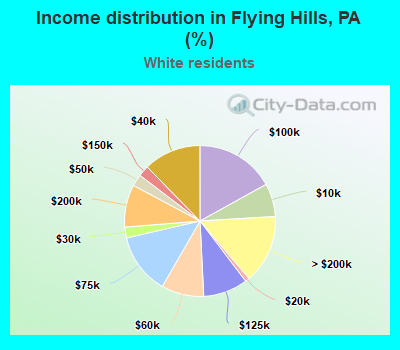
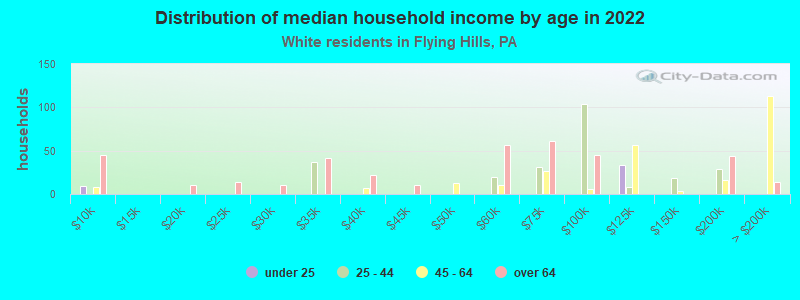
Income statistics for White residents
Median household income in Flying Hills, PA in 2022:
Flying Hills:
$83,969
Pennsylvania:
$76,765
Change in median household income between 2000 and 2022:
Flying Hills, Pennsylvania:
+41.1%
Pennsylvania:
+84.3%
Number of households with income < $10k:
Flying Hills:
7.1% (64)
State:
4.3% (179,792)
Number of households with income $10k - 20k:
Flying Hills:
0.9% (8)
State:
6.5% (268,738)
Number of households with income $20k - 30k:
Flying Hills:
2.3% (21)
State:
7.0% (288,138)
Number of households with income $30k - 40k:
Flying Hills:
12.3% (111)
Pennsylvania:
7.2% (300,208)
Number of households with income $40k - 50k:
Flying Hills:
2.5% (23)
State:
7.2% (298,756)
Number of households with income $50k - 60k:
Flying Hills:
9.1% (82)
Pennsylvania:
6.8% (283,251)
Number of households with income $60k - 75k:
Flying Hills:
13.1% (118)
State:
9.9% (408,159)
Number of households with income $75k - 100k:
Flying Hills:
17.0% (153)
State:
13.2% (547,809)
Number of households with income $100k - 125k:
Flying Hills:
9.5% (86)
State:
10.5% (436,652)
Number of households with income $125k - 150k:
Flying Hills:
2.3% (21)
State:
7.3% (304,132)
Number of households with income $150k - 200k:
Flying Hills:
9.1% (82)
Pennsylvania:
9.0% (374,658)
Number of households with income > $200k:
Flying Hills:
14.7% (133)
State:
10.9% (452,618)
Aggregate household income in Flying Hills in 2022: $94,295,543
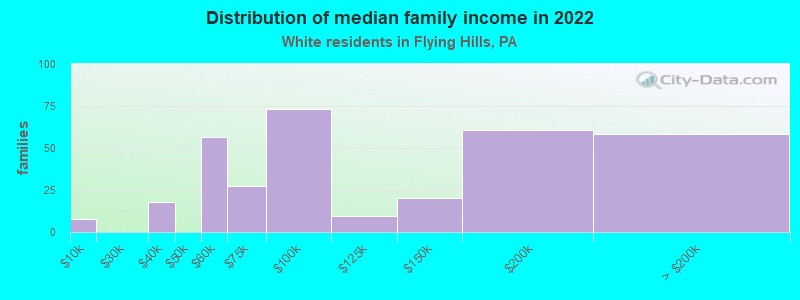
Median family income in Flying Hills in 2022:
Flying Hills:
$96,232
State:
$99,396
Number of families with income < $10k:
Flying Hills:
2.3% (8)
State:
2.2% (56,136)
Number of families with income $30k - 40k:
Flying Hills:
5.4% (18)
State:
5.2% (134,367)
Number of families with income $50k - 60k:
Flying Hills:
17.0% (56)
State:
6.1% (157,983)
Number of families with income $60k - 75k:
Flying Hills:
8.3% (28)
State:
9.6% (249,292)
Number of families with income $75k - 100k:
Flying Hills:
22.2% (73)
State:
14.7% (379,316)
Number of families with income $100k - 125k:
Flying Hills:
3.0% (10)
Pennsylvania:
12.9% (333,626)
Number of families with income $125k - 150k:
Flying Hills:
6.0% (20)
Pennsylvania:
9.4% (243,915)
Number of families with income $150k - 200k:
Flying Hills:
18.3% (61)
State:
12.2% (314,926)
Number of families with income > $200k:
Flying Hills:
17.5% (58)
Pennsylvania:
15.1% (390,885)
Median non-family income in Flying Hills in 2022:
Flying Hills:
$72,319
State:
$44,251
Change in median non-family income between 2000 and 2022:
Flying Hills, Pennsylvania:
+49.6%
State:
+94.2%
Median per capita income in Flying Hills in 2022:
Flying Hills:
$68,748
State:
$45,306
Change in median per capita income between 2000 and 2022:
Flying Hills, Pennsylvania:
+88.0%
State:
+105.4%
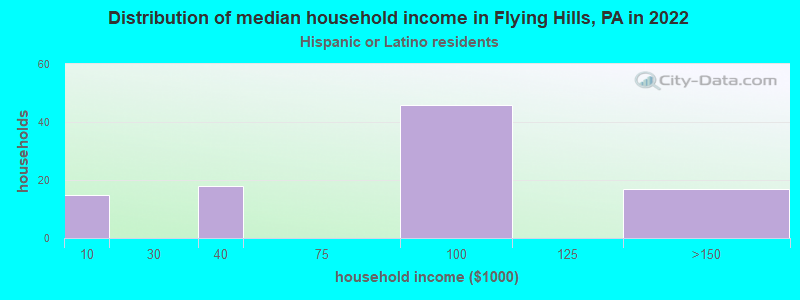
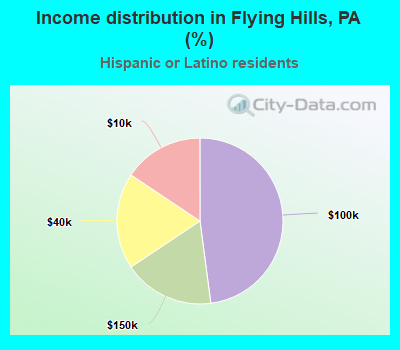
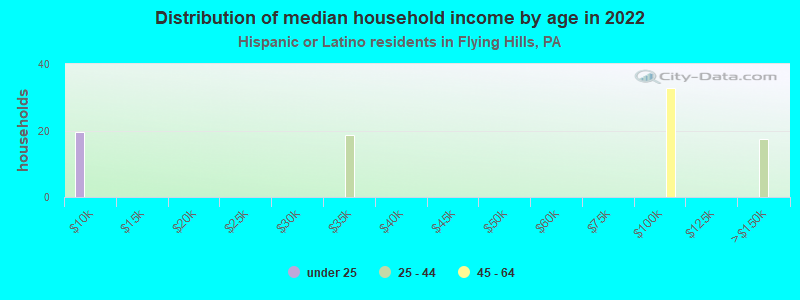
Income statistics for Hispanic or Latino residents
Median household income in Flying Hills, PA in 2022:
Flying Hills:
$84,201
State:
$55,478
Change in median household income between 2000 and 2022:
Flying Hills, Pennsylvania:
+64.3%
State:
+106.0%
Number of households with income < $10k:
Flying Hills:
15.6% (15)
State:
8.7% (29,517)
Number of households with income $10k - 20k:
Flying Hills:
0.0% (0)
Pennsylvania:
10.0% (33,785)
Number of households with income $20k - 30k:
Flying Hills:
0.0% (0)
State:
9.9% (33,399)
Number of households with income $30k - 40k:
Flying Hills:
18.8% (18)
Pennsylvania:
8.8% (29,878)
Number of households with income $40k - 50k:
Flying Hills:
0.0% (0)
State:
8.5% (28,549)
Number of households with income $50k - 60k:
Flying Hills:
0.0% (0)
State:
7.6% (25,792)
Number of households with income $60k - 75k:
Flying Hills:
0.0% (0)
Pennsylvania:
10.6% (35,808)
Number of households with income $75k - 100k:
Flying Hills:
47.9% (46)
State:
11.9% (40,287)
Number of households with income $100k - 125k:
Flying Hills:
0.0% (0)
Pennsylvania:
8.0% (27,028)
Number of households with income $125k - 150k:
Flying Hills:
17.7% (17)
Pennsylvania:
5.2% (17,622)
Number of households with income $150k - 200k:
Flying Hills:
0.0% (0)
State:
5.2% (17,563)
Number of households with income > $200k:
Flying Hills:
0.0% (0)
State:
5.5% (18,469)
Aggregate household income in Flying Hills in 2022: $7,986,576
Median per capita income in Flying Hills in 2022:
Flying Hills:
$28,492
State:
$23,829
Change in median per capita income between 2000 and 2022:: -16.1%
Flying Hills, Pennsylvania:
-16.1%
State:
+116.4%
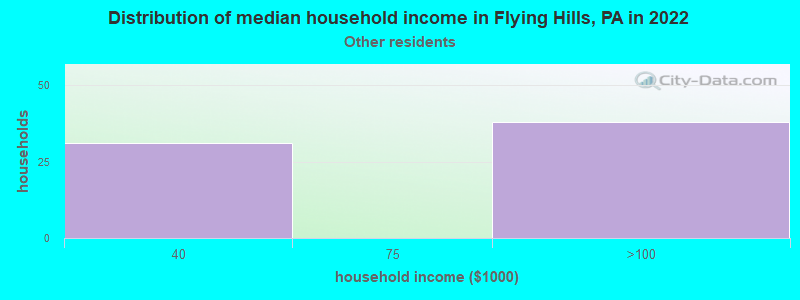
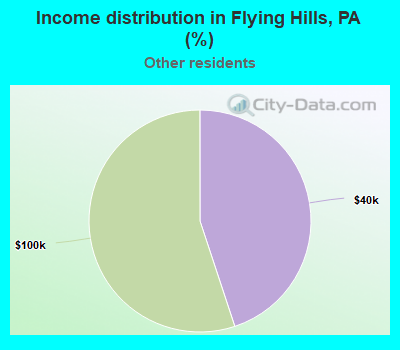
Income statistics for other residents
Number of households with income < $10k:
Flying Hills:
0.0% (0)
Pennsylvania:
9.2% (14,206)
Number of households with income $10k - 20k:
Flying Hills:
0.0% (0)
Pennsylvania:
11.0% (17,038)
Number of households with income $20k - 30k:
Flying Hills:
0.0% (0)
State:
11.0% (17,000)
Number of households with income $30k - 40k:
Flying Hills:
44.9% (31)
State:
11.0% (17,022)
Number of households with income $40k - 50k:
Flying Hills:
0.0% (0)
State:
7.7% (11,829)
Number of households with income $50k - 60k:
Flying Hills:
0.0% (0)
State:
8.0% (12,320)
Number of households with income $60k - 75k:
Flying Hills:
0.0% (0)
State:
8.8% (13,590)
Number of households with income $75k - 100k:
Flying Hills:
55.1% (38)
State:
10.5% (16,166)
Number of households with income $100k - 125k:
Flying Hills:
0.0% (0)
State:
8.0% (12,371)
Number of households with income $125k - 150k:
Flying Hills:
0.0% (0)
State:
4.0% (6,190)
Number of households with income $150k - 200k:
Flying Hills:
0.0% (0)
State:
5.1% (7,862)
Number of households with income > $200k:
Flying Hills:
0.0% (0)
State:
5.6% (8,691)
Aggregate household income in Flying Hills in 2022: $2,519,291
Median per capita income in Flying Hills in 2022:
Flying Hills:
$29,965
State:
$24,779
Change in median per capita income between 2000 and 2022:
Flying Hills, Pennsylvania:
+56.7%
Pennsylvania:
+157.6%
Discuss Flying Hills, Pennsylvania (PA) on our hugely popular Pennsylvania forum.