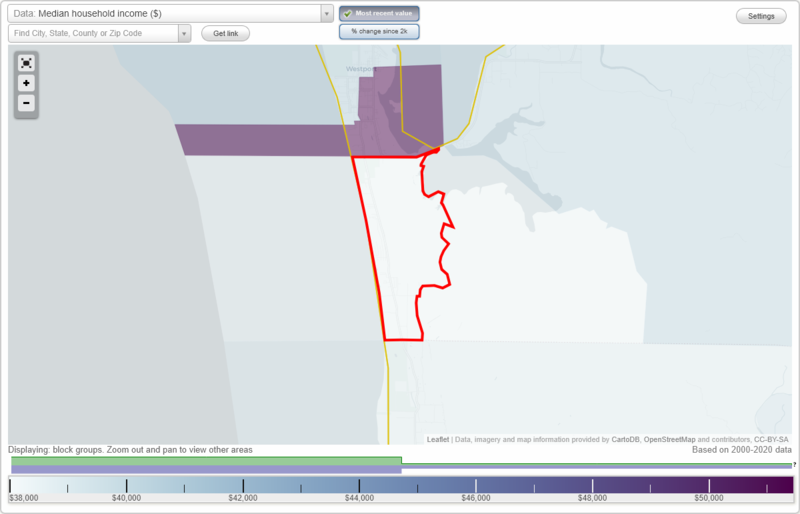
The median household income in Grayland, WA in 2022 was $37,288, which was 144.9% less than the median annual income of $91,306 across the entire state of Washington. Compared to the median income of $25,776 in 2000 this represents an increase of 30.9%. The per capita income in 2022 was $52,397, which means an increase of 58.5% compared to 2000 when it was $21,723.
Whole page based on the data from 2000 / 2022 when the population of Grayland, Washington was 1,002 / 585
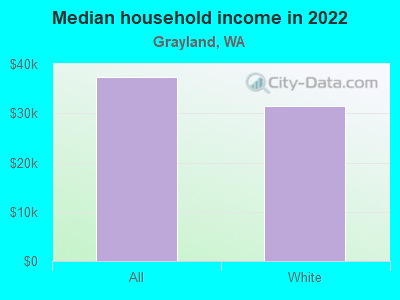
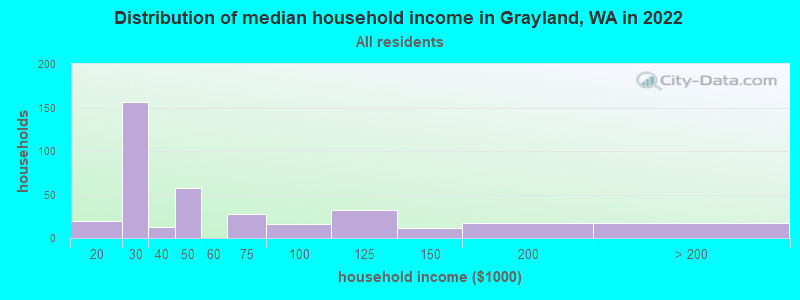
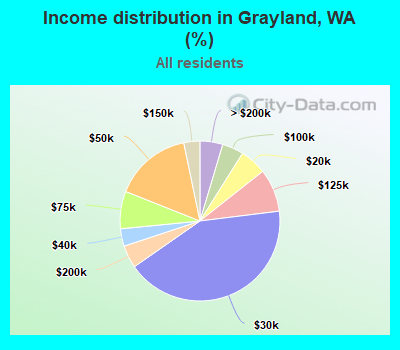
Income statistics for all residents
Median household income in Grayland, WA in 2022:
Grayland:
$37,288
Washington:
$91,306
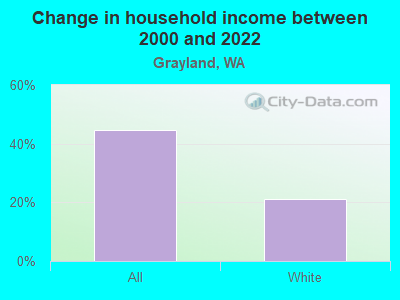
Change in median household income between 2000 and 2022:
Grayland, Washington:
+44.7%
State:
+99.5%
Number of households with income < $10k:
Grayland:
0.0% (0)
State:
4.5% (139,331)
Number of households with income $10k - 20k:
Grayland:
5.4% (20)
State:
5.0% (154,508)
Number of households with income $20k - 30k:
Grayland:
42.3% (156)
State:
5.4% (166,555)
Number of households with income $30k - 40k:
Grayland:
3.5% (13)
State:
5.5% (170,324)
Number of households with income $40k - 50k:
Grayland:
15.7% (58)
State:
6.0% (183,941)
Number of households with income $50k - 60k:
Grayland:
0.0% (0)
Washington:
6.1% (187,395)
Number of households with income $60k - 75k:
Grayland:
7.6% (28)
State:
8.7% (266,771)
Number of households with income $75k - 100k:
Grayland:
4.3% (16)
Washington:
13.1% (404,672)
Number of households with income $100k - 125k:
Grayland:
8.7% (32)
State:
11.0% (337,911)
Number of households with income $125k - 150k:
Grayland:
3.3% (12)
State:
8.0% (244,934)
Number of households with income $150k - 200k:
Grayland:
4.6% (17)
State:
10.5% (323,812)
Number of households with income > $200k:
Grayland:
4.6% (17)
State:
16.2% (499,799)
Aggregate household income in Grayland in 2022: $32,300,060
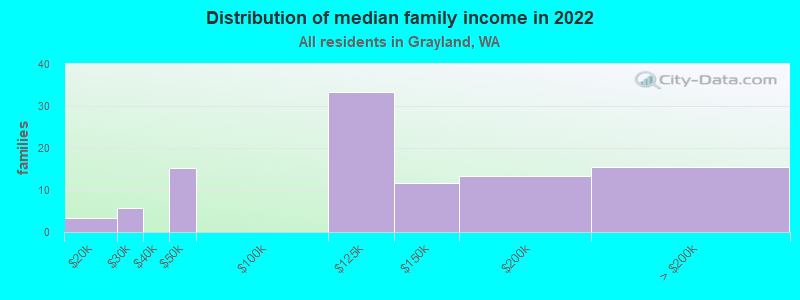
Median family income in Grayland in 2022:
Grayland:
$100,889
State:
$109,192
Number of families with income $10k - 20k:
Grayland:
3.3% (3)
Washington:
2.6% (50,138)
Number of families with income $20k - 30k:
Grayland:
5.9% (6)
Washington:
3.2% (61,974)
Number of families with income $40k - 50k:
Grayland:
15.5% (15)
State:
4.9% (94,310)
Number of families with income $100k - 125k:
Grayland:
33.9% (33)
Washington:
12.4% (240,213)
Number of families with income $125k - 150k:
Grayland:
11.9% (12)
Washington:
9.3% (180,011)
Number of families with income $150k - 200k:
Grayland:
13.7% (13)
Washington:
13.0% (250,874)
Number of families with income > $200k:
Grayland:
15.8% (16)
State:
20.4% (393,898)
Median income for families with 0 earners:
Grayland:
$0
Washington:
$60,470
Median income for families with 1 earner:
Grayland:
$55,210
State:
$83,136
Median income for families with 2 earners:
Grayland:
$0
State:
$135,539
Median income for families with 3+ earners:
Grayland:
$0
Washington:
$163,538
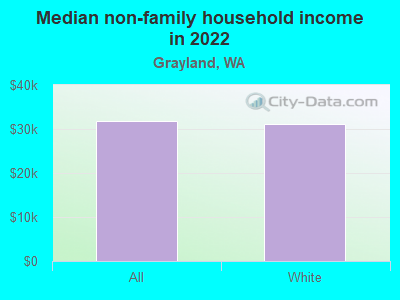
Median non-family income in Grayland in 2022:
Grayland:
$31,768
Washington:
$57,299
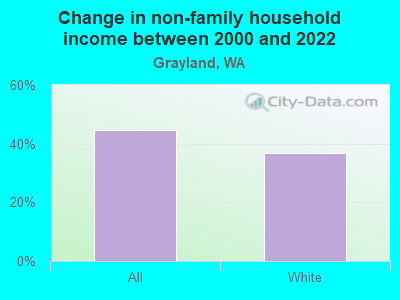
Change in median non-family income between 2000 and 2022:
Grayland, Washington:
+44.5%
State:
+94.9%
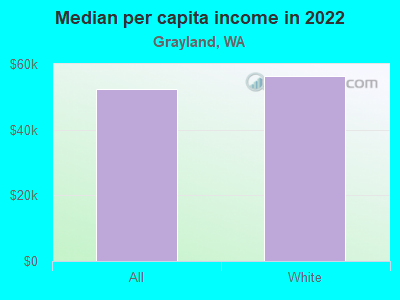
Median per capita income in Grayland in 2022:
Grayland:
$52,398
Washington:
$50,764
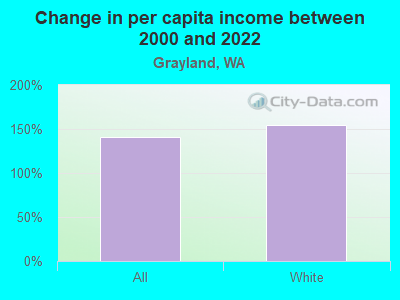
Change in median per capita income between 2000 and 2022:
Grayland, Washington:
+141.2%
State:
+121.0%
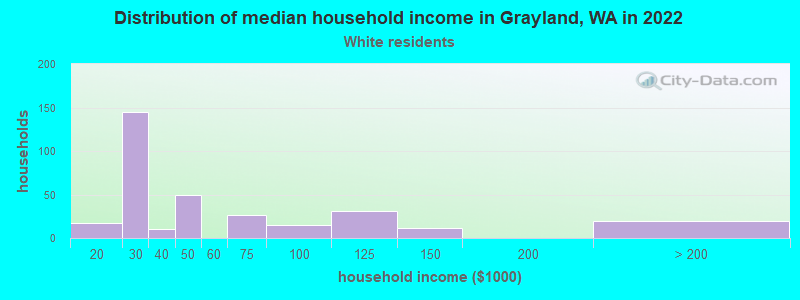
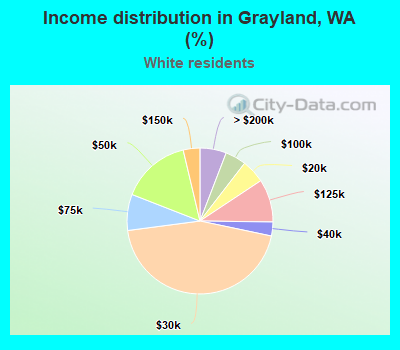
Income statistics for White residents
Median household income in Grayland, WA in 2022:
Grayland:
$31,375
State:
$91,916
Change in median household income between 2000 and 2022:
Grayland, Washington:
+21.1%
State:
+95.4%
Number of households with income < $10k:
Grayland:
0.0% (0)
State:
4.3% (95,850)
Number of households with income $10k - 20k:
Grayland:
5.2% (17)
State:
4.8% (106,421)
Number of households with income $20k - 30k:
Grayland:
44.6% (145)
State:
5.5% (122,860)
Number of households with income $30k - 40k:
Grayland:
3.1% (10)
Washington:
5.4% (119,627)
Number of households with income $40k - 50k:
Grayland:
15.4% (50)
State:
5.9% (132,276)
Number of households with income $50k - 60k:
Grayland:
0.0% (0)
Washington:
6.1% (136,212)
Number of households with income $60k - 75k:
Grayland:
8.0% (26)
Washington:
8.8% (196,086)
Number of households with income $75k - 100k:
Grayland:
4.6% (15)
Washington:
13.4% (299,192)
Number of households with income $100k - 125k:
Grayland:
9.5% (31)
Washington:
11.3% (252,209)
Number of households with income $125k - 150k:
Grayland:
3.7% (12)
Washington:
7.9% (175,962)
Number of households with income $150k - 200k:
Grayland:
0.0% (0)
Washington:
10.7% (239,156)
Number of households with income > $200k:
Grayland:
5.8% (19)
State:
16.1% (359,917)
Aggregate household income in Grayland in 2022: $29,546,290
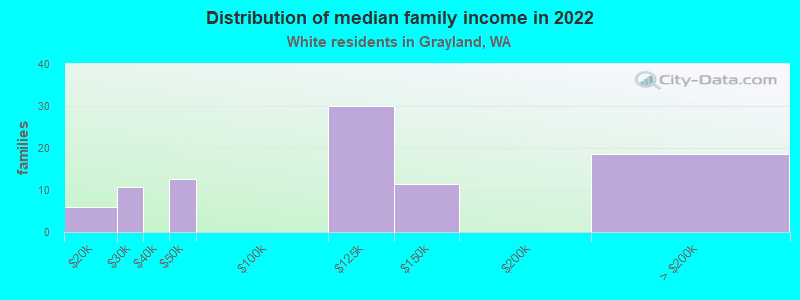
Median family income in Grayland in 2022:
Grayland:
$102,605
Washington:
$112,511
Number of families with income $10k - 20k:
Grayland:
6.7% (6)
State:
2.0% (28,228)
Number of families with income $20k - 30k:
Grayland:
12.0% (11)
State:
2.9% (39,288)
Number of families with income $40k - 50k:
Grayland:
14.2% (13)
State:
4.6% (63,009)
Number of families with income $100k - 125k:
Grayland:
33.6% (30)
Washington:
13.2% (182,184)
Number of families with income $125k - 150k:
Grayland:
12.8% (11)
Washington:
9.5% (130,928)
Number of families with income > $200k:
Grayland:
20.7% (19)
State:
20.8% (285,982)
Median non-family income in Grayland in 2022:
Grayland:
$31,108
State:
$56,103
Change in median non-family income between 2000 and 2022:
Grayland, Washington:
+36.8%
Washington:
+87.7%
Median per capita income in Grayland in 2022:
Grayland:
$56,385
Washington:
$55,212
Discuss Grayland, Washington (WA) on our hugely popular Washington forum.