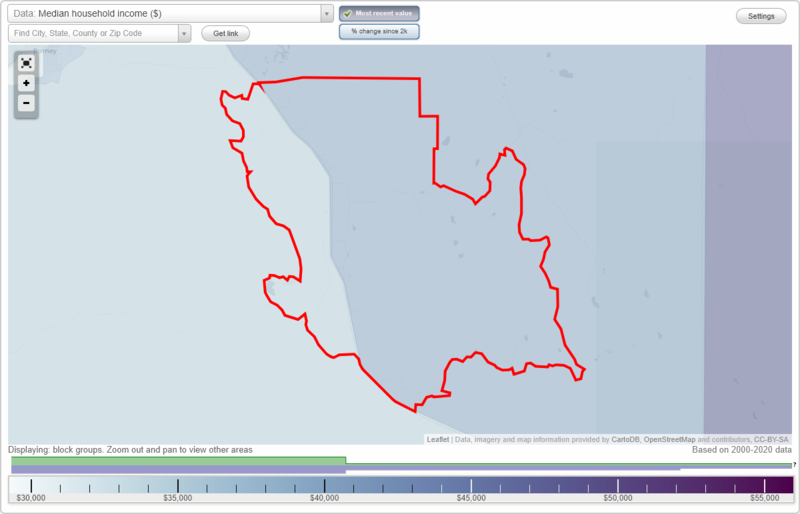
Hat Creek, California (CA) income map, earnings map, and wages data
Data:
The per capita income in 2022 was $38,716, which means an increase of 54.2% compared to 2000 when it was $17,738.
Whole page based on the data from 2000 / 2022 when the population of Hat Creek, California was 309 / 71
Income statistics for all residents
Number of households with income < $10k:| Hat Creek: | 0.0% (0) |
| California: | 4.8% (654,370) |
Number of households with income $10k - 20k:| Hat Creek: | 0.0% (0) |
| State: | 5.8% (789,493) |
Number of households with income $20k - 30k:| Hat Creek: | 0.0% (0) |
| State: | 5.7% (778,318) |
Number of households with income $30k - 40k:| Hat Creek: | 0.0% (0) |
| State: | 5.8% (783,170) |
Number of households with income $40k - 50k:| Hat Creek: | 0.0% (0) |
| State: | 5.8% (781,352) |
Number of households with income $50k - 60k:| Hat Creek: | 0.0% (0) |
| California: | 5.6% (760,175) |
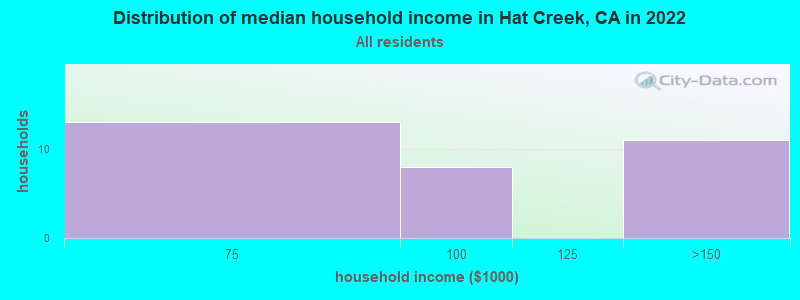
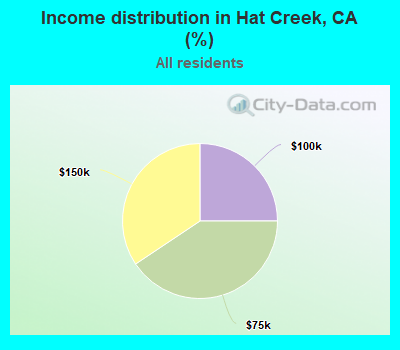
Number of households with income $60k - 75k:| Hat Creek: | 40.6% (13) |
| State: | 8.2% (1,104,699) |
Number of households with income $75k - 100k:| Hat Creek: | 25.0% (8) |
| California: | 12.0% (1,627,633) |
Number of households with income $100k - 125k:| Hat Creek: | 0.0% (0) |
| State: | 10.0% (1,358,619) |
Number of households with income $125k - 150k:| Hat Creek: | 34.4% (11) |
| California: | 7.6% (1,027,455) |
Number of households with income $150k - 200k:| Hat Creek: | 0.0% (0) |
| State: | 10.6% (1,439,811) |
Number of households with income > $200k:| Hat Creek: | 0.0% (0) |
| State: | 18.0% (2,445,491) |
Aggregate household income in Hat Creek in 2022: $2,656,869
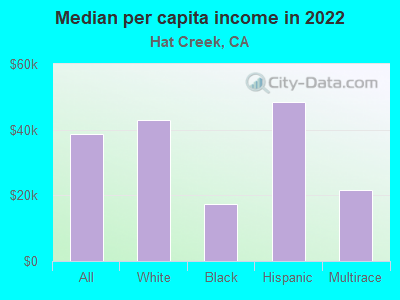
Median per capita income in Hat Creek in 2022:| Hat Creek: | $38,716 |
| State: | $46,661 |
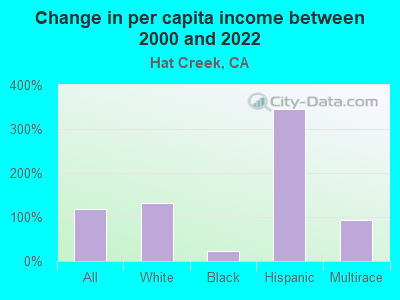
Change in median per capita income between 2000 and 2022:| Hat Creek, California: | +118.3% |
| State: | +105.5% |
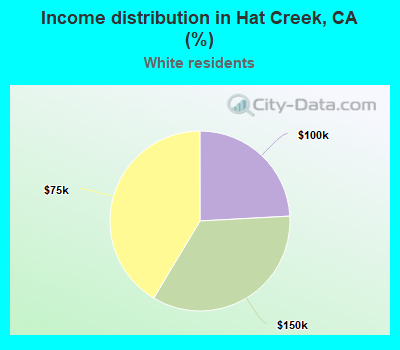
Income statistics for White residents
Number of households with income < $10k:| Hat Creek: | 0.0% (0) |
| State: | 4.4% (284,109) |
Number of households with income $10k - 20k:| Hat Creek: | 0.0% (0) |
| State: | 5.3% (340,330) |
Number of households with income $20k - 30k:| Hat Creek: | 0.0% (0) |
| State: | 5.3% (343,145) |
Number of households with income $30k - 40k:| Hat Creek: | 0.0% (0) |
| State: | 5.1% (330,146) |
Number of households with income $40k - 50k:| Hat Creek: | 0.0% (0) |
| California: | 5.2% (335,310) |
Number of households with income $50k - 60k:| Hat Creek: | 0.0% (0) |
| California: | 5.1% (326,299) |
Number of households with income $60k - 75k:| Hat Creek: | 41.4% (12) |
| State: | 7.6% (487,640) |
Number of households with income $75k - 100k:| Hat Creek: | 24.1% (7) |
| California: | 11.5% (736,578) |
Number of households with income $100k - 125k:| Hat Creek: | 0.0% (0) |
| State: | 10.1% (648,782) |
Number of households with income $125k - 150k:| Hat Creek: | 34.5% (10) |
| State: | 7.8% (499,671) |
Number of households with income $150k - 200k:| Hat Creek: | 0.0% (0) |
| State: | 11.4% (729,603) |
Number of households with income > $200k:| Hat Creek: | 0.0% (0) |
| State: | 21.2% (1,364,246) |
Aggregate household income in Hat Creek in 2022: $2,566,001
Median per capita income in Hat Creek in 2022:| Hat Creek: | $42,916 |
| California: | $61,706 |
Change in median per capita income between 2000 and 2022:| Hat Creek, California: | +132.5% |
| State: | +122.7% |
Income statistics for Black or African American residents
Median per capita income in Hat Creek in 2022:| Hat Creek: | $17,463 |
| State: | $36,708 |
Change in median per capita income between 2000 and 2022:| Hat Creek, California: | +22.7% |
| State: | +110.4% |
Income statistics for Hispanic or Latino residents
Number of households with income < $10k:| Hat Creek: | 0.0% (0) |
| State: | 4.3% (183,294) |
Number of households with income $10k - 20k:| Hat Creek: | 0.0% (0) |
| California: | 6.0% (253,903) |
Number of households with income $20k - 30k:| Hat Creek: | 0.0% (0) |
| California: | 6.8% (286,386) |
Number of households with income $30k - 40k:| Hat Creek: | 0.0% (0) |
| California: | 7.4% (313,728) |
Number of households with income $40k - 50k:| Hat Creek: | 0.0% (0) |
| State: | 7.4% (313,199) |
Number of households with income $50k - 60k:| Hat Creek: | 0.0% (0) |
| State: | 7.2% (305,366) |
Number of households with income $60k - 75k:| Hat Creek: | 0.0% (0) |
| California: | 10.3% (434,937) |
Number of households with income $75k - 100k:| Hat Creek: | 0.0% (0) |
| State: | 14.4% (607,302) |
Number of households with income $100k - 125k:| Hat Creek: | 0.0% (0) |
| California: | 10.6% (447,424) |
Number of households with income $125k - 150k:| Hat Creek: | 100.0% (13) |
| California: | 7.5% (316,022) |
Number of households with income $150k - 200k:| Hat Creek: | 0.0% (0) |
| California: | 9.2% (386,269) |
Number of households with income > $200k:| Hat Creek: | 0.0% (0) |
| State: | 8.8% (372,651) |
Aggregate household income in Hat Creek in 2022: $1,616,061
Median per capita income in Hat Creek in 2022:| Hat Creek: | $48,356 |
| State: | $27,240 |
Income statistics for Multirace residents
Median per capita income in Hat Creek in 2022:| Hat Creek: | $21,483 |
| State: | $32,124 |
Change in median per capita income between 2000 and 2022:| Hat Creek, California: | +94.3% |
| California: | +120.4% |