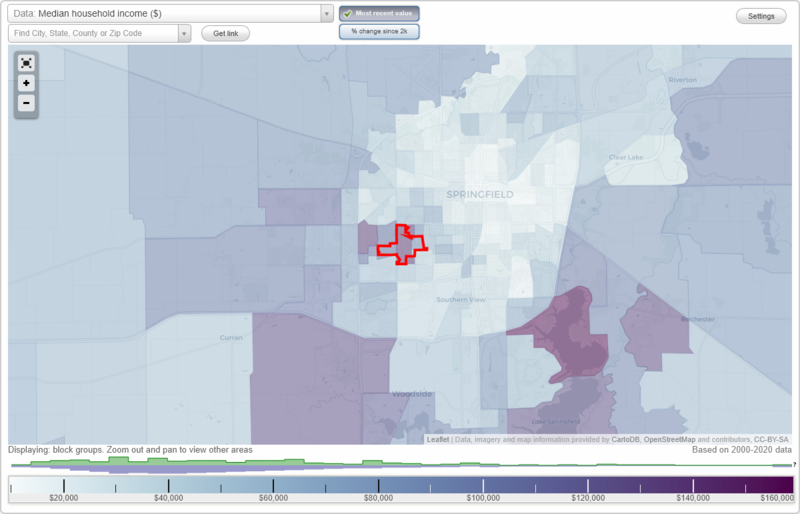
The median household income in Leland Grove, IL in 2022 was $131,291, which was 41.6% greater than the median annual income of $76,708 across the entire state of Illinois. Compared to the median income of $75,437 in 2000 this represents an increase of 42.5%. The per capita income in 2022 was $93,754, which means an increase of 44.8% compared to 2000 when it was $51,714.
Whole page based on the data from 2000 / 2022 when the population of Leland Grove, Illinois was 1,592 / 1,466
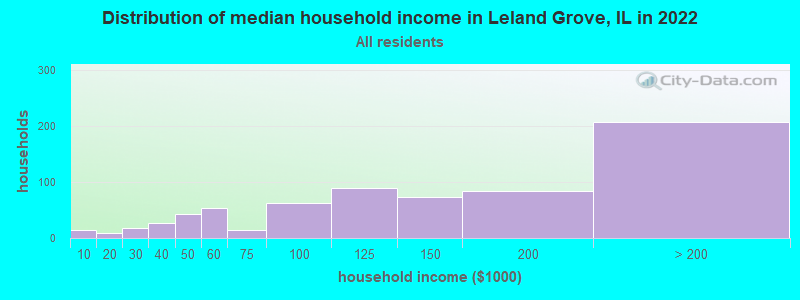
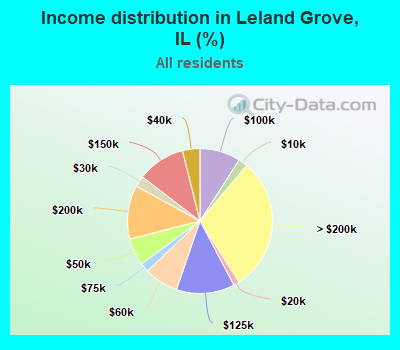
Income statistics for all residents
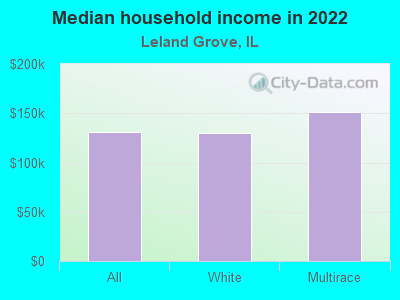
Median household income in Leland Grove, IL in 2022:
Leland Grove:
$131,292
Illinois:
$76,708
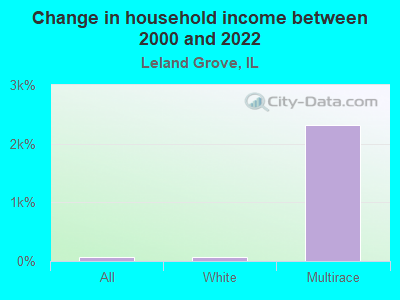
Change in median household income between 2000 and 2022:
Leland Grove, Illinois:
+74.0%
State:
+64.6%
Number of households with income < $10k:
Leland Grove:
2.0% (14)
State:
5.9% (296,090)
Number of households with income $10k - 20k:
Leland Grove:
1.3% (9)
State:
6.6% (333,259)
Number of households with income $20k - 30k:
Leland Grove:
2.5% (17)
State:
6.8% (342,921)
Number of households with income $30k - 40k:
Leland Grove:
3.9% (27)
State:
7.0% (355,254)
Number of households with income $40k - 50k:
Leland Grove:
6.1% (42)
State:
6.7% (340,678)
Number of households with income $50k - 60k:
Leland Grove:
7.6% (53)
Illinois:
6.7% (339,405)
Number of households with income $60k - 75k:
Leland Grove:
2.0% (14)
State:
9.2% (465,709)
Number of households with income $75k - 100k:
Leland Grove:
9.1% (63)
State:
12.9% (651,353)
Number of households with income $100k - 125k:
Leland Grove:
13.0% (90)
State:
10.3% (522,359)
Number of households with income $125k - 150k:
Leland Grove:
10.7% (74)
Illinois:
7.3% (367,136)
Number of households with income $150k - 200k:
Leland Grove:
12.0% (83)
State:
9.0% (455,249)
Number of households with income > $200k:
Leland Grove:
29.9% (207)
State:
11.6% (586,947)
Aggregate household income in Leland Grove in 2022: $137,649,989
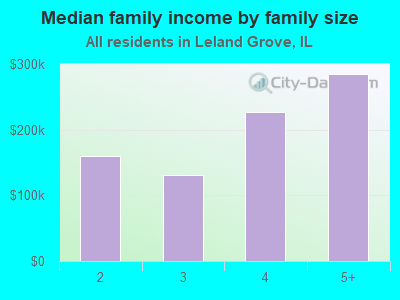
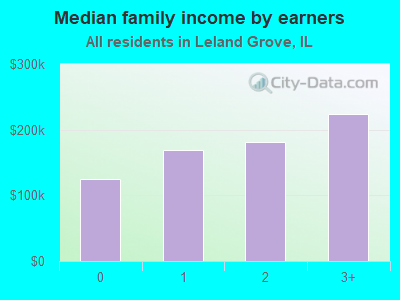
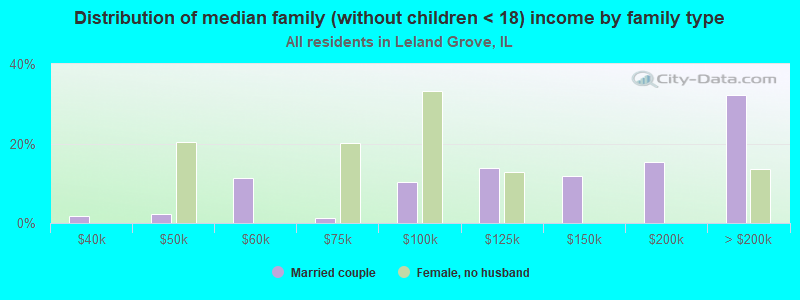
Median family income in Leland Grove in 2022:
Leland Grove:
$171,567
State:
$96,948
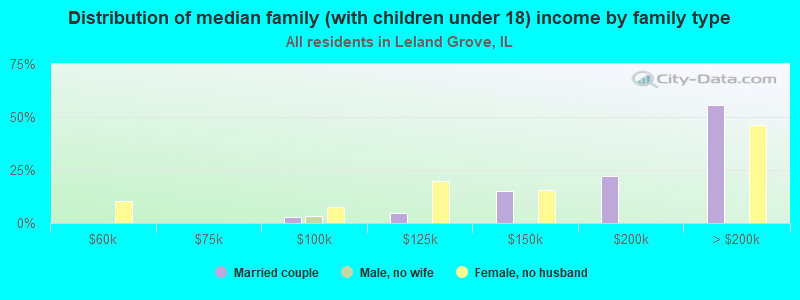
Number of families with income $30k - 40k:
Leland Grove:
0.8% (4)
State:
5.3% (167,069)
Number of families with income $40k - 50k:
Leland Grove:
1.6% (7)
Illinois:
5.8% (181,164)
Number of families with income $50k - 60k:
Leland Grove:
6.8% (30)
State:
6.1% (191,561)
Number of families with income $60k - 75k:
Leland Grove:
1.6% (7)
State:
9.0% (282,985)
Number of families with income $75k - 100k:
Leland Grove:
9.4% (41)
Illinois:
13.8% (432,725)
Number of families with income $100k - 125k:
Leland Grove:
11.6% (51)
State:
11.9% (373,296)
Number of families with income $125k - 150k:
Leland Grove:
15.4% (68)
Illinois:
8.9% (279,791)
Number of families with income $150k - 200k:
Leland Grove:
12.9% (57)
State:
11.9% (372,004)
Number of families with income > $200k:
Leland Grove:
39.9% (175)
State:
15.9% (500,033)
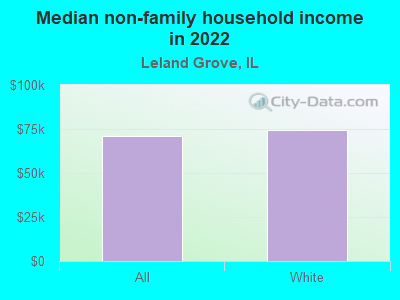
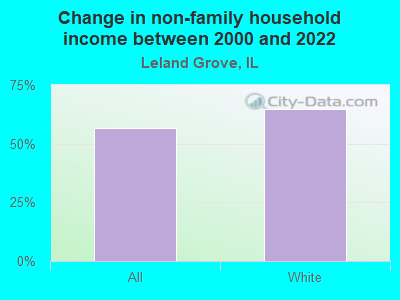
Median non-family income in Leland Grove in 2022:
Leland Grove:
$71,069
Illinois:
$46,533
Change in median non-family income between 2000 and 2022:
Leland Grove, Illinois:
+56.7%
Illinois:
+64.0%
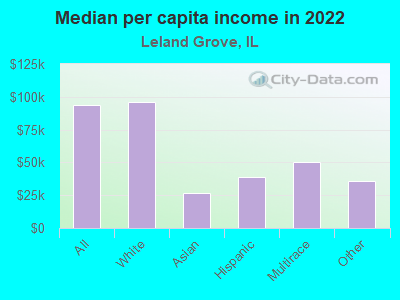
Median per capita income in Leland Grove in 2022:
Leland Grove:
$93,755
Illinois:
$43,317
Change in median per capita income between 2000 and 2022:
Leland Grove, Illinois:
+81.3%
State:
+87.5%
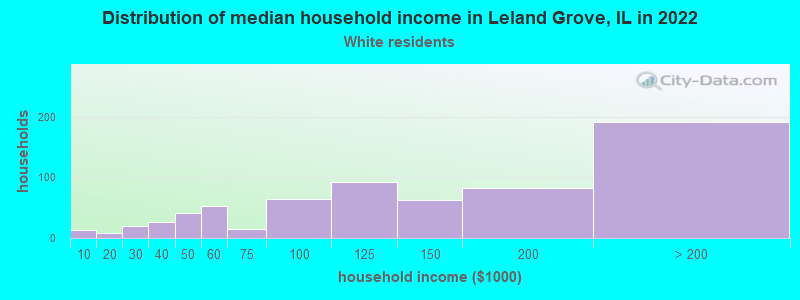
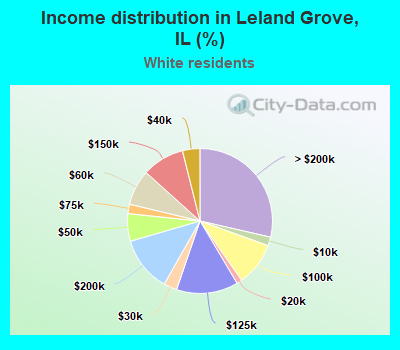
Income statistics for White residents
Median household income in Leland Grove, IL in 2022:
Leland Grove:
$129,715
Illinois:
$83,346
Change in median household income between 2000 and 2022:
Leland Grove, Illinois:
+72.1%
State:
+67.5%
Number of households with income < $10k:
Leland Grove:
1.9% (13)
State:
4.5% (149,895)
Number of households with income $10k - 20k:
Leland Grove:
1.2% (8)
State:
5.5% (184,529)
Number of households with income $20k - 30k:
Leland Grove:
3.0% (20)
Illinois:
6.1% (205,767)
Number of households with income $30k - 40k:
Leland Grove:
3.9% (26)
Illinois:
6.7% (225,572)
Number of households with income $40k - 50k:
Leland Grove:
6.1% (41)
Illinois:
6.5% (216,965)
Number of households with income $50k - 60k:
Leland Grove:
7.9% (53)
State:
6.6% (222,841)
Number of households with income $60k - 75k:
Leland Grove:
2.1% (14)
State:
9.3% (312,758)
Number of households with income $75k - 100k:
Leland Grove:
9.7% (65)
State:
12.9% (433,180)
Number of households with income $100k - 125k:
Leland Grove:
13.8% (92)
Illinois:
10.7% (360,753)
Number of households with income $125k - 150k:
Leland Grove:
9.4% (63)
State:
7.9% (266,532)
Number of households with income $150k - 200k:
Leland Grove:
12.3% (82)
Illinois:
10.0% (337,357)
Number of households with income > $200k:
Leland Grove:
28.6% (191)
State:
13.3% (446,069)
Aggregate household income in Leland Grove in 2022: $132,842,632
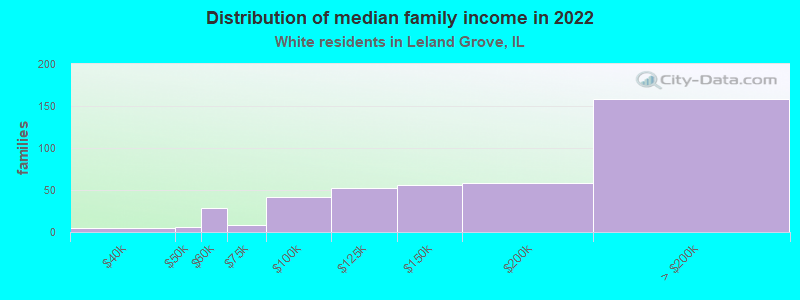
Median family income in Leland Grove in 2022:
Leland Grove:
$166,379
Illinois:
$107,938
Number of families with income $30k - 40k:
Leland Grove:
1.2% (5)
State:
4.4% (90,563)
Number of families with income $40k - 50k:
Leland Grove:
1.5% (6)
State:
5.0% (102,597)
Number of families with income $50k - 60k:
Leland Grove:
7.0% (29)
State:
5.8% (119,129)
Number of families with income $60k - 75k:
Leland Grove:
1.9% (8)
State:
8.8% (179,665)
Number of families with income $75k - 100k:
Leland Grove:
10.1% (42)
State:
13.5% (276,887)
Number of families with income $100k - 125k:
Leland Grove:
12.6% (52)
State:
12.5% (256,099)
Number of families with income $125k - 150k:
Leland Grove:
13.6% (56)
Illinois:
9.8% (199,855)
Number of families with income $150k - 200k:
Leland Grove:
14.0% (58)
Illinois:
13.4% (274,569)
Number of families with income > $200k:
Leland Grove:
38.1% (158)
State:
18.6% (381,354)
Median non-family income in Leland Grove in 2022:
Leland Grove:
$74,533
State:
$50,934
Change in median non-family income between 2000 and 2022:
Leland Grove, Illinois:
+64.8%
State:
+70.7%
Median per capita income in Leland Grove in 2022:
Leland Grove:
$96,333
State:
$50,738
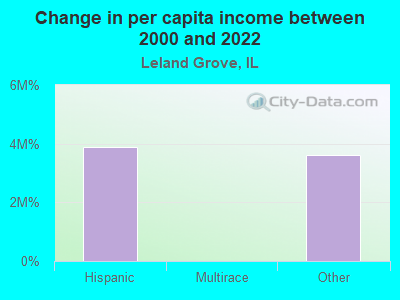
Change in median per capita income between 2000 and 2022:
Leland Grove, Illinois:
+85.3%
State:
+95.5%
Income statistics for Asian residents
Aggregate household income in Leland Grove in 2022: $1,905,821
Median per capita income in Leland Grove in 2022:
Leland Grove:
$26,362
State:
$52,977
Change in median per capita income between 2000 and 2022:: -9.4%
Leland Grove, Illinois:
-9.4%
State:
+119.5%
Income statistics for Hispanic or Latino residents
Aggregate household income in Leland Grove in 2022: $2,609,686
Median per capita income in Leland Grove in 2022:
Leland Grove:
$38,780
Illinois:
$26,551
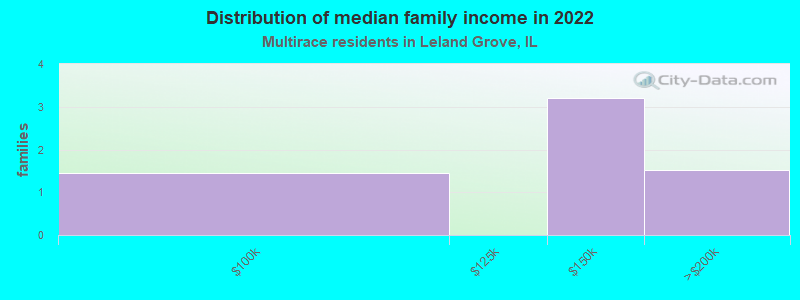
Income statistics for Multirace residents
Median household income in Leland Grove, IL in 2022:
Leland Grove:
$151,499
State:
$71,185
Aggregate household income in Leland Grove in 2022: $988,243
Median family income in Leland Grove in 2022:
Leland Grove:
$129,709
Illinois:
$84,400
Median per capita income in Leland Grove in 2022:
Leland Grove:
$50,613
State:
$29,285
Income statistics for other residents
Median per capita income in Leland Grove in 2022:
Leland Grove:
$36,089
Illinois:
$25,392
Discuss Leland Grove, Illinois (IL) on our hugely popular Illinois forum.