Livingston, Kentucky (KY) income map, earnings map, and wages data
Data:
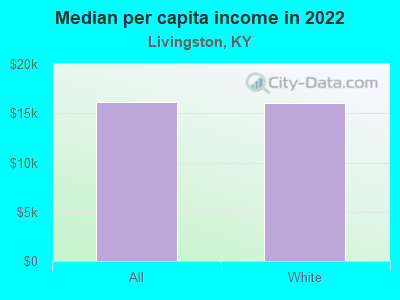
The per capita income in 2022 was $16,127, which means an increase of 27.2% compared to 2000 when it was $11,734.
Whole page based on the data from 2000 / 2022 when the population of Livingston, Kentucky was 228 / 158
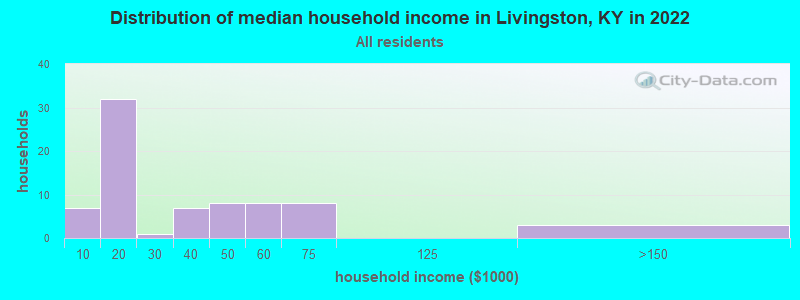
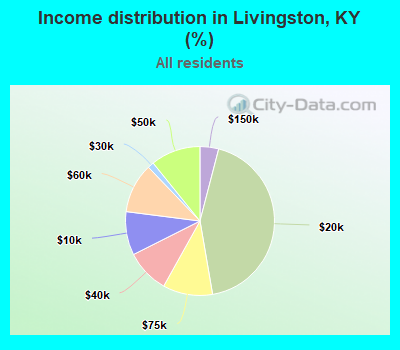
Income statistics for all residents
Number of households with income < $10k:| Livingston: | 9.5% (7) |
| Kentucky: | 6.8% (123,697) |
Number of households with income $10k - 20k:| Livingston: | 43.2% (32) |
| Kentucky: | 10.0% (182,645) |
Number of households with income $20k - 30k:| Livingston: | 1.4% (1) |
| State: | 9.0% (164,092) |
Number of households with income $30k - 40k:| Livingston: | 9.5% (7) |
| Kentucky: | 9.1% (165,607) |
Number of households with income $40k - 50k:| Livingston: | 10.8% (8) |
| State: | 8.0% (146,315) |
Number of households with income $50k - 60k:| Livingston: | 10.8% (8) |
| Kentucky: | 7.7% (140,671) |
Number of households with income $60k - 75k:| Livingston: | 10.8% (8) |
| Kentucky: | 9.8% (180,002) |
Number of households with income $75k - 100k:| Livingston: | 0.0% (0) |
| State: | 12.6% (230,239) |
Number of households with income $100k - 125k:| Livingston: | 0.0% (0) |
| Kentucky: | 9.0% (164,398) |
Number of households with income $125k - 150k:| Livingston: | 4.1% (3) |
| State: | 5.9% (108,602) |
Number of households with income $150k - 200k:| Livingston: | 0.0% (0) |
| Kentucky: | 6.2% (112,813) |
Number of households with income > $200k:| Livingston: | 0.0% (0) |
| State: | 6.0% (109,599) |
Aggregate household income in Livingston in 2022: $2,454,289
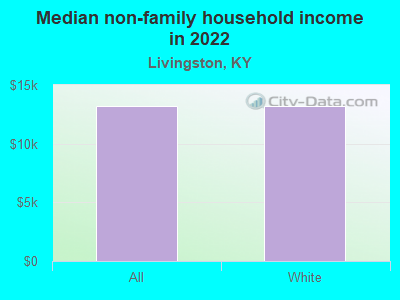
Median non-family income in Livingston in 2022:| Livingston: | $13,225 |
| Kentucky: | $33,993 |
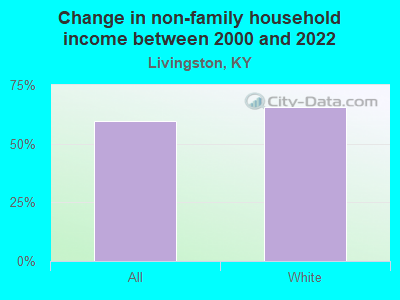
Change in median non-family income between 2000 and 2022:| Livingston, Kentucky: | +59.7% |
| State: | +79.2% |
Median per capita income in Livingston in 2022:| Livingston: | $16,128 |
| Kentucky: | $33,980 |
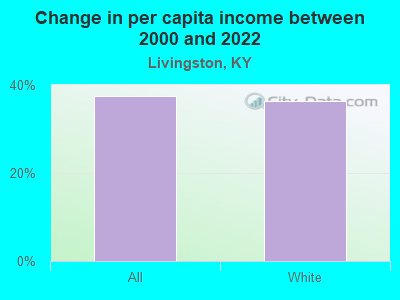
Change in median per capita income between 2000 and 2022:| Livingston, Kentucky: | +37.4% |
| State: | +87.8% |
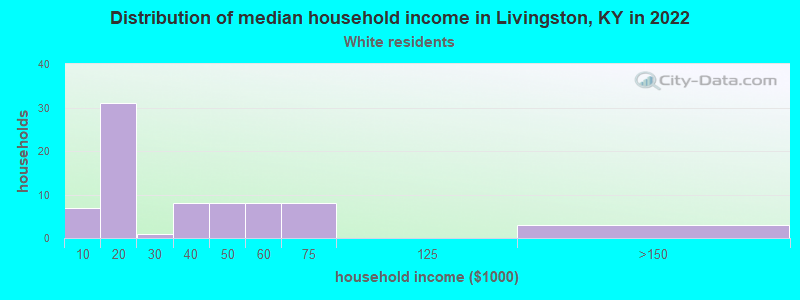
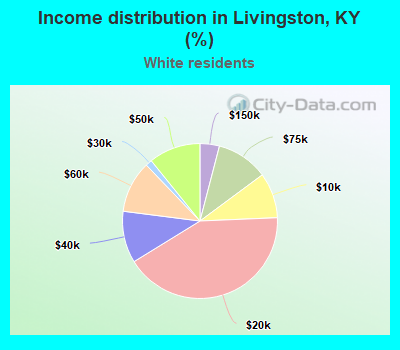
Income statistics for White residents
Number of households with income < $10k:| Livingston: | 9.5% (7) |
| State: | 6.2% (96,690) |
Number of households with income $10k - 20k:| Livingston: | 41.9% (31) |
| State: | 9.7% (151,125) |
Number of households with income $20k - 30k:| Livingston: | 1.4% (1) |
| State: | 8.9% (139,532) |
Number of households with income $30k - 40k:| Livingston: | 10.8% (8) |
| State: | 9.1% (142,284) |
Number of households with income $40k - 50k:| Livingston: | 10.8% (8) |
| Kentucky: | 7.7% (121,151) |
Number of households with income $50k - 60k:| Livingston: | 10.8% (8) |
| State: | 7.7% (119,790) |
Number of households with income $60k - 75k:| Livingston: | 10.8% (8) |
| State: | 9.9% (154,174) |
Number of households with income $75k - 100k:| Livingston: | 0.0% (0) |
| Kentucky: | 12.8% (199,740) |
Number of households with income $100k - 125k:| Livingston: | 0.0% (0) |
| State: | 9.4% (146,284) |
Number of households with income $125k - 150k:| Livingston: | 4.1% (3) |
| State: | 6.0% (94,180) |
Number of households with income $150k - 200k:| Livingston: | 0.0% (0) |
| State: | 6.4% (100,702) |
Number of households with income > $200k:| Livingston: | 0.0% (0) |
| State: | 6.3% (98,502) |
Aggregate household income in Livingston in 2022: $2,403,580
Median non-family income in Livingston in 2022:| Livingston: | $13,196 |
| State: | $34,415 |
Change in median non-family income between 2000 and 2022:| Livingston, Kentucky: | +65.6% |
| State: | +78.3% |
Median per capita income in Livingston in 2022:| Livingston: | $16,072 |
| Kentucky: | $35,352 |
Change in median per capita income between 2000 and 2022:| Livingston, Kentucky: | +36.3% |
| State: | +90.2% |