Lompoc Valley, California (CA) income map, earnings map, and wages data
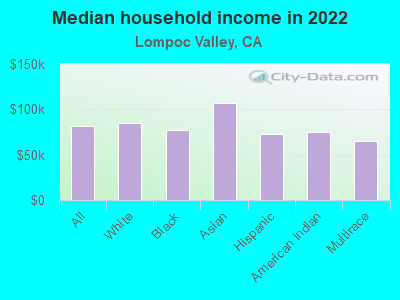
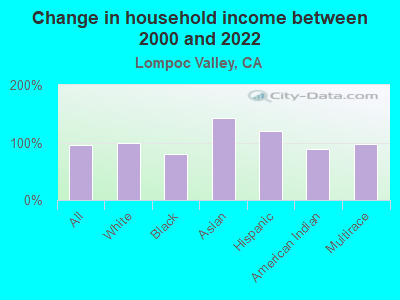
The median household income in Lompoc Valley, CA in 2022 was $81,449, which was 12.4% less than the median annual income of $91,551 across the entire state of California. Compared to the median income of $41,827 in 2000 this represents an increase of 48.6%. The per capita income in 2022 was $34,090, which means an increase of 48.5% compared to 2000 when it was $17,559.
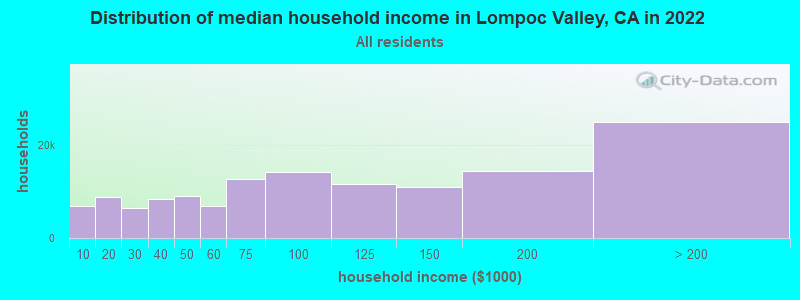
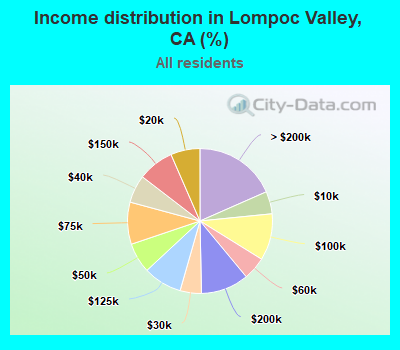
Income statistics for all residents
Median household income in Lompoc Valley, CA in 2022:| Lompoc Valley: | $81,450 |
| State: | $91,551 |
Change in median household income between 2000 and 2022:| Lompoc Valley, California: | +94.7% |
| California: | +92.8% |
Number of households with income < $10k:| Lompoc Valley: | 5.0% (6,779) |
| California: | 4.8% (654,370) |
Number of households with income $10k - 20k:| Lompoc Valley: | 6.5% (8,831) |
| California: | 5.8% (789,493) |
Number of households with income $20k - 30k:| Lompoc Valley: | 4.8% (6,433) |
| California: | 5.7% (778,318) |
Number of households with income $30k - 40k:| Lompoc Valley: | 6.2% (8,404) |
| State: | 5.8% (783,170) |
Number of households with income $40k - 50k:| Lompoc Valley: | 6.7% (9,105) |
| State: | 5.8% (781,352) |
Number of households with income $50k - 60k:| Lompoc Valley: | 5.1% (6,947) |
| California: | 5.6% (760,175) |
Number of households with income $60k - 75k:| Lompoc Valley: | 9.4% (12,697) |
| State: | 8.2% (1,104,699) |
Number of households with income $75k - 100k:| Lompoc Valley: | 10.4% (14,094) |
| State: | 12.0% (1,627,633) |
Number of households with income $100k - 125k:| Lompoc Valley: | 8.6% (11,674) |
| State: | 10.0% (1,358,619) |
Number of households with income $125k - 150k:| Lompoc Valley: | 8.0% (10,861) |
| California: | 7.6% (1,027,455) |
Number of households with income $150k - 200k:| Lompoc Valley: | 10.7% (14,467) |
| State: | 10.6% (1,439,811) |
Number of households with income > $200k:| Lompoc Valley: | 18.4% (24,885) |
| California: | 18.0% (2,445,491) |
Aggregate household income in Lompoc Valley in 2022: $9,024,686,398
Median family income in Lompoc Valley in 2022:| Lompoc Valley: | $96,062 |
| State: | $104,823 |
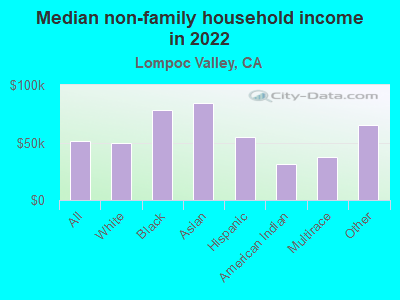
Median non-family income in Lompoc Valley in 2022:| Lompoc Valley: | $50,900 |
| State: | $59,348 |
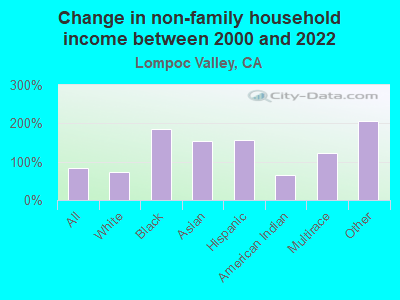
Change in median non-family income between 2000 and 2022:| Lompoc Valley, California: | +82.9% |
| State: | +85.3% |
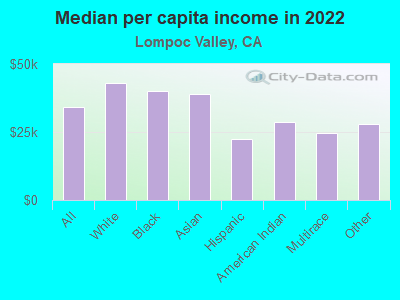
Median per capita income in Lompoc Valley in 2022:| Lompoc Valley: | $34,091 |
| California: | $46,661 |
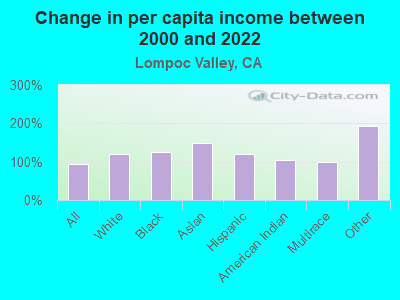
Change in median per capita income between 2000 and 2022:| Lompoc Valley, California: | +94.1% |
| State: | +105.5% |
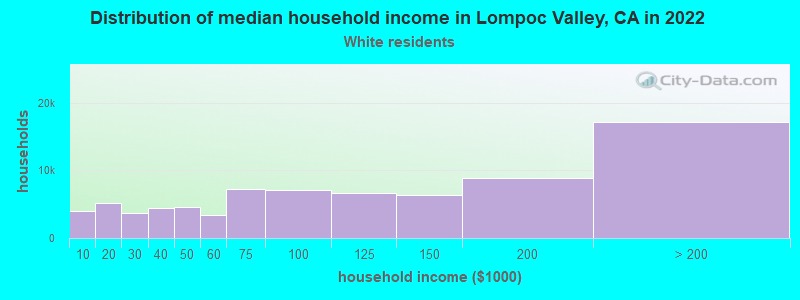
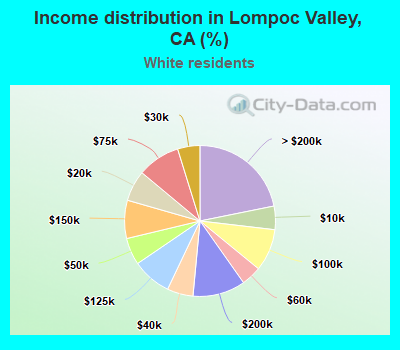
Income statistics for White residents
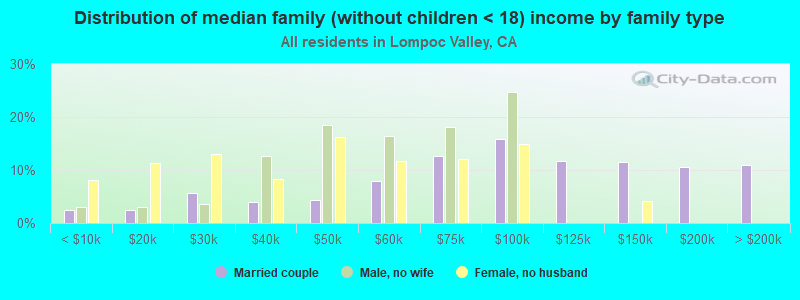
Median household income in Lompoc Valley, CA in 2022:| Lompoc Valley: | $85,432 |
| California: | $100,917 |
Change in median household income between 2000 and 2022:| Lompoc Valley, California: | +99.8% |
| California: | +96.8% |
Number of households with income < $10k:| Lompoc Valley: | 5.0% (3,943) |
| State: | 4.4% (284,109) |
Number of households with income $10k - 20k:| Lompoc Valley: | 6.6% (5,192) |
| State: | 5.3% (340,330) |
Number of households with income $20k - 30k:| Lompoc Valley: | 4.8% (3,762) |
| State: | 5.3% (343,145) |
Number of households with income $30k - 40k:| Lompoc Valley: | 5.6% (4,377) |
| State: | 5.1% (330,146) |
Number of households with income $40k - 50k:| Lompoc Valley: | 5.8% (4,548) |
| California: | 5.2% (335,310) |
Number of households with income $50k - 60k:| Lompoc Valley: | 4.3% (3,388) |
| State: | 5.1% (326,299) |
Number of households with income $60k - 75k:| Lompoc Valley: | 9.2% (7,201) |
| State: | 7.6% (487,640) |
Number of households with income $75k - 100k:| Lompoc Valley: | 9.1% (7,120) |
| California: | 11.5% (736,578) |
Number of households with income $100k - 125k:| Lompoc Valley: | 8.4% (6,614) |
| State: | 10.1% (648,782) |
Number of households with income $125k - 150k:| Lompoc Valley: | 8.2% (6,424) |
| State: | 7.8% (499,671) |
Number of households with income $150k - 200k:| Lompoc Valley: | 11.3% (8,858) |
| State: | 11.4% (729,603) |
Number of households with income > $200k:| Lompoc Valley: | 21.8% (17,162) |
| State: | 21.2% (1,364,246) |
Aggregate household income in Lompoc Valley in 2022: $4,666,517,727
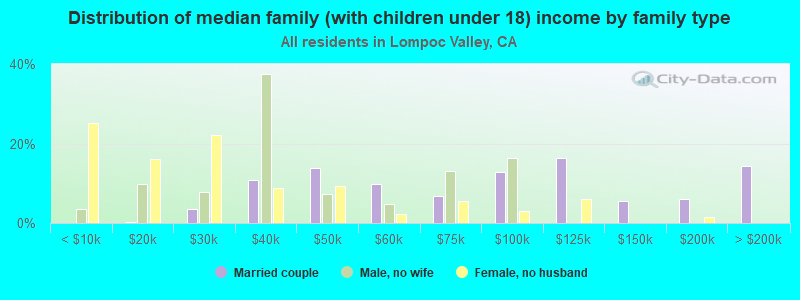
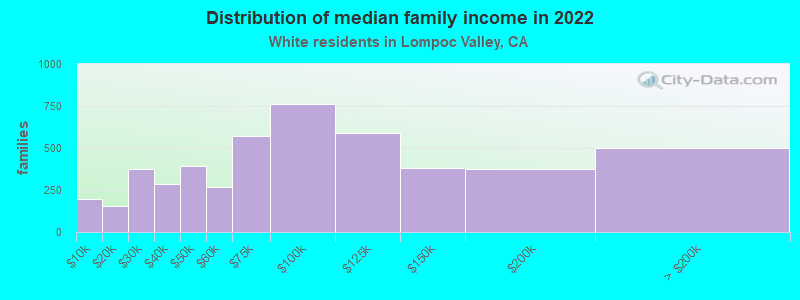
Median family income in Lompoc Valley in 2022:| Lompoc Valley: | $108,571 |
| California: | $125,379 |
Number of families with income < $10k:| Lompoc Valley: | 4.0% (195) |
| State: | 2.2% (87,079) |
Number of families with income $10k - 20k:| Lompoc Valley: | 3.2% (156) |
| State: | 2.5% (97,716) |
Number of families with income $20k - 30k:| Lompoc Valley: | 7.7% (374) |
| State: | 3.5% (137,295) |
Number of families with income $30k - 40k:| Lompoc Valley: | 5.9% (288) |
| California: | 3.9% (152,947) |
Number of families with income $40k - 50k:| Lompoc Valley: | 8.1% (395) |
| State: | 4.3% (169,197) |
Number of families with income $50k - 60k:| Lompoc Valley: | 5.5% (269) |
| State: | 4.5% (176,192) |
Number of families with income $60k - 75k:| Lompoc Valley: | 11.7% (570) |
| State: | 7.0% (274,752) |
Number of families with income $75k - 100k:| Lompoc Valley: | 15.7% (761) |
| State: | 11.3% (445,632) |
Number of families with income $100k - 125k:| Lompoc Valley: | 12.2% (590) |
| State: | 10.7% (423,630) |
Number of families with income $125k - 150k:| Lompoc Valley: | 7.8% (379) |
| California: | 9.1% (357,408) |
Number of families with income $150k - 200k:| Lompoc Valley: | 7.7% (375) |
| State: | 13.5% (532,693) |
Number of families with income > $200k:| Lompoc Valley: | 10.3% (501) |
| State: | 27.6% (1,086,948) |
Median non-family income in Lompoc Valley in 2022:| Lompoc Valley: | $49,794 |
| State: | $62,819 |
Change in median non-family income between 2000 and 2022:| Lompoc Valley, California: | +74.4% |
| State: | +84.4% |
Median per capita income in Lompoc Valley in 2022:| Lompoc Valley: | $43,094 |
| State: | $61,706 |
Change in median per capita income between 2000 and 2022:| Lompoc Valley, California: | +119.5% |
| State: | +122.7% |
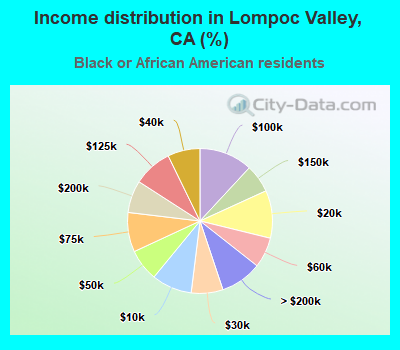
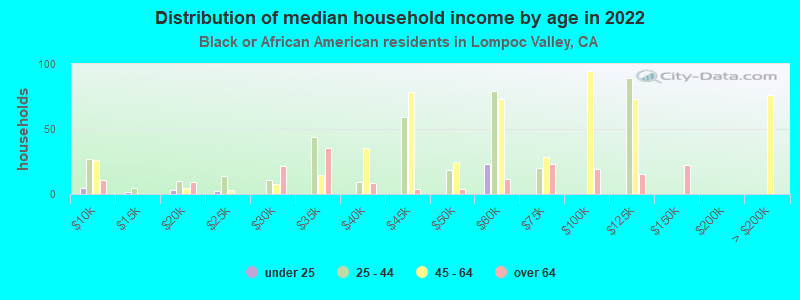
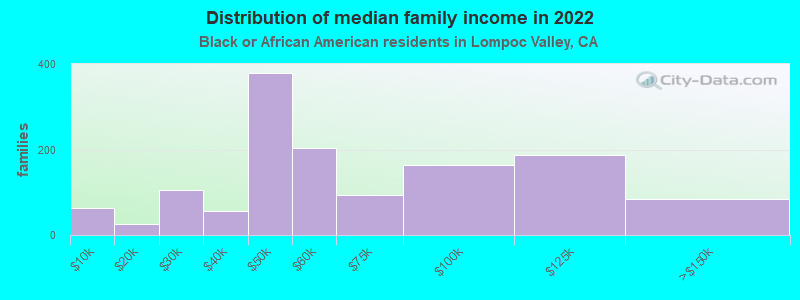
Income statistics for Black or African American residents
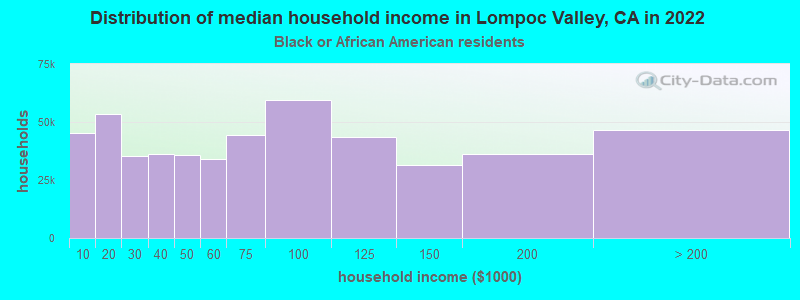
Median household income in Lompoc Valley, CA in 2022:| Lompoc Valley: | $77,258 |
| California: | $63,268 |
Change in median household income between 2000 and 2022:| Lompoc Valley, California: | +79.5% |
| California: | +81.0% |
Number of households with income < $10k:| Lompoc Valley: | 9.0% (45,052) |
| State: | 9.0% (73,219) |
Number of households with income $10k - 20k:| Lompoc Valley: | 10.6% (53,324) |
| State: | 10.6% (86,666) |
Number of households with income $20k - 30k:| Lompoc Valley: | 7.1% (35,508) |
| California: | 7.1% (57,719) |
Number of households with income $30k - 40k:| Lompoc Valley: | 7.2% (36,154) |
| State: | 7.2% (58,714) |
Number of households with income $40k - 50k:| Lompoc Valley: | 7.1% (35,715) |
| State: | 7.1% (58,075) |
Number of households with income $50k - 60k:| Lompoc Valley: | 6.8% (34,014) |
| State: | 6.8% (55,229) |
Number of households with income $60k - 75k:| Lompoc Valley: | 8.8% (44,201) |
| California: | 8.8% (71,895) |
Number of households with income $75k - 100k:| Lompoc Valley: | 11.9% (59,609) |
| State: | 11.9% (96,893) |
Number of households with income $100k - 125k:| Lompoc Valley: | 8.7% (43,477) |
| State: | 8.7% (70,729) |
Number of households with income $125k - 150k:| Lompoc Valley: | 6.3% (31,523) |
| State: | 6.3% (51,211) |
Number of households with income $150k - 200k:| Lompoc Valley: | 7.2% (36,110) |
| State: | 7.2% (58,687) |
Number of households with income > $200k:| Lompoc Valley: | 9.3% (46,411) |
| State: | 9.3% (75,487) |
Aggregate household income in Lompoc Valley in 2022: $108,579,990
Median family income in Lompoc Valley in 2022:| Lompoc Valley: | $115,425 |
| State: | $77,263 |
Number of families with income < $10k:| Lompoc Valley: | 4.5% (62) |
| State: | 5.9% (27,037) |
Number of families with income $10k - 20k:| Lompoc Valley: | 1.9% (25) |
| State: | 6.4% (29,505) |
Number of families with income $20k - 30k:| Lompoc Valley: | 7.7% (105) |
| California: | 5.6% (25,755) |
Number of families with income $30k - 40k:| Lompoc Valley: | 4.2% (57) |
| California: | 6.8% (30,948) |
Number of families with income $40k - 50k:| Lompoc Valley: | 27.8% (378) |
| State: | 8.3% (38,171) |
Number of families with income $50k - 60k:| Lompoc Valley: | 15.0% (204) |
| State: | 7.0% (31,860) |
Number of families with income $60k - 75k:| Lompoc Valley: | 6.9% (93) |
| State: | 8.7% (40,021) |
Number of families with income $75k - 100k:| Lompoc Valley: | 12.0% (163) |
| State: | 12.4% (56,846) |
Number of families with income $100k - 125k:| Lompoc Valley: | 13.8% (187) |
| California: | 9.8% (44,911) |
Number of families with income $125k - 150k:| Lompoc Valley: | 6.3% (85) |
| California: | 7.5% (34,434) |
Median non-family income in Lompoc Valley in 2022:| Lompoc Valley: | $78,685 |
| State: | $41,942 |
Median per capita income in Lompoc Valley in 2022:| Lompoc Valley: | $40,157 |
| State: | $36,708 |
Change in median per capita income between 2000 and 2022:| Lompoc Valley, California: | +124.5% |
| State: | +110.4% |
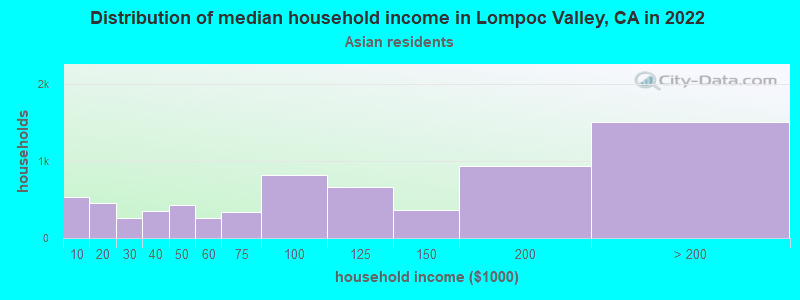
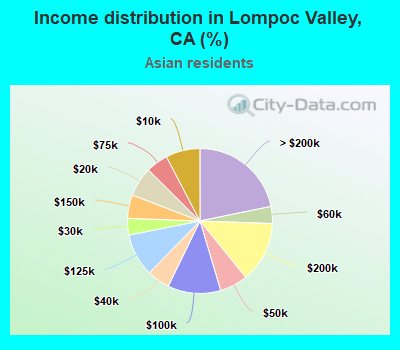
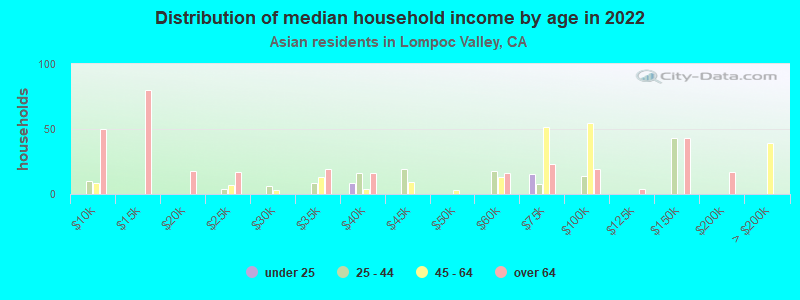
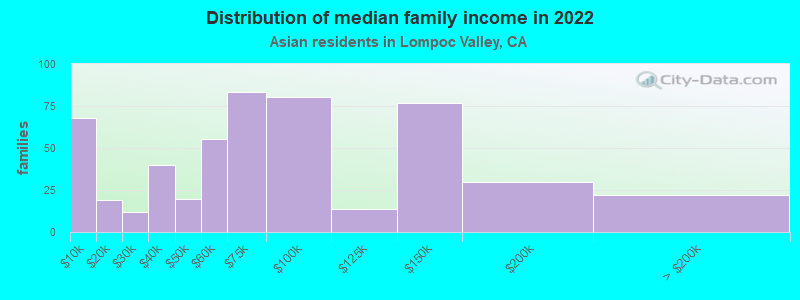
Income statistics for Asian residents
Median household income in Lompoc Valley, CA in 2022:| Lompoc Valley: | $106,765 |
| California: | $119,861 |
Change in median household income between 2000 and 2022:| Lompoc Valley, California: | +141.9% |
| California: | +116.5% |
Number of households with income < $10k:| Lompoc Valley: | 7.6% (527) |
| State: | 5.1% (106,273) |
Number of households with income $10k - 20k:| Lompoc Valley: | 6.6% (454) |
| State: | 4.9% (101,815) |
Number of households with income $20k - 30k:| Lompoc Valley: | 3.7% (256) |
| California: | 4.6% (94,414) |
Number of households with income $30k - 40k:| Lompoc Valley: | 5.1% (353) |
| State: | 4.1% (84,491) |
Number of households with income $40k - 50k:| Lompoc Valley: | 6.2% (430) |
| California: | 4.0% (81,758) |
Number of households with income $50k - 60k:| Lompoc Valley: | 3.8% (261) |
| State: | 3.9% (80,971) |
Number of households with income $60k - 75k:| Lompoc Valley: | 4.9% (339) |
| California: | 6.0% (124,194) |
Number of households with income $75k - 100k:| Lompoc Valley: | 11.8% (814) |
| State: | 9.7% (200,337) |
Number of households with income $100k - 125k:| Lompoc Valley: | 9.6% (659) |
| State: | 9.4% (193,488) |
Number of households with income $125k - 150k:| Lompoc Valley: | 5.3% (363) |
| California: | 7.7% (158,253) |
Number of households with income $150k - 200k:| Lompoc Valley: | 13.6% (938) |
| State: | 12.2% (252,139) |
Number of households with income > $200k:| Lompoc Valley: | 21.8% (1,502) |
| State: | 28.4% (586,641) |
Aggregate household income in Lompoc Valley in 2022: $93,481,965
Median family income in Lompoc Valley in 2022:| Lompoc Valley: | $123,275 |
| State: | $136,040 |
Number of families with income < $10k:| Lompoc Valley: | 13.1% (68) |
| State: | 2.8% (42,046) |
Number of families with income $10k - 20k:| Lompoc Valley: | 3.7% (19) |
| California: | 3.1% (46,821) |
Number of families with income $20k - 30k:| Lompoc Valley: | 2.3% (12) |
| State: | 4.1% (61,519) |
Number of families with income $30k - 40k:| Lompoc Valley: | 7.7% (40) |
| California: | 3.7% (55,234) |
Number of families with income $40k - 50k:| Lompoc Valley: | 3.8% (20) |
| State: | 3.9% (58,471) |
Number of families with income $50k - 60k:| Lompoc Valley: | 10.7% (56) |
| State: | 3.9% (58,911) |
Number of families with income $60k - 75k:| Lompoc Valley: | 16.0% (83) |
| State: | 5.9% (88,675) |
Number of families with income $75k - 100k:| Lompoc Valley: | 15.5% (81) |
| State: | 9.5% (143,103) |
Number of families with income $100k - 125k:| Lompoc Valley: | 2.7% (14) |
| California: | 9.4% (142,085) |
Number of families with income $125k - 150k:| Lompoc Valley: | 14.8% (77) |
| State: | 8.0% (120,635) |
Number of families with income $150k - 200k:| Lompoc Valley: | 5.7% (30) |
| State: | 13.2% (198,099) |
Number of families with income > $200k:| Lompoc Valley: | 4.2% (22) |
| State: | 32.5% (489,303) |
Median non-family income in Lompoc Valley in 2022:| Lompoc Valley: | $84,259 |
| California: | $74,216 |
Median per capita income in Lompoc Valley in 2022:| Lompoc Valley: | $39,080 |
| State: | $58,824 |
Change in median per capita income between 2000 and 2022:| Lompoc Valley, California: | +147.6% |
| California: | +166.8% |
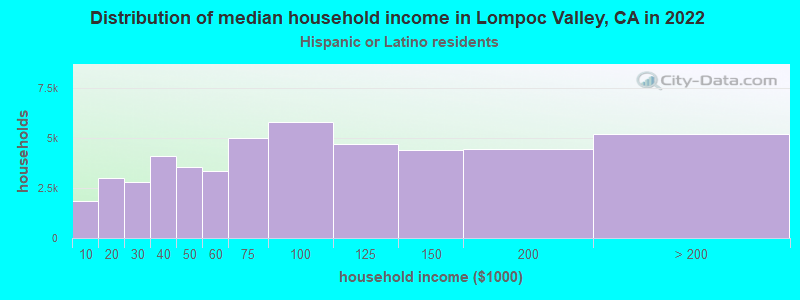
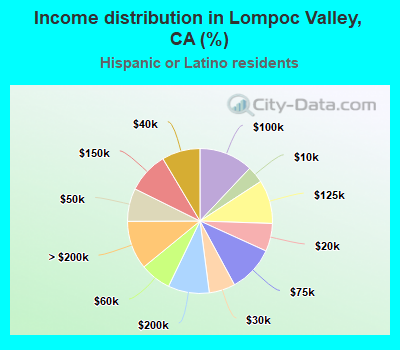
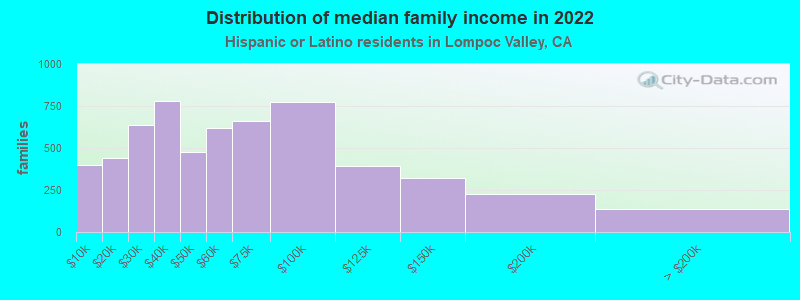
Income statistics for Hispanic or Latino residents
Median household income in Lompoc Valley, CA in 2022:| Lompoc Valley: | $72,436 |
| State: | $75,698 |
Change in median household income between 2000 and 2022:| Lompoc Valley, California: | +119.9% |
| State: | +107.2% |
Number of households with income < $10k:| Lompoc Valley: | 3.8% (1,832) |
| California: | 4.3% (183,294) |
Number of households with income $10k - 20k:| Lompoc Valley: | 6.2% (3,009) |
| State: | 6.0% (253,903) |
Number of households with income $20k - 30k:| Lompoc Valley: | 5.8% (2,810) |
| State: | 6.8% (286,386) |
Number of households with income $30k - 40k:| Lompoc Valley: | 8.5% (4,124) |
| State: | 7.4% (313,728) |
Number of households with income $40k - 50k:| Lompoc Valley: | 7.4% (3,572) |
| State: | 7.4% (313,199) |
Number of households with income $50k - 60k:| Lompoc Valley: | 7.0% (3,360) |
| State: | 7.2% (305,366) |
Number of households with income $60k - 75k:| Lompoc Valley: | 10.3% (4,995) |
| State: | 10.3% (434,937) |
Number of households with income $75k - 100k:| Lompoc Valley: | 12.0% (5,809) |
| California: | 14.4% (607,302) |
Number of households with income $100k - 125k:| Lompoc Valley: | 9.7% (4,709) |
| California: | 10.6% (447,424) |
Number of households with income $125k - 150k:| Lompoc Valley: | 9.2% (4,421) |
| State: | 7.5% (316,022) |
Number of households with income $150k - 200k:| Lompoc Valley: | 9.2% (4,444) |
| California: | 9.2% (386,269) |
Number of households with income > $200k:| Lompoc Valley: | 10.8% (5,230) |
| California: | 8.8% (372,651) |
Aggregate household income in Lompoc Valley in 2022: $645,465,604
Median family income in Lompoc Valley in 2022:| Lompoc Valley: | $73,083 |
| California: | $77,589 |
Number of families with income < $10k:| Lompoc Valley: | 6.8% (401) |
| State: | 3.9% (129,468) |
Number of families with income $10k - 20k:| Lompoc Valley: | 7.5% (438) |
| California: | 4.6% (151,997) |
Number of families with income $20k - 30k:| Lompoc Valley: | 10.8% (636) |
| State: | 6.6% (216,764) |
Number of families with income $30k - 40k:| Lompoc Valley: | 13.3% (782) |
| California: | 7.6% (249,849) |
Number of families with income $40k - 50k:| Lompoc Valley: | 8.1% (474) |
| California: | 7.7% (254,822) |
Number of families with income $50k - 60k:| Lompoc Valley: | 10.6% (621) |
| State: | 7.4% (244,815) |
Number of families with income $60k - 75k:| Lompoc Valley: | 11.3% (661) |
| California: | 10.5% (345,838) |
Number of families with income $75k - 100k:| Lompoc Valley: | 13.2% (773) |
| State: | 14.9% (491,589) |
Number of families with income $100k - 125k:| Lompoc Valley: | 6.7% (390) |
| State: | 10.7% (355,400) |
Number of families with income $125k - 150k:| Lompoc Valley: | 5.5% (324) |
| State: | 7.8% (259,317) |
Number of families with income $150k - 200k:| Lompoc Valley: | 3.9% (228) |
| California: | 9.3% (306,566) |
Number of families with income > $200k:| Lompoc Valley: | 2.3% (135) |
| State: | 9.1% (299,984) |
Median non-family income in Lompoc Valley in 2022:| Lompoc Valley: | $54,507 |
| State: | $49,746 |
Median per capita income in Lompoc Valley in 2022:| Lompoc Valley: | $22,276 |
| State: | $27,240 |
Change in median per capita income between 2000 and 2022:| Lompoc Valley, California: | +119.1% |
| State: | +133.3% |
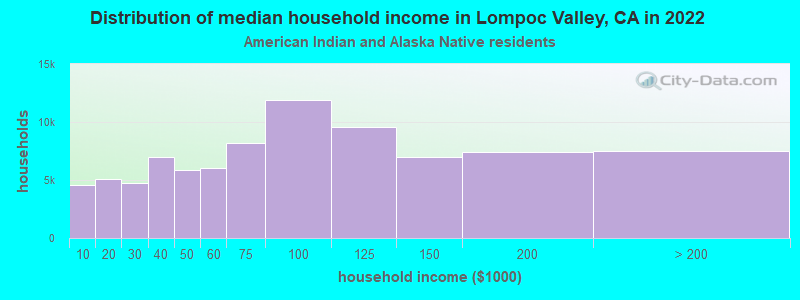
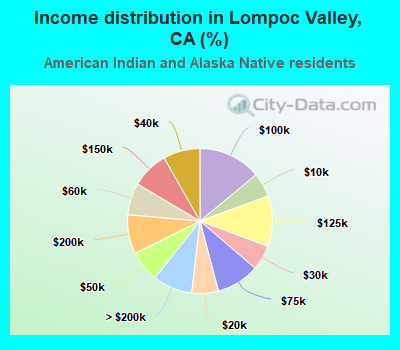
Income statistics for American Indian and Alaska Native residents
Median household income in Lompoc Valley, CA in 2022:| Lompoc Valley: | $74,704 |
| State: | $76,752 |
Change in median household income between 2000 and 2022:| Lompoc Valley, California: | +87.8% |
| California: | +110.0% |
Number of households with income < $10k:| Lompoc Valley: | 5.4% (4,589) |
| State: | 5.4% (8,471) |
Number of households with income $10k - 20k:| Lompoc Valley: | 6.0% (5,064) |
| California: | 6.0% (9,381) |
Number of households with income $20k - 30k:| Lompoc Valley: | 5.6% (4,757) |
| California: | 5.5% (8,668) |
Number of households with income $30k - 40k:| Lompoc Valley: | 8.2% (6,979) |
| State: | 8.3% (13,030) |
Number of households with income $40k - 50k:| Lompoc Valley: | 7.0% (5,905) |
| California: | 6.9% (10,908) |
Number of households with income $50k - 60k:| Lompoc Valley: | 7.1% (6,036) |
| State: | 7.1% (11,198) |
Number of households with income $60k - 75k:| Lompoc Valley: | 9.6% (8,153) |
| State: | 9.6% (15,190) |
Number of households with income $75k - 100k:| Lompoc Valley: | 14.0% (11,909) |
| State: | 14.1% (22,274) |
Number of households with income $100k - 125k:| Lompoc Valley: | 11.3% (9,567) |
| California: | 11.2% (17,643) |
Number of households with income $125k - 150k:| Lompoc Valley: | 8.3% (7,010) |
| California: | 8.3% (13,117) |
Number of households with income $150k - 200k:| Lompoc Valley: | 8.8% (7,450) |
| State: | 8.8% (13,853) |
Number of households with income > $200k:| Lompoc Valley: | 8.8% (7,480) |
| California: | 8.8% (13,925) |
Aggregate household income in Lompoc Valley in 2022: $45,890,114
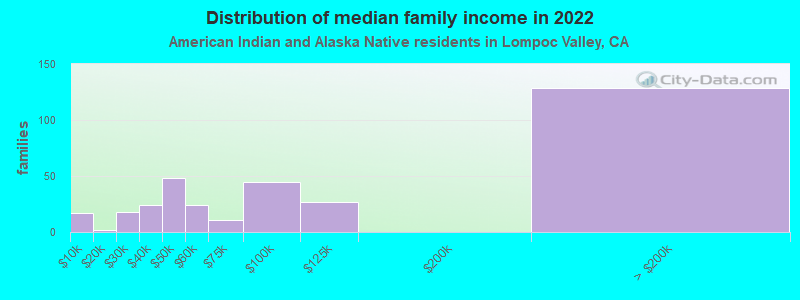
Median family income in Lompoc Valley in 2022:| Lompoc Valley: | $92,243 |
| California: | $81,108 |
Number of families with income < $10k:| Lompoc Valley: | 4.8% (17) |
| State: | 5.0% (5,711) |
Number of families with income $10k - 20k:| Lompoc Valley: | 0.7% (2) |
| State: | 3.7% (4,148) |
Number of families with income $20k - 30k:| Lompoc Valley: | 5.1% (18) |
| State: | 4.3% (4,876) |
Number of families with income $30k - 40k:| Lompoc Valley: | 7.1% (24) |
| State: | 8.8% (9,994) |
Number of families with income $40k - 50k:| Lompoc Valley: | 13.9% (48) |
| California: | 7.8% (8,776) |
Number of families with income $50k - 60k:| Lompoc Valley: | 7.0% (24) |
| State: | 6.9% (7,834) |
Number of families with income $60k - 75k:| Lompoc Valley: | 3.3% (11) |
| State: | 9.1% (10,247) |
Number of families with income $75k - 100k:| Lompoc Valley: | 13.1% (45) |
| State: | 14.8% (16,731) |
Number of families with income $100k - 125k:| Lompoc Valley: | 7.7% (27) |
| State: | 12.0% (13,609) |
Number of families with income > $200k:| Lompoc Valley: | 37.2% (129) |
| State: | 10.1% (11,409) |
Median non-family income in Lompoc Valley in 2022:| Lompoc Valley: | $31,008 |
| State: | $51,296 |
Change in median non-family income between 2000 and 2022:| Lompoc Valley, California: | +65.4% |
| California: | +114.0% |
Median per capita income in Lompoc Valley in 2022:| Lompoc Valley: | $28,636 |
| State: | $30,289 |
Change in median per capita income between 2000 and 2022:| Lompoc Valley, California: | +104.0% |
| State: | +98.9% |
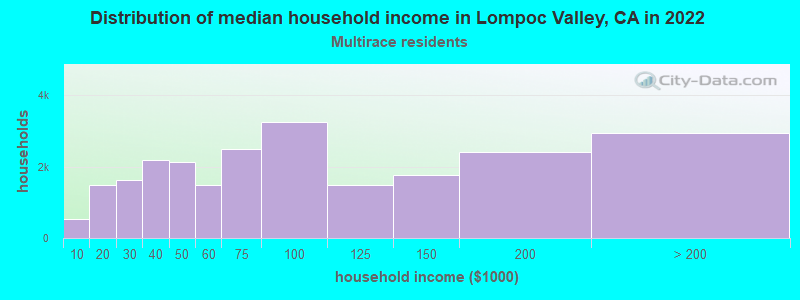
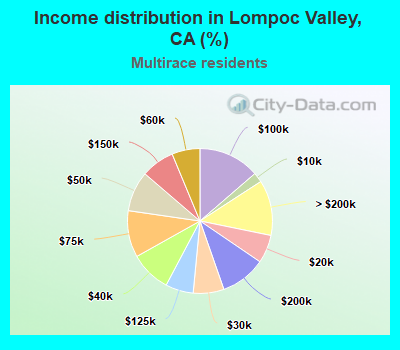
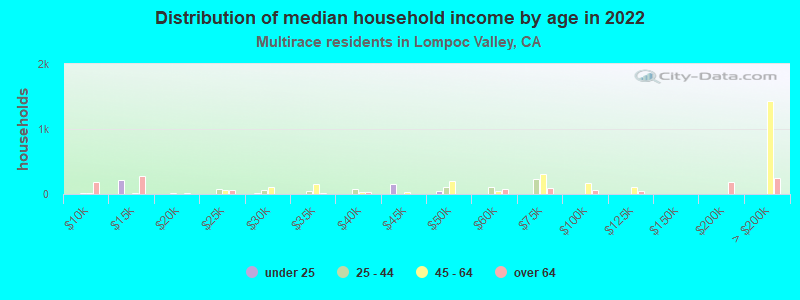
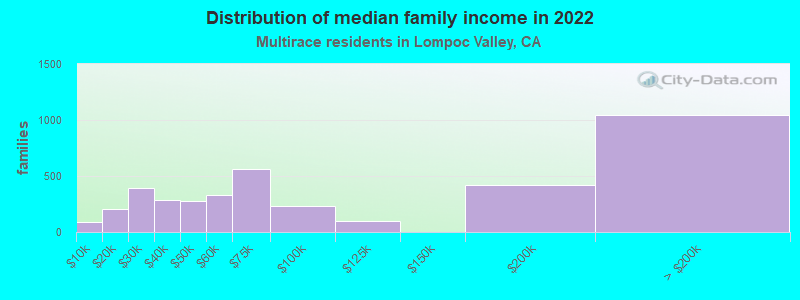
Income statistics for Multirace residents
Median household income in Lompoc Valley, CA in 2022:| Lompoc Valley: | $64,806 |
| State: | $83,153 |
Change in median household income between 2000 and 2022:| Lompoc Valley, California: | +98.4% |
| California: | +106.0% |
Number of households with income < $10k:| Lompoc Valley: | 2.2% (522) |
| California: | 4.2% (85,299) |
Number of households with income $10k - 20k:| Lompoc Valley: | 6.3% (1,498) |
| State: | 6.1% (122,966) |
Number of households with income $20k - 30k:| Lompoc Valley: | 6.9% (1,632) |
| State: | 6.4% (129,328) |
Number of households with income $30k - 40k:| Lompoc Valley: | 9.1% (2,172) |
| State: | 6.4% (130,070) |
Number of households with income $40k - 50k:| Lompoc Valley: | 9.0% (2,140) |
| California: | 6.5% (131,254) |
Number of households with income $50k - 60k:| Lompoc Valley: | 6.3% (1,488) |
| State: | 6.5% (132,382) |
Number of households with income $60k - 75k:| Lompoc Valley: | 10.4% (2,481) |
| State: | 9.4% (191,472) |
Number of households with income $75k - 100k:| Lompoc Valley: | 13.7% (3,250) |
| State: | 13.3% (269,691) |
Number of households with income $100k - 125k:| Lompoc Valley: | 6.2% (1,482) |
| State: | 10.2% (207,286) |
Number of households with income $125k - 150k:| Lompoc Valley: | 7.4% (1,772) |
| State: | 7.8% (158,259) |
Number of households with income $150k - 200k:| Lompoc Valley: | 10.1% (2,413) |
| State: | 10.3% (209,227) |
Number of households with income > $200k:| Lompoc Valley: | 12.4% (2,941) |
| State: | 13.0% (263,210) |
Aggregate household income in Lompoc Valley in 2022: $592,313,280
Median family income in Lompoc Valley in 2022:| Lompoc Valley: | $73,279 |
| State: | $87,642 |
Number of families with income < $10k:| Lompoc Valley: | 2.2% (88) |
| State: | 3.2% (48,017) |
Number of families with income $10k - 20k:| Lompoc Valley: | 5.3% (209) |
| State: | 4.1% (60,419) |
Number of families with income $20k - 30k:| Lompoc Valley: | 10.1% (397) |
| State: | 6.1% (89,742) |
Number of families with income $30k - 40k:| Lompoc Valley: | 7.2% (283) |
| State: | 6.2% (91,415) |
Number of families with income $40k - 50k:| Lompoc Valley: | 7.0% (276) |
| State: | 6.8% (100,085) |
Number of families with income $50k - 60k:| Lompoc Valley: | 8.5% (334) |
| California: | 6.7% (98,298) |
Number of families with income $60k - 75k:| Lompoc Valley: | 14.2% (559) |
| State: | 9.5% (140,131) |
Number of families with income $75k - 100k:| Lompoc Valley: | 5.8% (230) |
| California: | 13.8% (203,439) |
Number of families with income $100k - 125k:| Lompoc Valley: | 2.4% (94) |
| State: | 10.4% (153,515) |
Number of families with income $150k - 200k:| Lompoc Valley: | 10.6% (419) |
| State: | 10.9% (161,643) |
Number of families with income > $200k:| Lompoc Valley: | 26.6% (1,045) |
| State: | 14.0% (207,317) |
Median non-family income in Lompoc Valley in 2022:| Lompoc Valley: | $37,824 |
| California: | $56,558 |
Change in median non-family income between 2000 and 2022:| Lompoc Valley, California: | +122.2% |
| State: | +100.2% |
Median per capita income in Lompoc Valley in 2022:| Lompoc Valley: | $24,515 |
| State: | $32,124 |
Change in median per capita income between 2000 and 2022:| Lompoc Valley, California: | +99.3% |
| California: | +120.4% |
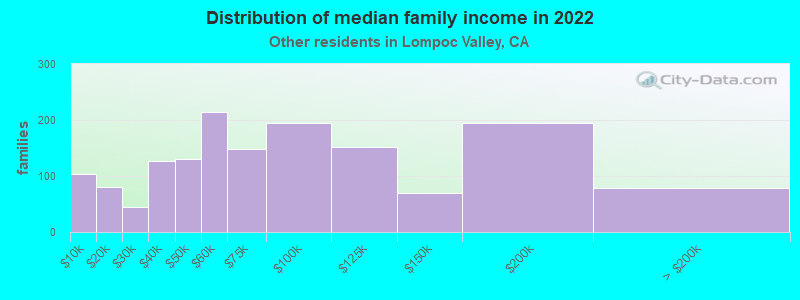
Income statistics for other residents
Number of households with income < $10k:| Lompoc Valley: | 6.9% (146) |
| State: | 4.6% (93,035) |
Number of households with income $10k - 20k:| Lompoc Valley: | 5.3% (112) |
| California: | 6.3% (126,222) |
Number of households with income $20k - 30k:| Lompoc Valley: | 2.5% (52) |
| State: | 7.1% (142,656) |
Number of households with income $30k - 40k:| Lompoc Valley: | 6.4% (136) |
| State: | 8.2% (165,018) |
Number of households with income $40k - 50k:| Lompoc Valley: | 6.4% (135) |
| California: | 8.0% (161,732) |
Number of households with income $50k - 60k:| Lompoc Valley: | 9.2% (194) |
| California: | 7.6% (152,152) |
Number of households with income $60k - 75k:| Lompoc Valley: | 6.2% (130) |
| California: | 10.4% (209,951) |
Number of households with income $75k - 100k:| Lompoc Valley: | 12.2% (257) |
| California: | 14.7% (296,102) |
Number of households with income $100k - 125k:| Lompoc Valley: | 11.1% (235) |
| State: | 10.7% (214,281) |
Number of households with income $125k - 150k:| Lompoc Valley: | 10.4% (219) |
| State: | 7.1% (143,092) |
Number of households with income $150k - 200k:| Lompoc Valley: | 10.7% (226) |
| California: | 8.6% (172,215) |
Number of households with income > $200k:| Lompoc Valley: | 12.7% (269) |
| State: | 6.7% (134,102) |
Aggregate household income in Lompoc Valley in 2022: $224,792,062
Median family income in Lompoc Valley in 2022:| Lompoc Valley: | $88,405 |
| State: | $72,756 |
Number of families with income < $10k:| Lompoc Valley: | 6.8% (104) |
| State: | 4.3% (69,090) |
Number of families with income $10k - 20k:| Lompoc Valley: | 5.3% (81) |
| State: | 5.1% (82,116) |
Number of families with income $20k - 30k:| Lompoc Valley: | 2.9% (45) |
| California: | 7.0% (112,854) |
Number of families with income $30k - 40k:| Lompoc Valley: | 8.3% (127) |
| State: | 8.4% (135,938) |
Number of families with income $40k - 50k:| Lompoc Valley: | 8.5% (131) |
| State: | 8.4% (135,353) |
Number of families with income $50k - 60k:| Lompoc Valley: | 14.0% (215) |
| State: | 7.7% (124,826) |
Number of families with income $60k - 75k:| Lompoc Valley: | 9.6% (148) |
| California: | 10.7% (173,628) |
Number of families with income $75k - 100k:| Lompoc Valley: | 12.6% (194) |
| State: | 15.2% (245,724) |
Number of families with income $100k - 125k:| Lompoc Valley: | 9.8% (151) |
| California: | 10.9% (176,716) |
Number of families with income $125k - 150k:| Lompoc Valley: | 4.5% (69) |
| State: | 7.4% (119,985) |
Number of families with income $150k - 200k:| Lompoc Valley: | 12.7% (195) |
| State: | 8.5% (137,332) |
Number of families with income > $200k:| Lompoc Valley: | 5.1% (79) |
| State: | 6.6% (106,346) |
Median non-family income in Lompoc Valley in 2022:| Lompoc Valley: | $65,347 |
| California: | $43,881 |
Median per capita income in Lompoc Valley in 2022:| Lompoc Valley: | $27,763 |
| State: | $25,164 |