The median household income in Lytle Creek, CA in 2022 was $57,826, which was 58.3% less than the median annual income of $91,551 across the entire state of California. Compared to the median income of $42,066 in 2000 this represents an increase of 27.3%. The per capita income in 2022 was $34,797, which means an increase of 51.6% compared to 2000 when it was $16,856.
Whole page based on the data from 2000 / 2022 when the population of Lytle Creek, California was 701 / 531
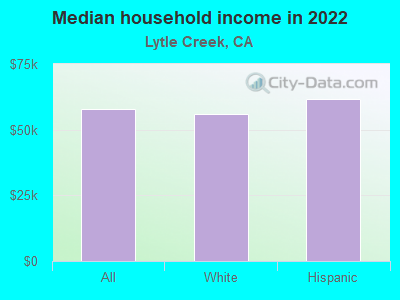
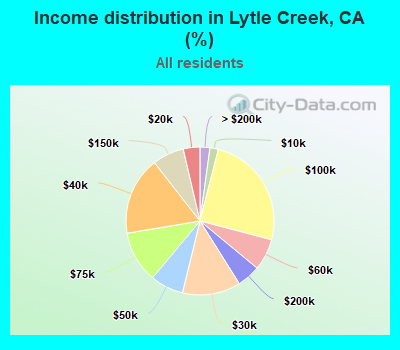
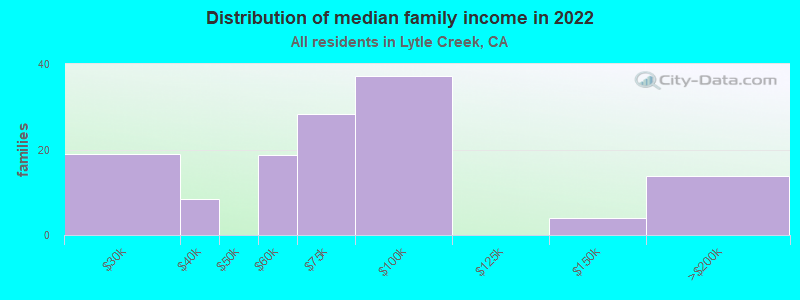
Income statistics for all residents
Median household income in Lytle Creek, CA in 2022:
Lytle Creek:
$57,827
State:
$91,551
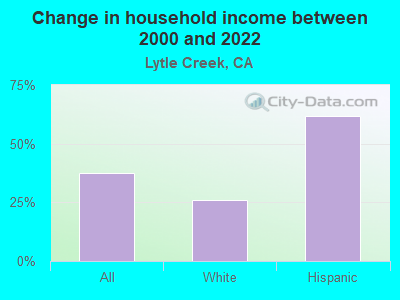
Change in median household income between 2000 and 2022:
Lytle Creek, California:
+37.5%
California:
+92.8%
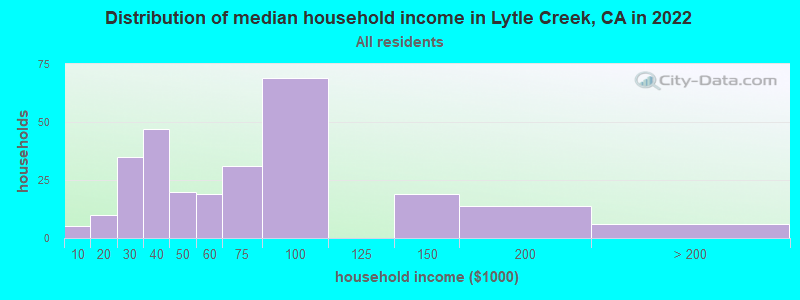
Number of households with income < $10k:
Lytle Creek:
1.8% (5)
California:
4.8% (654,370)
Number of households with income $10k - 20k:
Lytle Creek:
3.6% (10)
State:
5.8% (789,493)
Number of households with income $20k - 30k:
Lytle Creek:
12.7% (35)
State:
5.7% (778,318)
Number of households with income $30k - 40k:
Lytle Creek:
17.1% (47)
State:
5.8% (783,170)
Number of households with income $40k - 50k:
Lytle Creek:
7.3% (20)
California:
5.8% (781,352)
Number of households with income $50k - 60k:
Lytle Creek:
6.9% (19)
State:
5.6% (760,175)
Number of households with income $60k - 75k:
Lytle Creek:
11.3% (31)
State:
8.2% (1,104,699)
Number of households with income $75k - 100k:
Lytle Creek:
25.1% (69)
California:
12.0% (1,627,633)
Number of households with income $100k - 125k:
Lytle Creek:
0.0% (0)
State:
10.0% (1,358,619)
Number of households with income $125k - 150k:
Lytle Creek:
6.9% (19)
California:
7.6% (1,027,455)
Number of households with income $150k - 200k:
Lytle Creek:
5.1% (14)
California:
10.6% (1,439,811)
Number of households with income > $200k:
Lytle Creek:
2.2% (6)
State:
18.0% (2,445,491)
Aggregate household income in Lytle Creek in 2022: $18,434,589
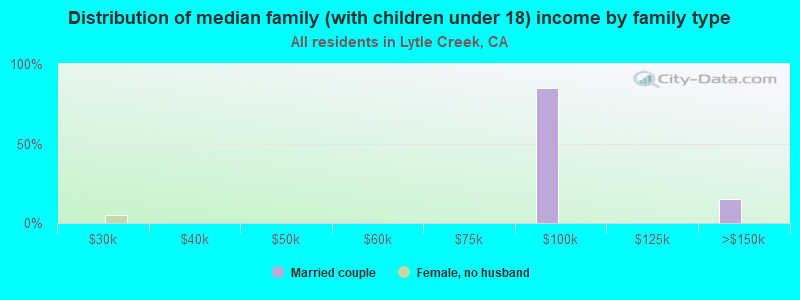
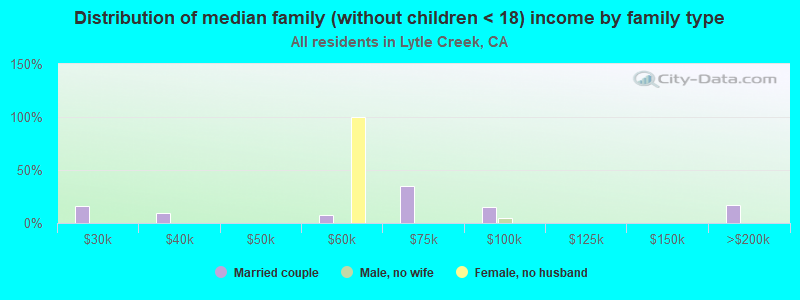
Median family income in Lytle Creek in 2022:
Lytle Creek:
$62,826
State:
$104,823
Number of families with income $20k - 30k:
Lytle Creek:
14.7% (19)
California:
4.7% (433,722)
Number of families with income $30k - 40k:
Lytle Creek:
6.5% (8)
State:
5.2% (478,213)
Number of families with income $50k - 60k:
Lytle Creek:
14.4% (19)
California:
5.5% (498,926)
Number of families with income $60k - 75k:
Lytle Creek:
21.9% (28)
State:
8.0% (731,094)
Number of families with income $75k - 100k:
Lytle Creek:
28.7% (37)
State:
12.2% (1,115,621)
Number of families with income $125k - 150k:
Lytle Creek:
3.1% (4)
State:
8.4% (768,725)
Number of families with income $150k - 200k:
Lytle Creek:
10.6% (14)
State:
11.9% (1,087,239)
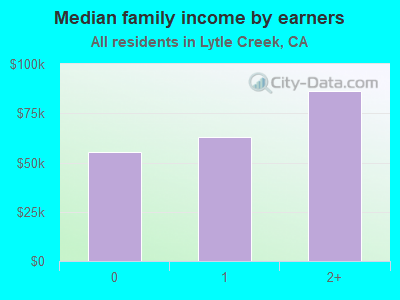
Median income for 2 person families:
Lytle Creek:
$58,987
State:
$92,781
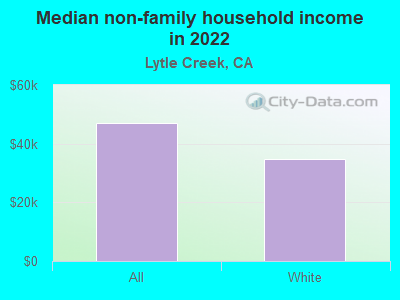
Median non-family income in Lytle Creek in 2022:
Lytle Creek:
$46,956
California:
$59,348
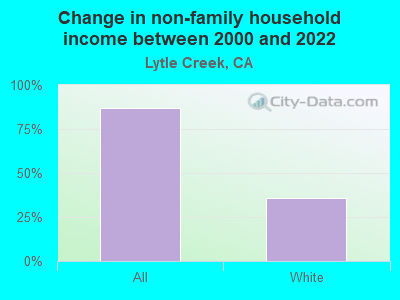
Change in median non-family income between 2000 and 2022:
Lytle Creek, California:
+86.7%
State:
+85.3%
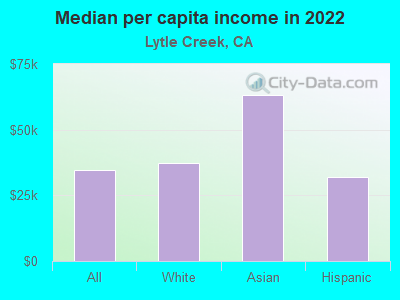
Median per capita income in Lytle Creek in 2022:
Lytle Creek:
$34,798
State:
$46,661
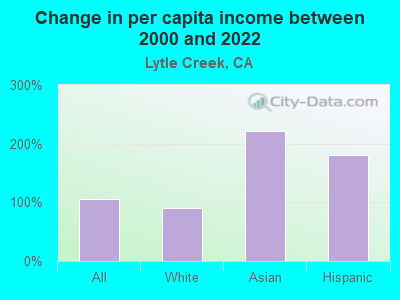
Change in median per capita income between 2000 and 2022:
Lytle Creek, California:
+106.4%
State:
+105.5%
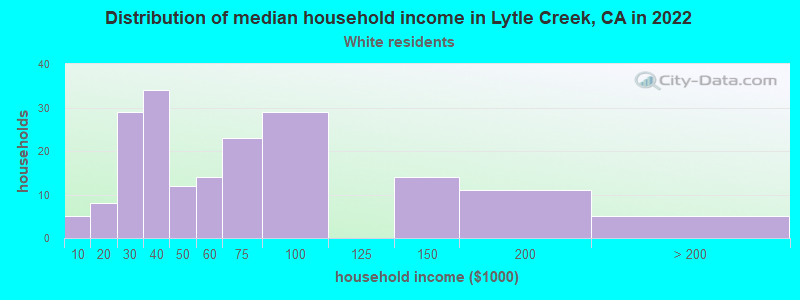
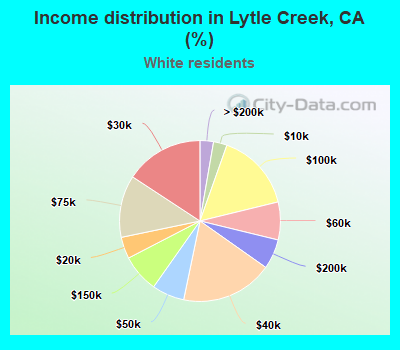
Income statistics for White residents
Median household income in Lytle Creek, CA in 2022:
Lytle Creek:
$55,987
State:
$100,917
Change in median household income between 2000 and 2022:
Lytle Creek, California:
+25.9%
California:
+96.8%
Number of households with income < $10k:
Lytle Creek:
2.7% (5)
California:
4.4% (284,109)
Number of households with income $10k - 20k:
Lytle Creek:
4.3% (8)
State:
5.3% (340,330)
Number of households with income $20k - 30k:
Lytle Creek:
15.8% (29)
California:
5.3% (343,145)
Number of households with income $30k - 40k:
Lytle Creek:
18.5% (34)
State:
5.1% (330,146)
Number of households with income $40k - 50k:
Lytle Creek:
6.5% (12)
State:
5.2% (335,310)
Number of households with income $50k - 60k:
Lytle Creek:
7.6% (14)
State:
5.1% (326,299)
Number of households with income $60k - 75k:
Lytle Creek:
12.5% (23)
State:
7.6% (487,640)
Number of households with income $75k - 100k:
Lytle Creek:
15.8% (29)
California:
11.5% (736,578)
Number of households with income $100k - 125k:
Lytle Creek:
0.0% (0)
State:
10.1% (648,782)
Number of households with income $125k - 150k:
Lytle Creek:
7.6% (14)
State:
7.8% (499,671)
Number of households with income $150k - 200k:
Lytle Creek:
6.0% (11)
State:
11.4% (729,603)
Number of households with income > $200k:
Lytle Creek:
2.7% (5)
State:
21.2% (1,364,246)
Aggregate household income in Lytle Creek in 2022: $12,806,635
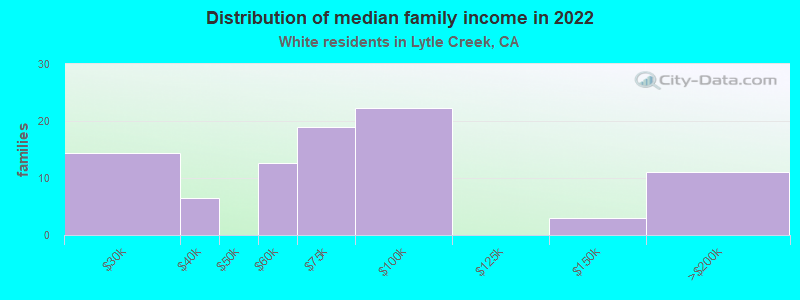
Median family income in Lytle Creek in 2022:
Lytle Creek:
$67,073
State:
$125,379
Number of families with income $20k - 30k:
Lytle Creek:
16.2% (14)
State:
3.5% (137,295)
Number of families with income $30k - 40k:
Lytle Creek:
7.3% (7)
State:
3.9% (152,947)
Number of families with income $50k - 60k:
Lytle Creek:
14.3% (13)
State:
4.5% (176,192)
Number of families with income $60k - 75k:
Lytle Creek:
21.4% (19)
State:
7.0% (274,752)
Number of families with income $75k - 100k:
Lytle Creek:
25.1% (22)
State:
11.3% (445,632)
Number of families with income $125k - 150k:
Lytle Creek:
3.3% (3)
State:
9.1% (357,408)
Number of families with income $150k - 200k:
Lytle Creek:
12.5% (11)
State:
13.5% (532,693)
Median non-family income in Lytle Creek in 2022:
Lytle Creek:
$34,701
State:
$62,819
Change in median non-family income between 2000 and 2022:
Lytle Creek, California:
+35.8%
State:
+84.4%
Median per capita income in Lytle Creek in 2022:
Lytle Creek:
$37,398
State:
$61,706
Change in median per capita income between 2000 and 2022:
Lytle Creek, California:
+90.3%
State:
+122.7%
Income statistics for Asian residents
Number of households with income < $10k:
Lytle Creek:
0.0% (0)
California:
5.1% (106,273)
Number of households with income $10k - 20k:
Lytle Creek:
0.0% (0)
State:
4.9% (101,815)
Number of households with income $20k - 30k:
Lytle Creek:
0.0% (0)
State:
4.6% (94,414)
Number of households with income $30k - 40k:
Lytle Creek:
0.0% (0)
California:
4.1% (84,491)
Number of households with income $40k - 50k:
Lytle Creek:
0.0% (0)
State:
4.0% (81,758)
Number of households with income $50k - 60k:
Lytle Creek:
0.0% (0)
State:
3.9% (80,971)
Number of households with income $60k - 75k:
Lytle Creek:
0.0% (0)
California:
6.0% (124,194)
Number of households with income $75k - 100k:
Lytle Creek:
100.0% (35)
State:
9.7% (200,337)
Number of households with income $100k - 125k:
Lytle Creek:
0.0% (0)
State:
9.4% (193,488)
Number of households with income $125k - 150k:
Lytle Creek:
0.0% (0)
California:
7.7% (158,253)
Number of households with income $150k - 200k:
Lytle Creek:
0.0% (0)
State:
12.2% (252,139)
Number of households with income > $200k:
Lytle Creek:
0.0% (0)
California:
28.4% (586,641)
Aggregate household income in Lytle Creek in 2022: $7,209,612,900
Median per capita income in Lytle Creek in 2022:
Lytle Creek:
$63,050
California:
$58,824
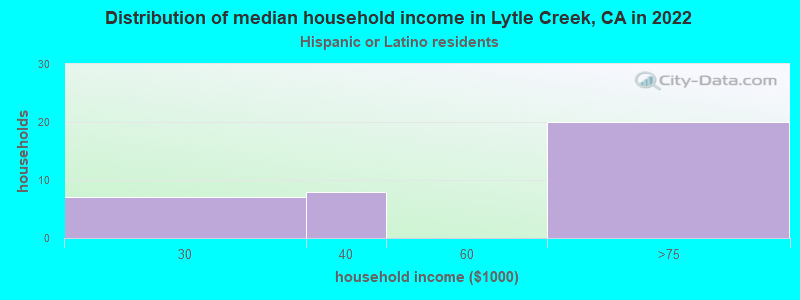
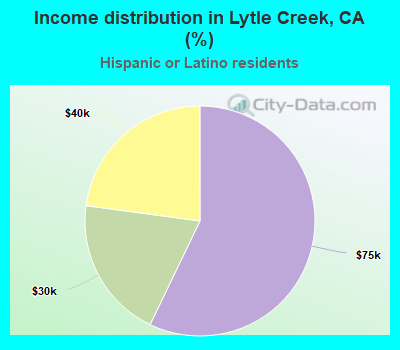
Income statistics for Hispanic or Latino residents
Median household income in Lytle Creek, CA in 2022:
Lytle Creek:
$61,522
California:
$75,698
Change in median household income between 2000 and 2022:
Lytle Creek, California:
+61.6%
State:
+107.2%
Number of households with income < $10k:
Lytle Creek:
0.0% (0)
State:
4.3% (183,294)
Number of households with income $10k - 20k:
Lytle Creek:
0.0% (0)
State:
6.0% (253,903)
Number of households with income $20k - 30k:
Lytle Creek:
20.0% (7)
State:
6.8% (286,386)
Number of households with income $30k - 40k:
Lytle Creek:
22.9% (8)
State:
7.4% (313,728)
Number of households with income $40k - 50k:
Lytle Creek:
0.0% (0)
State:
7.4% (313,199)
Number of households with income $50k - 60k:
Lytle Creek:
0.0% (0)
State:
7.2% (305,366)
Number of households with income $60k - 75k:
Lytle Creek:
57.1% (20)
State:
10.3% (434,937)
Number of households with income $75k - 100k:
Lytle Creek:
0.0% (0)
State:
14.4% (607,302)
Number of households with income $100k - 125k:
Lytle Creek:
0.0% (0)
State:
10.6% (447,424)
Number of households with income $125k - 150k:
Lytle Creek:
0.0% (0)
State:
7.5% (316,022)
Number of households with income $150k - 200k:
Lytle Creek:
0.0% (0)
California:
9.2% (386,269)
Number of households with income > $200k:
Lytle Creek:
0.0% (0)
California:
8.8% (372,651)
Aggregate household income in Lytle Creek in 2022: $1,710,310
Median per capita income in Lytle Creek in 2022:
Lytle Creek:
$31,925
California:
$27,240
Discuss Lytle Creek, California (CA) on our hugely popular California forum.