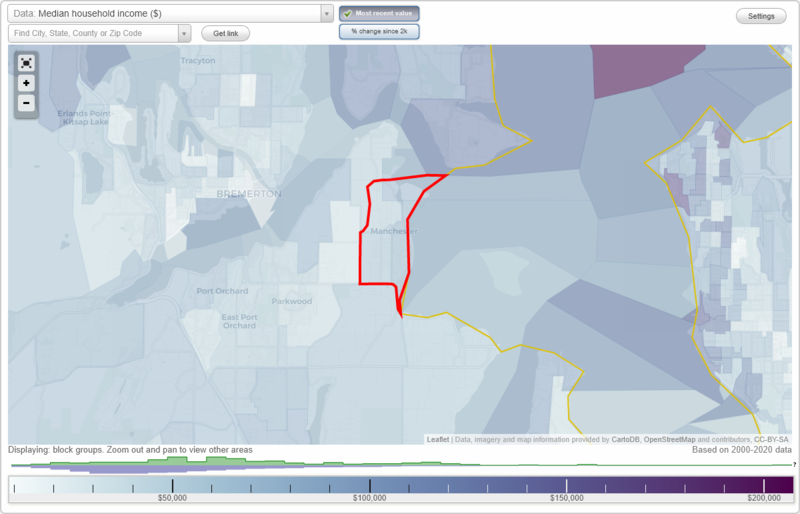
The median household income in Manchester, WA in 2022 was $101,106, which was 9.7% greater than the median annual income of $91,306 across the entire state of Washington. Compared to the median income of $52,213 in 2000 this represents an increase of 48.4%. The per capita income in 2022 was $42,721, which means an increase of 48.6% compared to 2000 when it was $21,946.
Whole page based on the data from 2000 / 2022 when the population of Manchester, Washington was 4,958 / 6,083
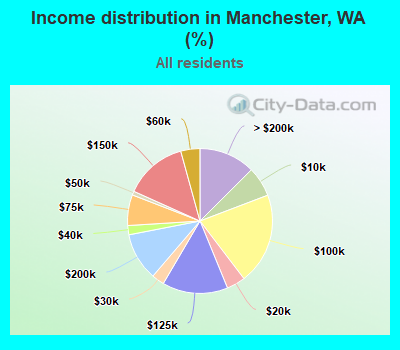
Income statistics for all residents
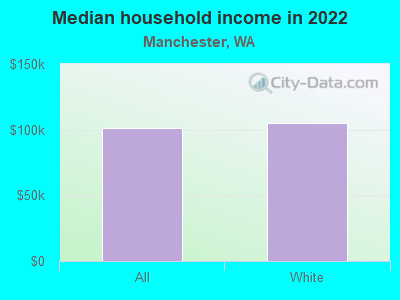
Median household income in Manchester, WA in 2022:
Manchester:
$101,106
Washington:
$91,306
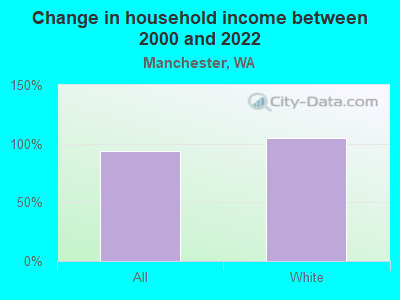
Change in median household income between 2000 and 2022:
Manchester, Washington:
+93.6%
Washington:
+99.5%
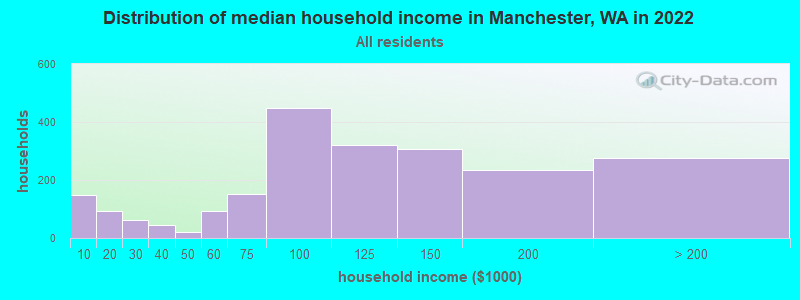
Number of households with income < $10k:
Manchester:
6.7% (147)
State:
4.5% (139,331)
Number of households with income $10k - 20k:
Manchester:
4.2% (92)
Washington:
5.0% (154,508)
Number of households with income $20k - 30k:
Manchester:
2.8% (62)
State:
5.4% (166,555)
Number of households with income $30k - 40k:
Manchester:
2.0% (45)
State:
5.5% (170,324)
Number of households with income $40k - 50k:
Manchester:
0.9% (19)
State:
6.0% (183,941)
Number of households with income $50k - 60k:
Manchester:
4.3% (94)
Washington:
6.1% (187,395)
Number of households with income $60k - 75k:
Manchester:
6.9% (151)
State:
8.7% (266,771)
Number of households with income $75k - 100k:
Manchester:
20.4% (449)
Washington:
13.1% (404,672)
Number of households with income $100k - 125k:
Manchester:
14.6% (322)
State:
11.0% (337,911)
Number of households with income $125k - 150k:
Manchester:
14.0% (308)
Washington:
8.0% (244,934)
Number of households with income $150k - 200k:
Manchester:
10.7% (235)
Washington:
10.5% (323,812)
Number of households with income > $200k:
Manchester:
12.5% (276)
State:
16.2% (499,799)
Aggregate household income in Manchester in 2022: $256,431,605
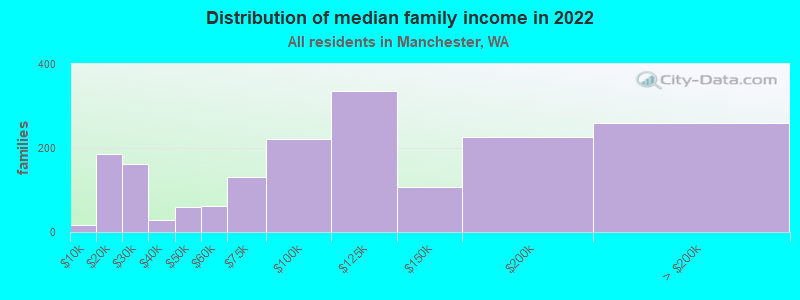
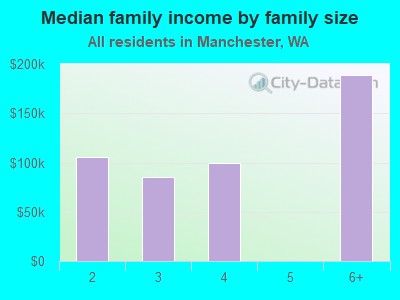
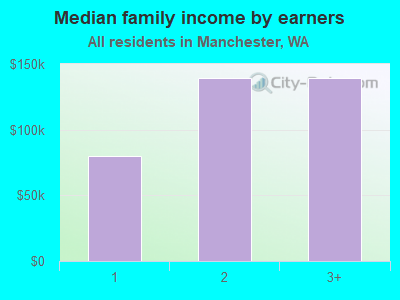
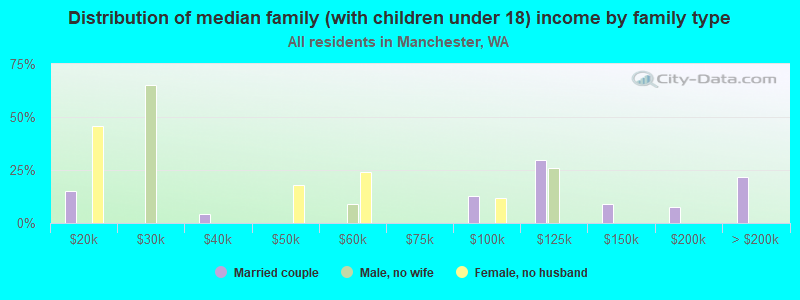
Median family income in Manchester in 2022:
Manchester:
$102,144
State:
$109,192
Number of families with income < $10k:
Manchester:
0.9% (17)
State:
2.9% (55,953)
Number of families with income $10k - 20k:
Manchester:
10.4% (186)
State:
2.6% (50,138)
Number of families with income $20k - 30k:
Manchester:
9.0% (162)
State:
3.2% (61,974)
Number of families with income $30k - 40k:
Manchester:
1.6% (28)
Washington:
4.1% (80,240)
Number of families with income $40k - 50k:
Manchester:
3.3% (59)
State:
4.9% (94,310)
Number of families with income $50k - 60k:
Manchester:
3.5% (62)
Washington:
5.3% (101,674)
Number of families with income $60k - 75k:
Manchester:
7.4% (132)
Washington:
8.2% (158,348)
Number of families with income $75k - 100k:
Manchester:
12.4% (222)
State:
13.8% (267,812)
Number of families with income $100k - 125k:
Manchester:
18.7% (335)
State:
12.4% (240,213)
Number of families with income $125k - 150k:
Manchester:
5.9% (107)
Washington:
9.3% (180,011)
Number of families with income $150k - 200k:
Manchester:
12.6% (226)
State:
13.0% (250,874)
Number of families with income > $200k:
Manchester:
14.4% (259)
Washington:
20.4% (393,898)
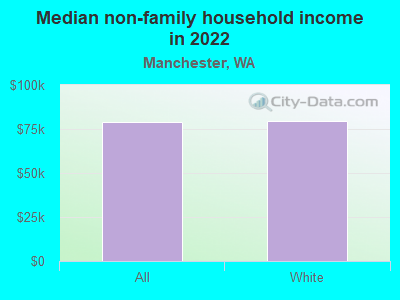
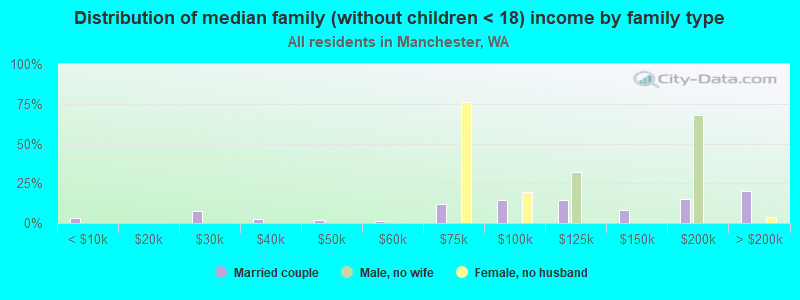
Median non-family income in Manchester in 2022:
Manchester:
$78,897
State:
$57,299
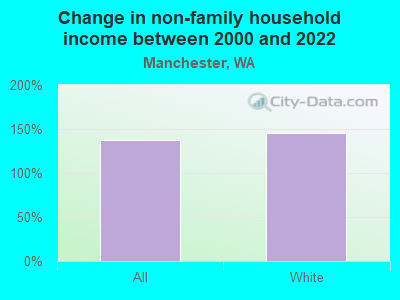
Change in median non-family income between 2000 and 2022:
Manchester, Washington:
+137.9%
Washington:
+94.9%
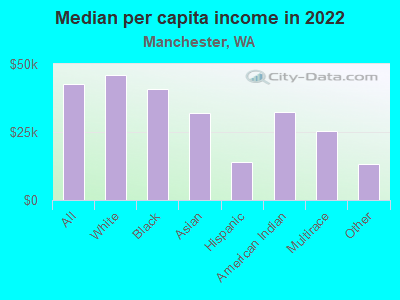
Median per capita income in Manchester in 2022:
Manchester:
$42,721
State:
$50,764
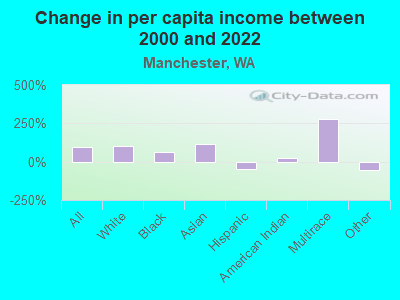
Change in median per capita income between 2000 and 2022:
Manchester, Washington:
+94.7%
State:
+121.0%
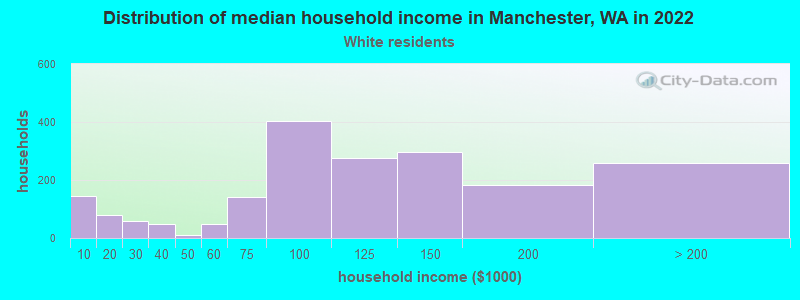
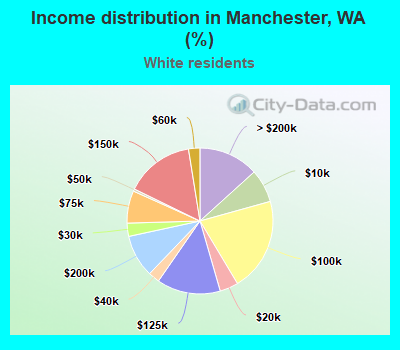
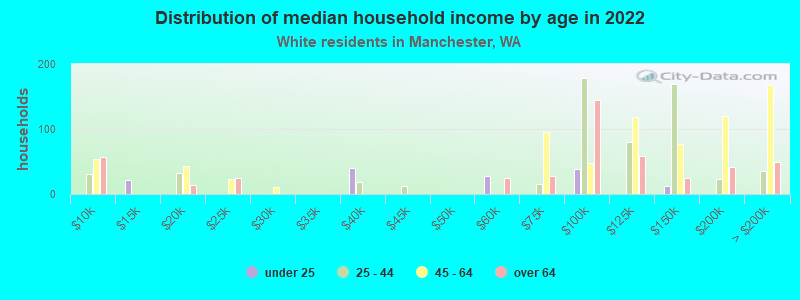
Income statistics for White residents
Median household income in Manchester, WA in 2022:
Manchester:
$105,132
Washington:
$91,916
Change in median household income between 2000 and 2022:
Manchester, Washington:
+104.6%
State:
+95.4%
Number of households with income < $10k:
Manchester:
7.4% (144)
Washington:
4.3% (95,850)
Number of households with income $10k - 20k:
Manchester:
4.1% (80)
Washington:
4.8% (106,421)
Number of households with income $20k - 30k:
Manchester:
2.9% (57)
State:
5.5% (122,860)
Number of households with income $30k - 40k:
Manchester:
2.5% (49)
State:
5.4% (119,627)
Number of households with income $40k - 50k:
Manchester:
0.5% (10)
State:
5.9% (132,276)
Number of households with income $50k - 60k:
Manchester:
2.5% (49)
State:
6.1% (136,212)
Number of households with income $60k - 75k:
Manchester:
7.2% (140)
State:
8.8% (196,086)
Number of households with income $75k - 100k:
Manchester:
20.7% (404)
State:
13.4% (299,192)
Number of households with income $100k - 125k:
Manchester:
14.1% (275)
State:
11.3% (252,209)
Number of households with income $125k - 150k:
Manchester:
15.2% (297)
Washington:
7.9% (175,962)
Number of households with income $150k - 200k:
Manchester:
9.4% (184)
Washington:
10.7% (239,156)
Number of households with income > $200k:
Manchester:
13.3% (259)
State:
16.1% (359,917)
Aggregate household income in Manchester in 2022: $225,528,435
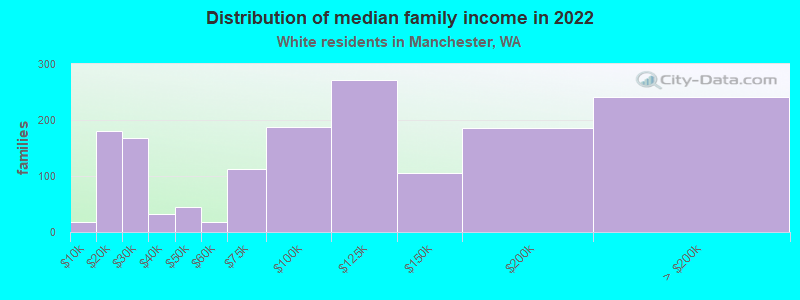
Median family income in Manchester in 2022:
Manchester:
$102,970
State:
$112,511
Number of families with income < $10k:
Manchester:
1.1% (17)
State:
2.4% (33,676)
Number of families with income $10k - 20k:
Manchester:
11.5% (180)
State:
2.0% (28,228)
Number of families with income $20k - 30k:
Manchester:
10.7% (167)
Washington:
2.9% (39,288)
Number of families with income $30k - 40k:
Manchester:
2.1% (33)
State:
3.6% (50,190)
Number of families with income $40k - 50k:
Manchester:
2.8% (44)
Washington:
4.6% (63,009)
Number of families with income $50k - 60k:
Manchester:
1.2% (18)
Washington:
5.0% (69,270)
Number of families with income $60k - 75k:
Manchester:
7.2% (112)
State:
8.2% (112,369)
Number of families with income $75k - 100k:
Manchester:
12.0% (187)
Washington:
14.1% (194,214)
Number of families with income $100k - 125k:
Manchester:
17.3% (271)
Washington:
13.2% (182,184)
Number of families with income $125k - 150k:
Manchester:
6.8% (105)
Washington:
9.5% (130,928)
Number of families with income $150k - 200k:
Manchester:
11.9% (186)
State:
13.7% (188,621)
Number of families with income > $200k:
Manchester:
15.4% (241)
State:
20.8% (285,982)
Median non-family income in Manchester in 2022:
Manchester:
$79,826
State:
$56,103
Change in median non-family income between 2000 and 2022:
Manchester, Washington:
+145.8%
Washington:
+87.7%
Median per capita income in Manchester in 2022:
Manchester:
$46,009
State:
$55,212
Change in median per capita income between 2000 and 2022:
Manchester, Washington:
+101.5%
Washington:
+123.8%
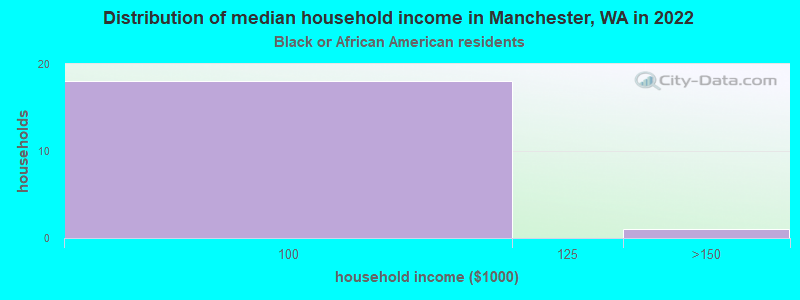
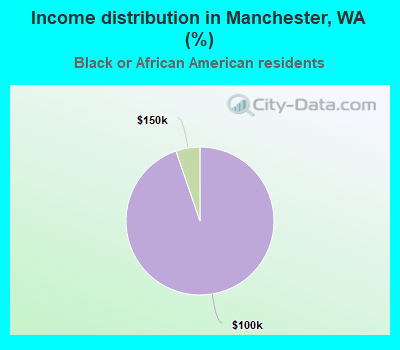
Income statistics for Black or African American residents
Number of households with income < $10k:
Manchester:
0.0% (0)
State:
7.2% (8,014)
Number of households with income $10k - 20k:
Manchester:
0.0% (0)
State:
8.0% (8,904)
Number of households with income $20k - 30k:
Manchester:
0.0% (0)
State:
7.4% (8,207)
Number of households with income $30k - 40k:
Manchester:
0.0% (0)
State:
5.6% (6,220)
Number of households with income $40k - 50k:
Manchester:
0.0% (0)
Washington:
9.5% (10,585)
Number of households with income $50k - 60k:
Manchester:
0.0% (0)
State:
7.3% (8,078)
Number of households with income $60k - 75k:
Manchester:
0.0% (0)
State:
8.7% (9,704)
Number of households with income $75k - 100k:
Manchester:
94.7% (18)
State:
12.9% (14,315)
Number of households with income $100k - 125k:
Manchester:
0.0% (0)
State:
7.7% (8,592)
Number of households with income $125k - 150k:
Manchester:
5.3% (1)
State:
8.9% (9,840)
Number of households with income $150k - 200k:
Manchester:
0.0% (0)
State:
7.6% (8,434)
Number of households with income > $200k:
Manchester:
0.0% (0)
State:
9.1% (10,075)
Aggregate household income in Manchester in 2022: $6,908,285
Median per capita income in Manchester in 2022:
Manchester:
$40,783
Washington:
$38,209
Change in median per capita income between 2000 and 2022:
Manchester, Washington:
+66.4%
Washington:
+115.3%
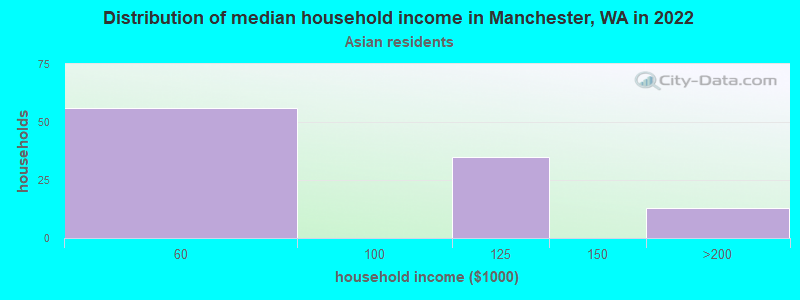
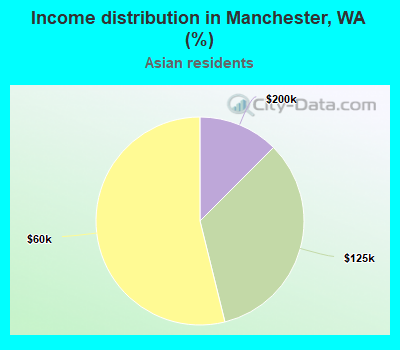
Income statistics for Asian residents
Number of households with income < $10k:
Manchester:
0.0% (0)
State:
4.9% (14,099)
Number of households with income $10k - 20k:
Manchester:
0.0% (0)
Washington:
3.5% (9,873)
Number of households with income $20k - 30k:
Manchester:
0.0% (0)
State:
2.9% (8,352)
Number of households with income $30k - 40k:
Manchester:
0.0% (0)
State:
4.0% (11,415)
Number of households with income $40k - 50k:
Manchester:
0.0% (0)
State:
4.0% (11,421)
Number of households with income $50k - 60k:
Manchester:
53.8% (56)
State:
4.2% (12,100)
Number of households with income $60k - 75k:
Manchester:
0.0% (0)
State:
6.3% (17,903)
Number of households with income $75k - 100k:
Manchester:
0.0% (0)
State:
10.4% (29,663)
Number of households with income $100k - 125k:
Manchester:
33.7% (35)
State:
9.4% (26,839)
Number of households with income $125k - 150k:
Manchester:
0.0% (0)
Washington:
8.5% (24,200)
Number of households with income $150k - 200k:
Manchester:
12.5% (13)
State:
12.6% (35,976)
Number of households with income > $200k:
Manchester:
0.0% (0)
Washington:
29.2% (83,109)
Aggregate household income in Manchester in 2022: $13,446,029
Median per capita income in Manchester in 2022:
Manchester:
$32,042
State:
$67,666
Change in median per capita income between 2000 and 2022:
Manchester, Washington:
+116.9%
State:
+236.0%
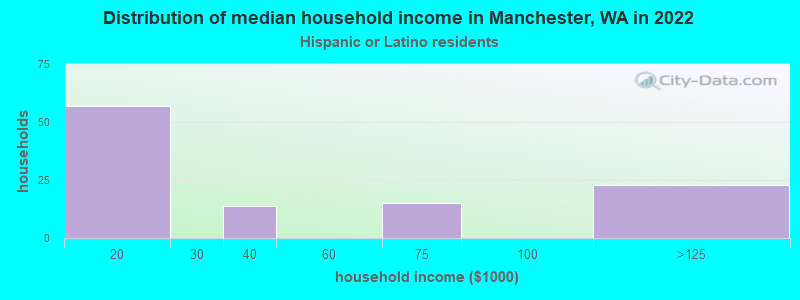
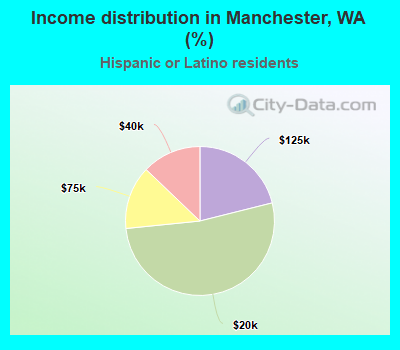
Income statistics for Hispanic or Latino residents
Number of households with income < $10k:
Manchester:
0.0% (0)
Washington:
4.9% (14,456)
Number of households with income $10k - 20k:
Manchester:
52.3% (57)
State:
5.3% (15,449)
Number of households with income $20k - 30k:
Manchester:
0.0% (0)
Washington:
6.8% (20,016)
Number of households with income $30k - 40k:
Manchester:
12.8% (14)
Washington:
7.7% (22,548)
Number of households with income $40k - 50k:
Manchester:
0.0% (0)
State:
7.3% (21,450)
Number of households with income $50k - 60k:
Manchester:
0.0% (0)
State:
7.7% (22,744)
Number of households with income $60k - 75k:
Manchester:
13.8% (15)
State:
10.5% (30,737)
Number of households with income $75k - 100k:
Manchester:
0.0% (0)
State:
14.9% (43,843)
Number of households with income $100k - 125k:
Manchester:
21.1% (23)
Washington:
11.1% (32,554)
Number of households with income $125k - 150k:
Manchester:
0.0% (0)
Washington:
7.4% (21,624)
Number of households with income $150k - 200k:
Manchester:
0.0% (0)
State:
7.3% (21,360)
Number of households with income > $200k:
Manchester:
0.0% (0)
State:
9.2% (27,055)
Aggregate household income in Manchester in 2022: $6,647,305
Median per capita income in Manchester in 2022:
Manchester:
$14,063
State:
$28,252
Change in median per capita income between 2000 and 2022:: -48.9%
Manchester, Washington:
-48.9%
State:
+150.2%
Income statistics for American Indian and Alaska Native residents
Aggregate household income in Manchester in 2022: $3,417,140
Median per capita income in Manchester in 2022:
Manchester:
$32,516
State:
$27,053
Change in median per capita income between 2000 and 2022:
Manchester, Washington:
+27.5%
State:
+98.6%
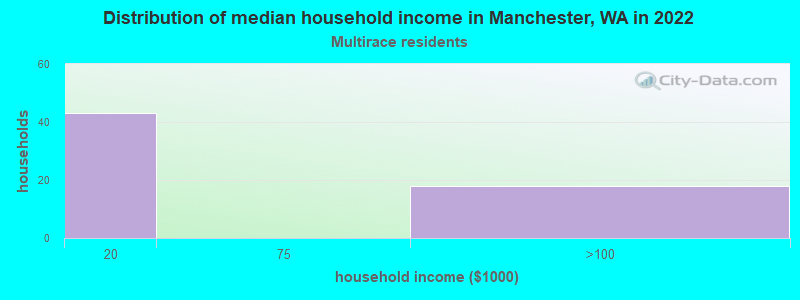
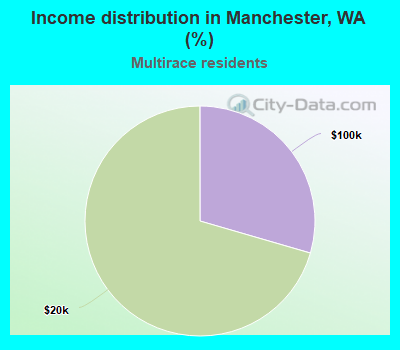
Income statistics for Multirace residents
Number of households with income < $10k:
Manchester:
0.0% (0)
State:
4.3% (12,040)
Number of households with income $10k - 20k:
Manchester:
70.5% (43)
State:
6.6% (18,437)
Number of households with income $20k - 30k:
Manchester:
0.0% (0)
State:
5.2% (14,559)
Number of households with income $30k - 40k:
Manchester:
0.0% (0)
State:
6.7% (18,491)
Number of households with income $40k - 50k:
Manchester:
0.0% (0)
State:
6.3% (17,459)
Number of households with income $50k - 60k:
Manchester:
0.0% (0)
Washington:
6.9% (19,086)
Number of households with income $60k - 75k:
Manchester:
0.0% (0)
Washington:
9.1% (25,310)
Number of households with income $75k - 100k:
Manchester:
29.5% (18)
Washington:
13.5% (37,493)
Number of households with income $100k - 125k:
Manchester:
0.0% (0)
State:
10.7% (29,626)
Number of households with income $125k - 150k:
Manchester:
0.0% (0)
Washington:
8.6% (23,899)
Number of households with income $150k - 200k:
Manchester:
0.0% (0)
State:
10.2% (28,214)
Number of households with income > $200k:
Manchester:
0.0% (0)
State:
11.9% (32,947)
Aggregate household income in Manchester in 2022: $17,075,714
Median per capita income in Manchester in 2022:
Manchester:
$25,219
State:
$32,496
Income statistics for other residents
Aggregate household income in Manchester in 2022: $10,044,045
Median per capita income in Manchester in 2022:
Manchester:
$13,278
State:
$27,542
Change in median per capita income between 2000 and 2022:: -54.4%
Manchester, Washington:
-54.4%
Washington:
+167.8%
Discuss Manchester, Washington (WA) on our hugely popular Washington forum.