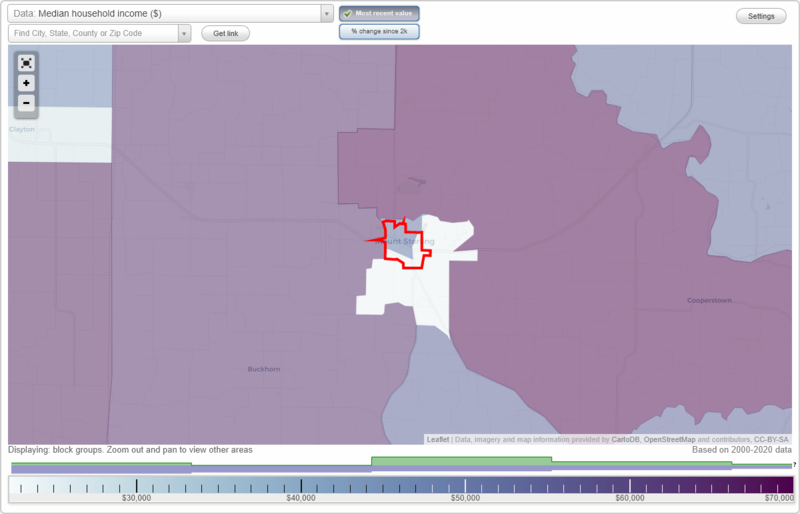
The median household income in Mount Sterling, IL in 2022 was $53,790, which was 42.6% less than the median annual income of $76,708 across the entire state of Illinois. Compared to the median income of $27,434 in 2000 this represents an increase of 49.0%. The per capita income in 2022 was $31,239, which means an increase of 49.6% compared to 2000 when it was $15,755.
Whole page based on the data from 2000 / 2022 when the population of Mount Sterling, Illinois was 2,070 / 2,147
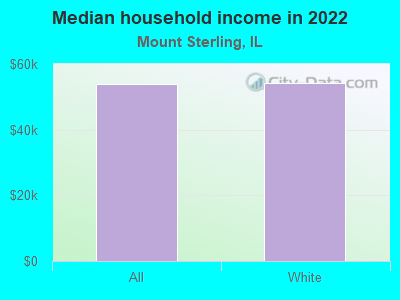
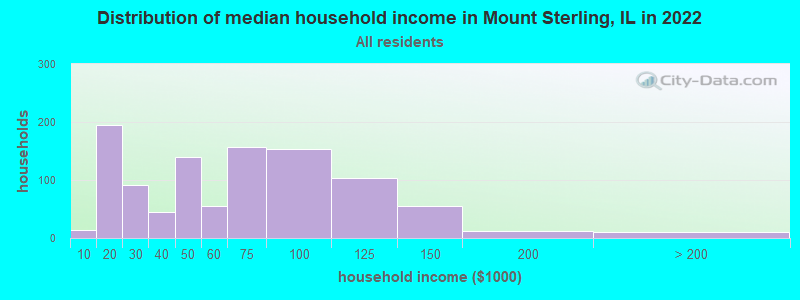
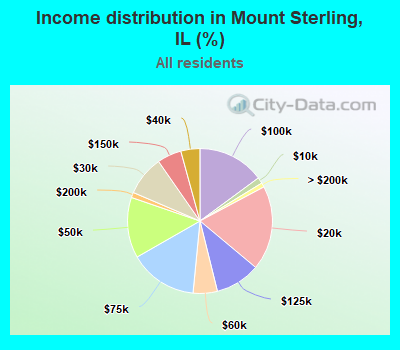
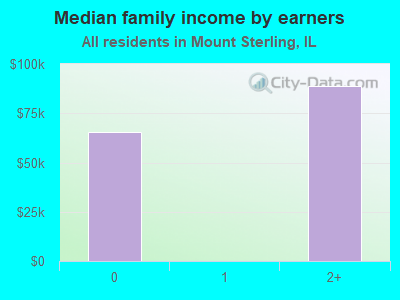
Income statistics for all residents
Median household income in Mount Sterling, IL in 2022:
Mount Sterling:
$53,790
Illinois:
$76,708
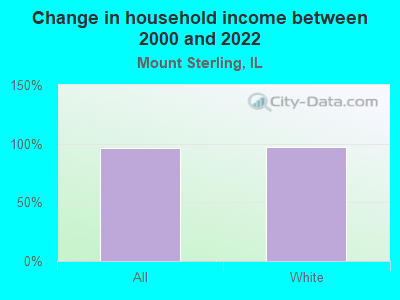
Change in median household income between 2000 and 2022:
Mount Sterling, Illinois:
+96.1%
State:
+64.6%
Number of households with income < $10k:
Mount Sterling:
1.4% (14)
State:
5.9% (296,090)
Number of households with income $10k - 20k:
Mount Sterling:
18.9% (195)
Illinois:
6.6% (333,259)
Number of households with income $20k - 30k:
Mount Sterling:
8.9% (92)
State:
6.8% (342,921)
Number of households with income $30k - 40k:
Mount Sterling:
4.3% (44)
Illinois:
7.0% (355,254)
Number of households with income $40k - 50k:
Mount Sterling:
13.5% (140)
State:
6.7% (340,678)
Number of households with income $50k - 60k:
Mount Sterling:
5.4% (56)
Illinois:
6.7% (339,405)
Number of households with income $60k - 75k:
Mount Sterling:
15.2% (157)
State:
9.2% (465,709)
Number of households with income $75k - 100k:
Mount Sterling:
14.9% (154)
State:
12.9% (651,353)
Number of households with income $100k - 125k:
Mount Sterling:
10.1% (104)
State:
10.3% (522,359)
Number of households with income $125k - 150k:
Mount Sterling:
5.4% (56)
Illinois:
7.3% (367,136)
Number of households with income $150k - 200k:
Mount Sterling:
1.2% (12)
State:
9.0% (455,249)
Number of households with income > $200k:
Mount Sterling:
1.0% (10)
Illinois:
11.6% (586,947)
Aggregate household income in Mount Sterling in 2022: $70,299,027
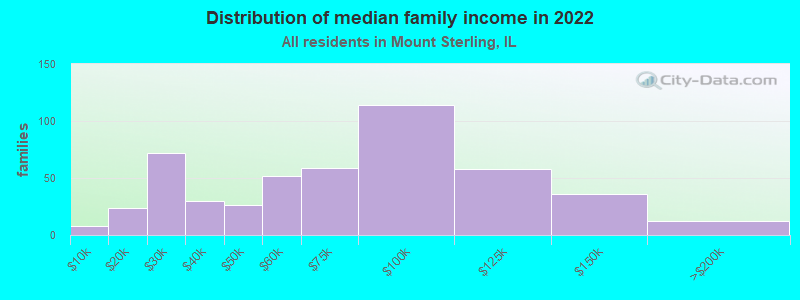
Median family income in Mount Sterling in 2022:
Mount Sterling:
$70,934
State:
$96,948
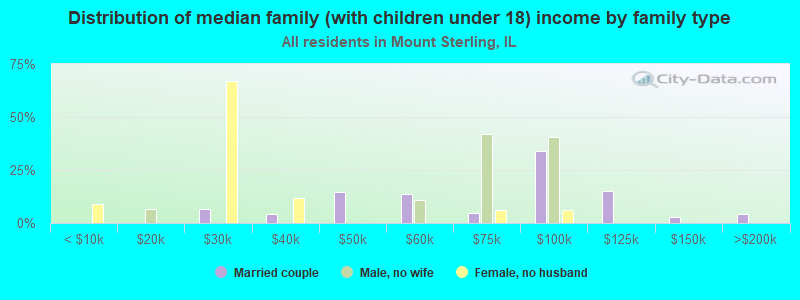
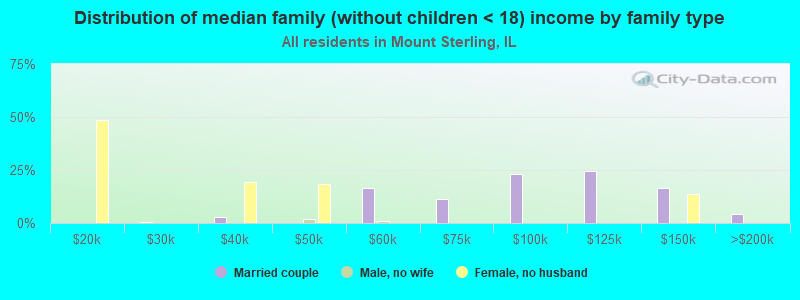
Number of families with income < $10k:
Mount Sterling:
1.6% (8)
Illinois:
3.4% (105,875)
Number of families with income $10k - 20k:
Mount Sterling:
4.9% (24)
Illinois:
3.3% (105,017)
Number of families with income $20k - 30k:
Mount Sterling:
14.7% (72)
State:
4.7% (146,403)
Number of families with income $30k - 40k:
Mount Sterling:
6.1% (30)
State:
5.3% (167,069)
Number of families with income $40k - 50k:
Mount Sterling:
5.3% (26)
State:
5.8% (181,164)
Number of families with income $50k - 60k:
Mount Sterling:
10.6% (52)
State:
6.1% (191,561)
Number of families with income $60k - 75k:
Mount Sterling:
12.0% (59)
Illinois:
9.0% (282,985)
Number of families with income $75k - 100k:
Mount Sterling:
23.3% (114)
State:
13.8% (432,725)
Number of families with income $100k - 125k:
Mount Sterling:
11.8% (58)
Illinois:
11.9% (373,296)
Number of families with income $125k - 150k:
Mount Sterling:
7.4% (36)
State:
8.9% (279,791)
Number of families with income $150k - 200k:
Mount Sterling:
2.4% (12)
State:
11.9% (372,004)
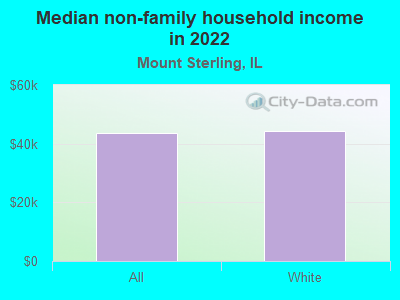
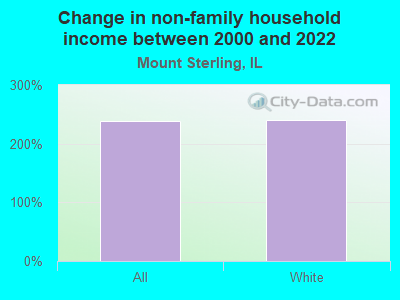
Median non-family income in Mount Sterling in 2022:
Mount Sterling:
$43,720
State:
$46,533
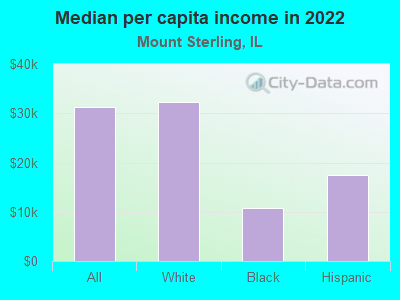
Median per capita income in Mount Sterling in 2022:
Mount Sterling:
$31,240
State:
$43,317
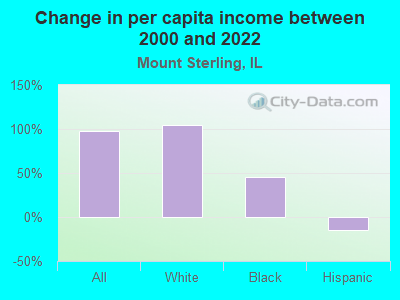
Change in median per capita income between 2000 and 2022:
Mount Sterling, Illinois:
+98.3%
State:
+87.5%
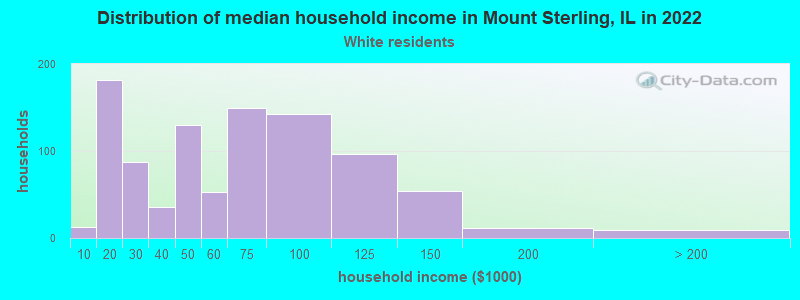
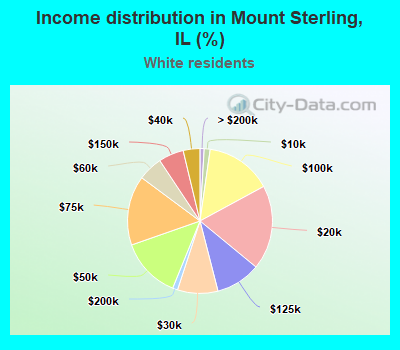
Income statistics for White residents
Median household income in Mount Sterling, IL in 2022:
Mount Sterling:
$54,186
State:
$83,346
Change in median household income between 2000 and 2022:
Mount Sterling, Illinois:
+97.0%
State:
+67.5%
Number of households with income < $10k:
Mount Sterling:
1.3% (13)
State:
4.5% (149,895)
Number of households with income $10k - 20k:
Mount Sterling:
18.9% (182)
State:
5.5% (184,529)
Number of households with income $20k - 30k:
Mount Sterling:
9.0% (87)
State:
6.1% (205,767)
Number of households with income $30k - 40k:
Mount Sterling:
3.7% (36)
Illinois:
6.7% (225,572)
Number of households with income $40k - 50k:
Mount Sterling:
13.5% (130)
Illinois:
6.5% (216,965)
Number of households with income $50k - 60k:
Mount Sterling:
5.5% (53)
State:
6.6% (222,841)
Number of households with income $60k - 75k:
Mount Sterling:
15.5% (150)
Illinois:
9.3% (312,758)
Number of households with income $75k - 100k:
Mount Sterling:
14.8% (143)
State:
12.9% (433,180)
Number of households with income $100k - 125k:
Mount Sterling:
10.1% (97)
State:
10.7% (360,753)
Number of households with income $125k - 150k:
Mount Sterling:
5.6% (54)
State:
7.9% (266,532)
Number of households with income $150k - 200k:
Mount Sterling:
1.1% (11)
State:
10.0% (337,357)
Number of households with income > $200k:
Mount Sterling:
0.9% (9)
Illinois:
13.3% (446,069)
Aggregate household income in Mount Sterling in 2022: $66,698,922
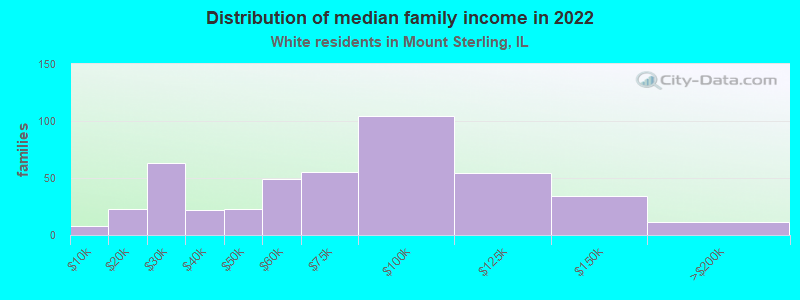
Median family income in Mount Sterling in 2022:
Mount Sterling:
$72,145
State:
$107,938
Number of families with income < $10k:
Mount Sterling:
1.7% (8)
State:
2.2% (45,983)
Number of families with income $10k - 20k:
Mount Sterling:
5.2% (23)
State:
2.5% (50,574)
Number of families with income $20k - 30k:
Mount Sterling:
14.1% (63)
State:
3.5% (70,927)
Number of families with income $30k - 40k:
Mount Sterling:
5.0% (22)
Illinois:
4.4% (90,563)
Number of families with income $40k - 50k:
Mount Sterling:
5.2% (23)
Illinois:
5.0% (102,597)
Number of families with income $50k - 60k:
Mount Sterling:
11.0% (49)
Illinois:
5.8% (119,129)
Number of families with income $60k - 75k:
Mount Sterling:
12.3% (55)
State:
8.8% (179,665)
Number of families with income $75k - 100k:
Mount Sterling:
23.3% (104)
State:
13.5% (276,887)
Number of families with income $100k - 125k:
Mount Sterling:
12.2% (54)
Illinois:
12.5% (256,099)
Number of families with income $125k - 150k:
Mount Sterling:
7.6% (34)
State:
9.8% (199,855)
Number of families with income $150k - 200k:
Mount Sterling:
2.5% (11)
Illinois:
13.4% (274,569)
Median non-family income in Mount Sterling in 2022:
Mount Sterling:
$44,452
Illinois:
$50,934
Median per capita income in Mount Sterling in 2022:
Mount Sterling:
$32,193
Illinois:
$50,738
Change in median per capita income between 2000 and 2022:
Mount Sterling, Illinois:
+103.9%
State:
+95.5%
Income statistics for Black or African American residents
Median per capita income in Mount Sterling in 2022:
Mount Sterling:
$10,770
State:
$28,045
Change in median per capita income between 2000 and 2022:
Mount Sterling, Illinois:
+45.5%
State:
+90.2%
Income statistics for Hispanic or Latino residents
Number of households with income < $10k:
Mount Sterling:
0.0% (0)
Illinois:
4.9% (33,145)
Number of households with income $10k - 20k:
Mount Sterling:
0.0% (0)
State:
5.4% (36,345)
Number of households with income $20k - 30k:
Mount Sterling:
100.0% (41)
State:
7.5% (50,677)
Number of households with income $30k - 40k:
Mount Sterling:
0.0% (0)
State:
7.7% (52,008)
Number of households with income $40k - 50k:
Mount Sterling:
0.0% (0)
State:
8.1% (54,702)
Number of households with income $50k - 60k:
Mount Sterling:
0.0% (0)
Illinois:
7.5% (51,062)
Number of households with income $60k - 75k:
Mount Sterling:
0.0% (0)
State:
11.3% (76,576)
Number of households with income $75k - 100k:
Mount Sterling:
0.0% (0)
Illinois:
15.5% (105,152)
Number of households with income $100k - 125k:
Mount Sterling:
0.0% (0)
Illinois:
11.5% (77,760)
Number of households with income $125k - 150k:
Mount Sterling:
0.0% (0)
Illinois:
7.3% (49,310)
Number of households with income $150k - 200k:
Mount Sterling:
0.0% (0)
State:
7.6% (51,233)
Number of households with income > $200k:
Mount Sterling:
0.0% (0)
State:
5.9% (40,028)
Aggregate household income in Mount Sterling in 2022: $5,193,633
Median per capita income in Mount Sterling in 2022:
Mount Sterling:
$17,486
Illinois:
$26,551
Change in median per capita income between 2000 and 2022:: -14.5%
Mount Sterling, Illinois:
-14.5%
Illinois:
+111.0%
Discuss Mount Sterling, Illinois (IL) on our hugely popular Illinois forum.