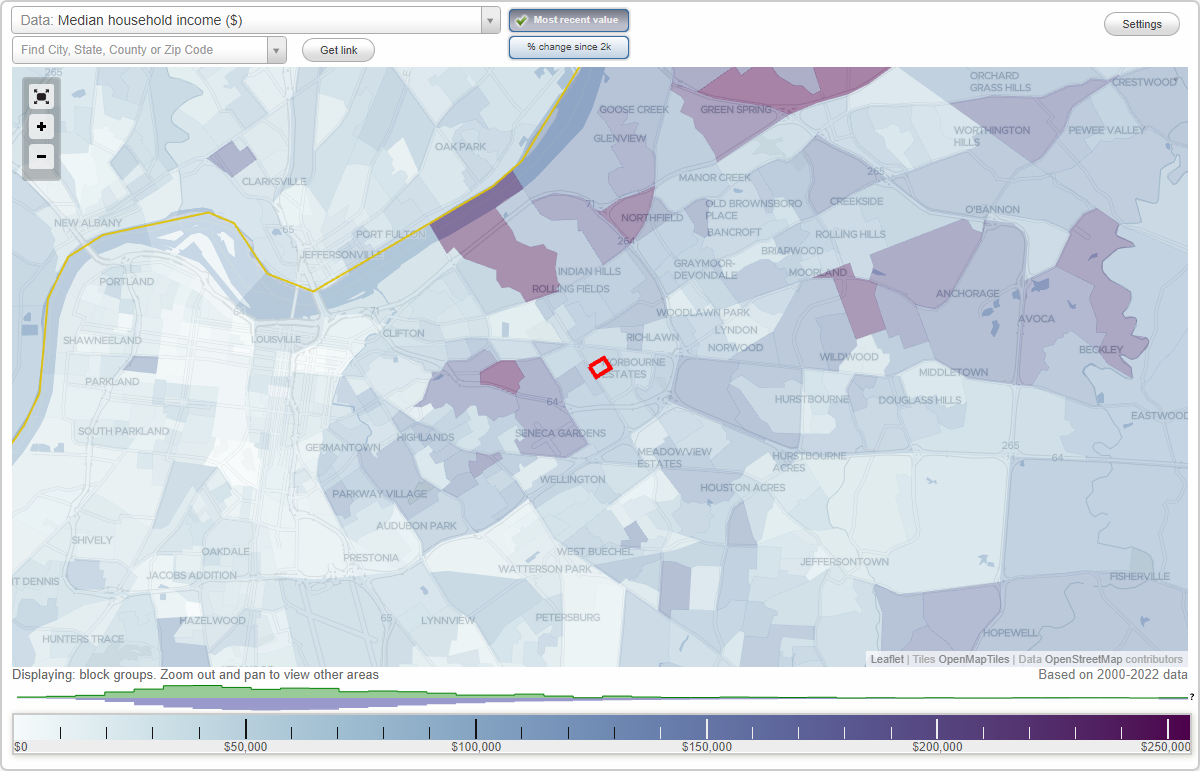
The median household income in Norbourne Estates, KY in 2022 was $162,721, which was 63.5% greater than the median annual income of $59,341 across the entire state of Kentucky. Compared to the median income of $109,028 in 2000 this represents an increase of 33.0%. The per capita income in 2022 was $84,154, which means an increase of 44.2% compared to 2000 when it was $46,980.
Whole page based on the data from 2000 / 2022 when the population of Norbourne Estates, Kentucky was 461 / 461
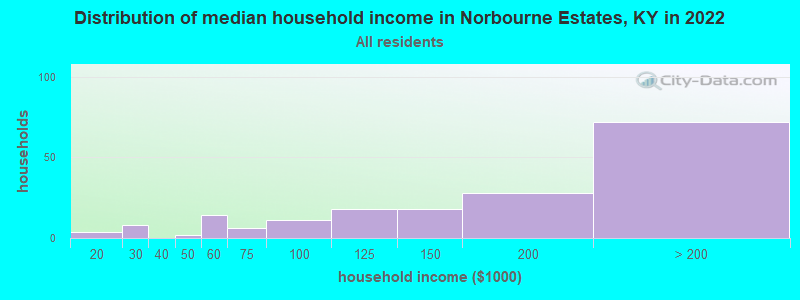
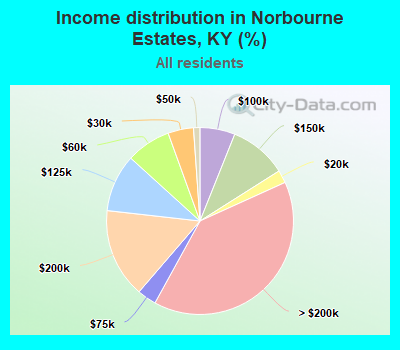
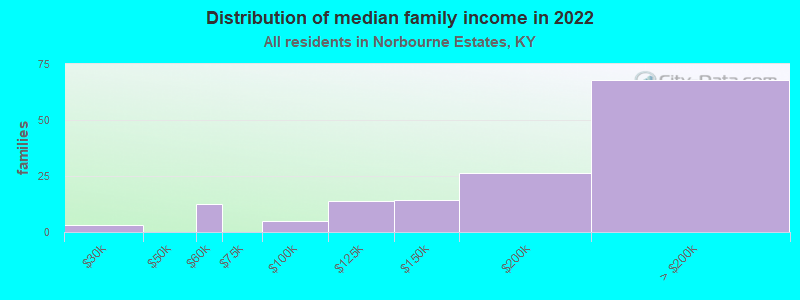
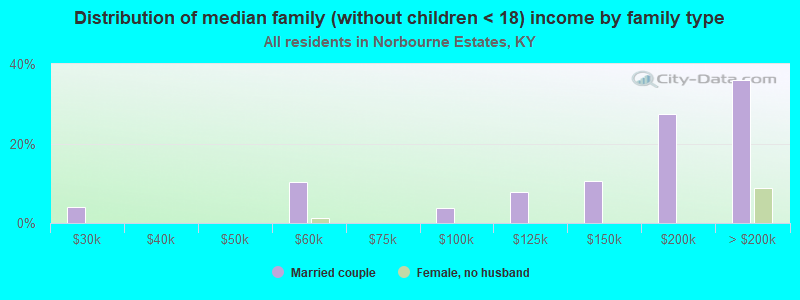
Income statistics for all residents
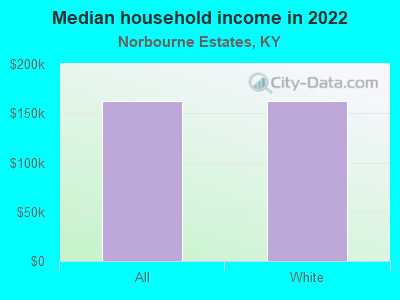
Median household income in Norbourne Estates, KY in 2022:
Norbourne Estates:
$162,721
Kentucky:
$59,341
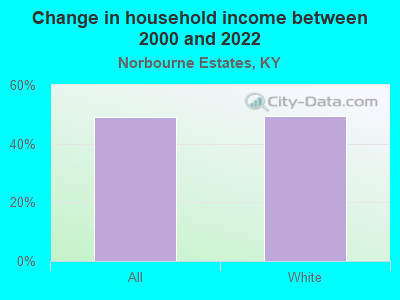
Change in median household income between 2000 and 2022:
Norbourne Estates, Kentucky:
+49.2%
Kentucky:
+76.2%
Number of households with income < $10k:
Norbourne Estates:
0.0% (0)
Kentucky:
6.8% (123,697)
Number of households with income $10k - 20k:
Norbourne Estates:
2.2% (4)
State:
10.0% (182,645)
Number of households with income $20k - 30k:
Norbourne Estates:
4.4% (8)
Kentucky:
9.0% (164,092)
Number of households with income $30k - 40k:
Norbourne Estates:
0.0% (0)
State:
9.1% (165,607)
Number of households with income $40k - 50k:
Norbourne Estates:
1.1% (2)
State:
8.0% (146,315)
Number of households with income $50k - 60k:
Norbourne Estates:
7.7% (14)
Kentucky:
7.7% (140,671)
Number of households with income $60k - 75k:
Norbourne Estates:
3.3% (6)
Kentucky:
9.8% (180,002)
Number of households with income $75k - 100k:
Norbourne Estates:
6.1% (11)
State:
12.6% (230,239)
Number of households with income $100k - 125k:
Norbourne Estates:
9.9% (18)
Kentucky:
9.0% (164,398)
Number of households with income $125k - 150k:
Norbourne Estates:
9.9% (18)
State:
5.9% (108,602)
Number of households with income $150k - 200k:
Norbourne Estates:
15.5% (28)
State:
6.2% (112,813)
Number of households with income > $200k:
Norbourne Estates:
39.8% (72)
State:
6.0% (109,599)
Aggregate household income in Norbourne Estates in 2022: $40,150,595
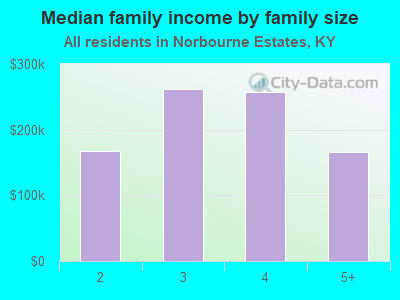
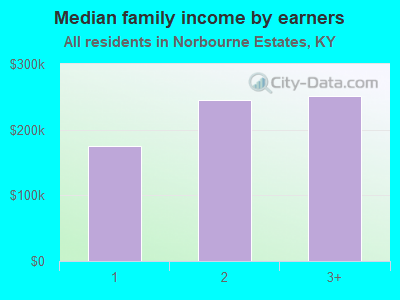
Median family income in Norbourne Estates in 2022:
Norbourne Estates:
$194,887
State:
$76,119
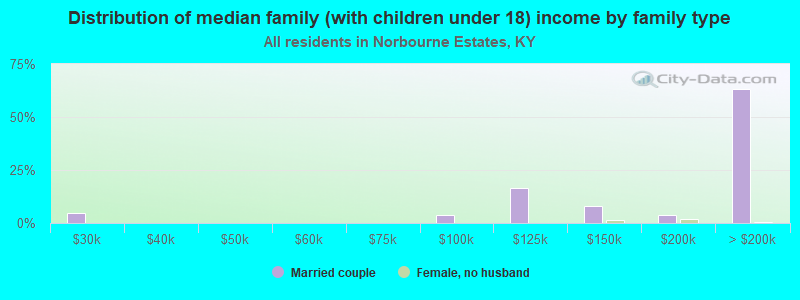
Number of families with income $20k - 30k:
Norbourne Estates:
2.3% (3)
State:
6.5% (76,765)
Number of families with income $50k - 60k:
Norbourne Estates:
8.7% (12)
State:
7.4% (86,258)
Number of families with income $75k - 100k:
Norbourne Estates:
3.4% (5)
Kentucky:
14.7% (172,722)
Number of families with income $100k - 125k:
Norbourne Estates:
9.7% (14)
State:
11.5% (134,935)
Number of families with income $125k - 150k:
Norbourne Estates:
10.1% (14)
Kentucky:
7.9% (93,107)
Number of families with income $150k - 200k:
Norbourne Estates:
18.5% (26)
Kentucky:
8.4% (98,984)
Number of families with income > $200k:
Norbourne Estates:
47.4% (68)
Kentucky:
8.2% (96,213)
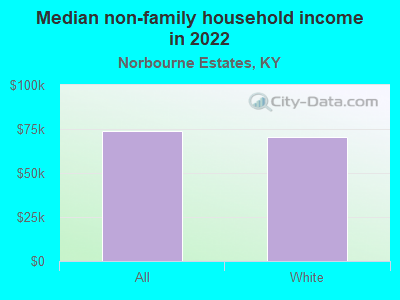
Median non-family income in Norbourne Estates in 2022:
Norbourne Estates:
$73,763
Kentucky:
$33,993
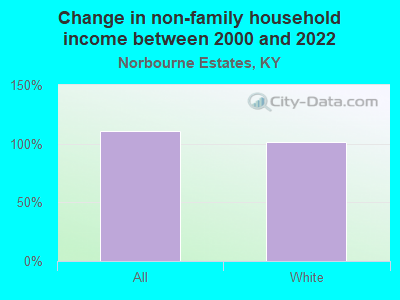
Change in median non-family income between 2000 and 2022:
Norbourne Estates, Kentucky:
+110.8%
Kentucky:
+79.2%
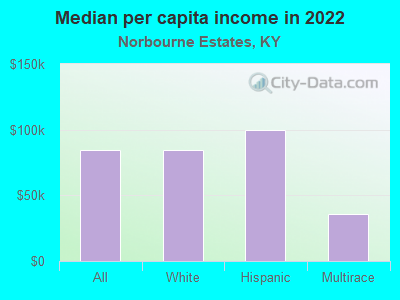
Median per capita income in Norbourne Estates in 2022:
Norbourne Estates:
$84,155
State:
$33,980
Change in median per capita income between 2000 and 2022:
Norbourne Estates, Kentucky:
+79.1%
State:
+87.8%
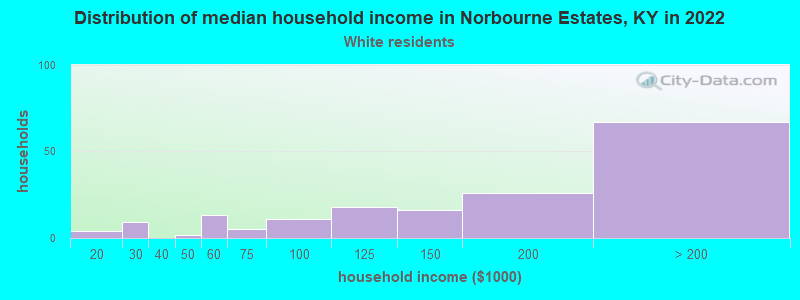
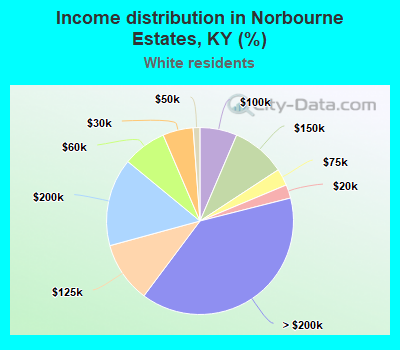
Income statistics for White residents
Median household income in Norbourne Estates, KY in 2022:
Norbourne Estates:
$162,763
Kentucky:
$60,987
Change in median household income between 2000 and 2022:
Norbourne Estates, Kentucky:
+49.3%
Kentucky:
+76.2%
Number of households with income < $10k:
Norbourne Estates:
0.0% (0)
State:
6.2% (96,690)
Number of households with income $10k - 20k:
Norbourne Estates:
2.3% (4)
State:
9.7% (151,125)
Number of households with income $20k - 30k:
Norbourne Estates:
5.3% (9)
State:
8.9% (139,532)
Number of households with income $30k - 40k:
Norbourne Estates:
0.0% (0)
Kentucky:
9.1% (142,284)
Number of households with income $40k - 50k:
Norbourne Estates:
1.2% (2)
State:
7.7% (121,151)
Number of households with income $50k - 60k:
Norbourne Estates:
7.6% (13)
Kentucky:
7.7% (119,790)
Number of households with income $60k - 75k:
Norbourne Estates:
2.9% (5)
State:
9.9% (154,174)
Number of households with income $75k - 100k:
Norbourne Estates:
6.4% (11)
State:
12.8% (199,740)
Number of households with income $100k - 125k:
Norbourne Estates:
10.5% (18)
State:
9.4% (146,284)
Number of households with income $125k - 150k:
Norbourne Estates:
9.4% (16)
State:
6.0% (94,180)
Number of households with income $150k - 200k:
Norbourne Estates:
15.2% (26)
State:
6.4% (100,702)
Number of households with income > $200k:
Norbourne Estates:
39.2% (67)
State:
6.3% (98,502)
Aggregate household income in Norbourne Estates in 2022: $37,183,146
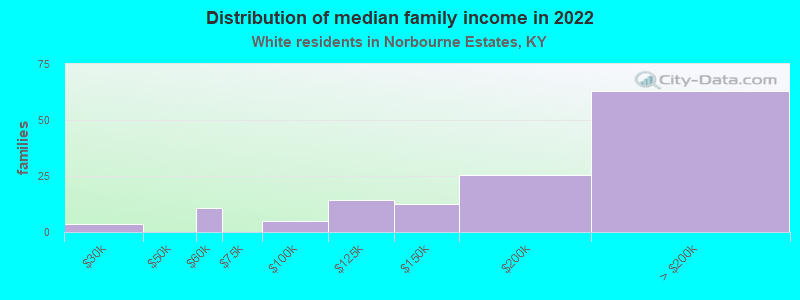
Median family income in Norbourne Estates in 2022:
Norbourne Estates:
$191,648
Kentucky:
$78,353
Number of families with income $20k - 30k:
Norbourne Estates:
2.8% (4)
Kentucky:
6.4% (64,043)
Number of families with income $50k - 60k:
Norbourne Estates:
7.9% (11)
State:
7.2% (72,955)
Number of families with income $75k - 100k:
Norbourne Estates:
3.7% (5)
State:
15.0% (151,545)
Number of families with income $100k - 125k:
Norbourne Estates:
10.5% (14)
State:
11.9% (120,340)
Number of families with income $125k - 150k:
Norbourne Estates:
9.3% (13)
State:
8.1% (81,620)
Number of families with income $150k - 200k:
Norbourne Estates:
19.1% (26)
Kentucky:
8.8% (89,097)
Number of families with income > $200k:
Norbourne Estates:
46.8% (63)
Kentucky:
8.6% (86,849)
Median non-family income in Norbourne Estates in 2022:
Norbourne Estates:
$70,210
Kentucky:
$34,415
Change in median non-family income between 2000 and 2022:
Norbourne Estates, Kentucky:
+100.6%
Kentucky:
+78.3%
Median per capita income in Norbourne Estates in 2022:
Norbourne Estates:
$84,229
Kentucky:
$35,352
Change in median per capita income between 2000 and 2022:
Norbourne Estates, Kentucky:
+72.7%
State:
+90.2%
Income statistics for Hispanic or Latino residents
Median per capita income in Norbourne Estates in 2022:
Norbourne Estates:
$99,550
State:
$24,650
Income statistics for Multirace residents
Median per capita income in Norbourne Estates in 2022:
Norbourne Estates:
$36,064
Kentucky:
$25,670
Change in median per capita income between 2000 and 2022:
Norbourne Estates, Kentucky:
+137.7%
State:
+132.3%
Discuss Norbourne Estates, Kentucky (KY) on our hugely popular Kentucky forum.