The median household income in North Bend, NE in 2022 was $79,495, which was 12.5% greater than the median annual income of $69,597 across the entire state of Nebraska. Compared to the median income of $38,879 in 2000 this represents an increase of 51.1%. The per capita income in 2022 was $35,207, which means an increase of 54.8% compared to 2000 when it was $15,897.
Whole page based on the data from 2000 / 2022 when the population of North Bend, Nebraska was 1,213 / 1,256
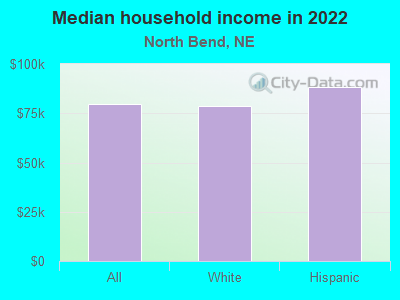
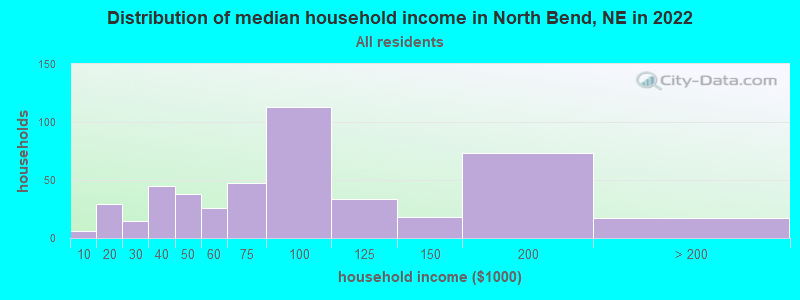
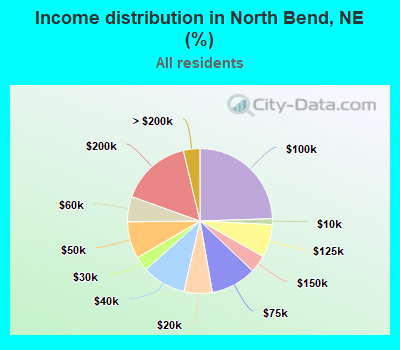
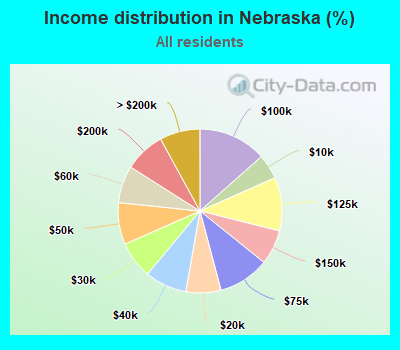
Income statistics for all residents
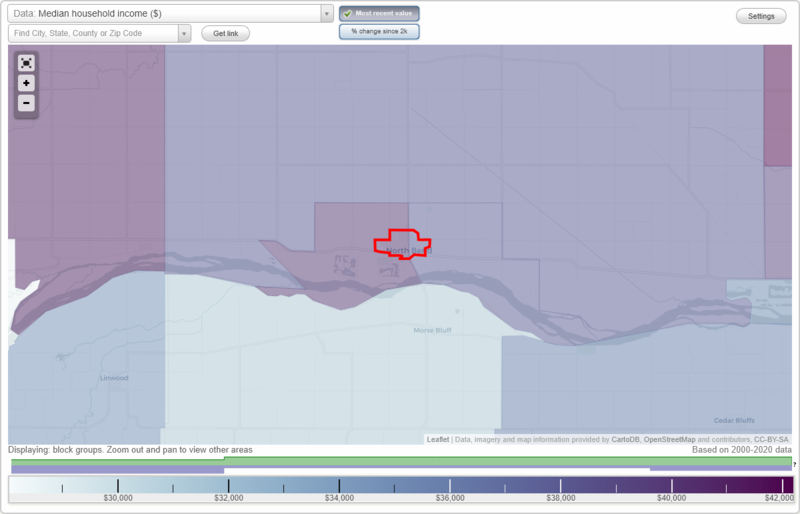
Median household income in North Bend, NE in 2022:
North Bend:
$79,496
Nebraska:
$69,597
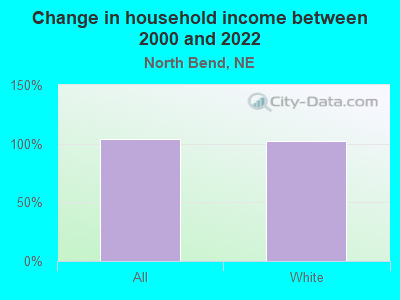
Change in median household income between 2000 and 2022:
North Bend, Nebraska:
+104.5%
State:
+77.3%
Number of households with income < $10k:
North Bend:
1.3% (6)
State:
4.9% (39,385)
Number of households with income $10k - 20k:
North Bend:
6.3% (29)
State:
6.9% (55,520)
Number of households with income $20k - 30k:
North Bend:
3.3% (15)
Nebraska:
7.3% (58,969)
Number of households with income $30k - 40k:
North Bend:
9.8% (45)
State:
8.3% (66,349)
Number of households with income $40k - 50k:
North Bend:
8.2% (38)
State:
8.3% (66,330)
Number of households with income $50k - 60k:
North Bend:
5.6% (26)
State:
7.3% (58,981)
Number of households with income $60k - 75k:
North Bend:
10.2% (47)
Nebraska:
10.1% (80,982)
Number of households with income $75k - 100k:
North Bend:
24.5% (113)
Nebraska:
13.5% (108,056)
Number of households with income $100k - 125k:
North Bend:
7.4% (34)
State:
10.6% (84,921)
Number of households with income $125k - 150k:
North Bend:
3.9% (18)
Nebraska:
6.9% (55,106)
Number of households with income $150k - 200k:
North Bend:
15.8% (73)
State:
8.0% (64,623)
Number of households with income > $200k:
North Bend:
3.7% (17)
Nebraska:
8.0% (63,935)
Aggregate household income in North Bend in 2022: $42,437,927
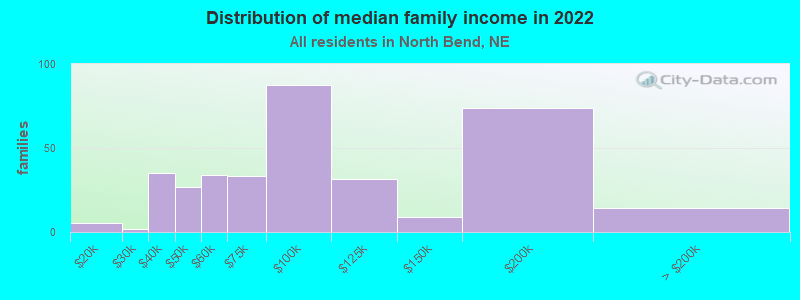
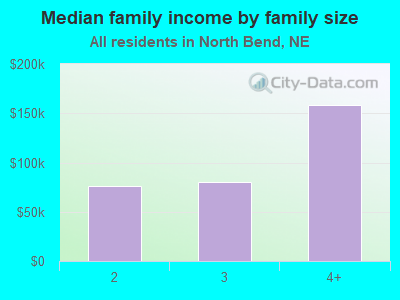
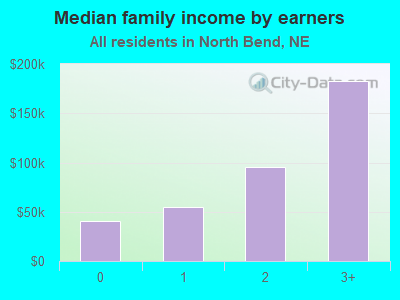
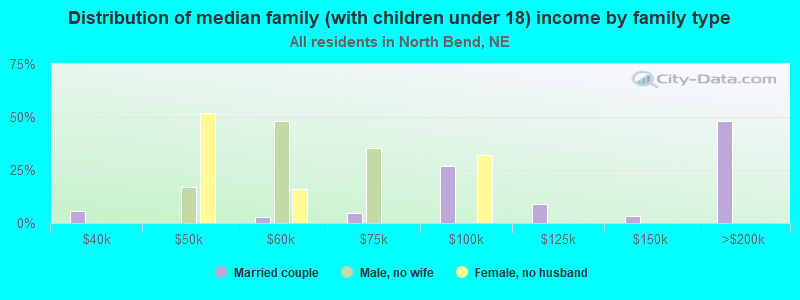
Median family income in North Bend in 2022:
North Bend:
$84,807
State:
$92,676
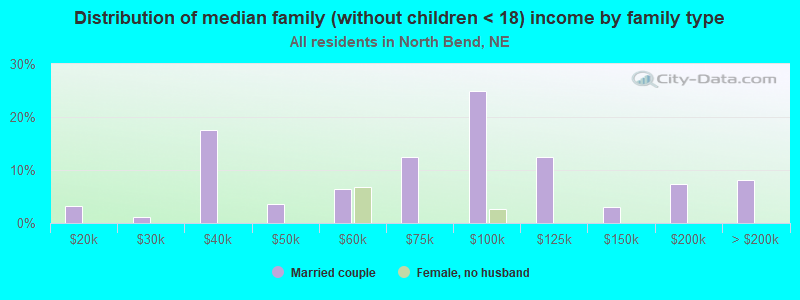
Number of families with income $10k - 20k:
North Bend:
1.5% (5)
State:
3.1% (15,673)
Number of families with income $20k - 30k:
North Bend:
0.5% (2)
Nebraska:
4.4% (21,835)
Number of families with income $30k - 40k:
North Bend:
10.0% (35)
State:
5.6% (27,925)
Number of families with income $40k - 50k:
North Bend:
7.6% (27)
Nebraska:
6.6% (33,164)
Number of families with income $50k - 60k:
North Bend:
9.6% (34)
State:
6.2% (31,270)
Number of families with income $60k - 75k:
North Bend:
9.4% (33)
State:
10.5% (52,455)
Number of families with income $75k - 100k:
North Bend:
24.8% (88)
Nebraska:
15.4% (77,141)
Number of families with income $100k - 125k:
North Bend:
9.0% (32)
Nebraska:
13.5% (67,817)
Number of families with income $125k - 150k:
North Bend:
2.6% (9)
State:
9.4% (47,206)
Number of families with income $150k - 200k:
North Bend:
20.9% (74)
State:
11.4% (57,335)
Number of families with income > $200k:
North Bend:
4.1% (15)
Nebraska:
11.1% (55,699)
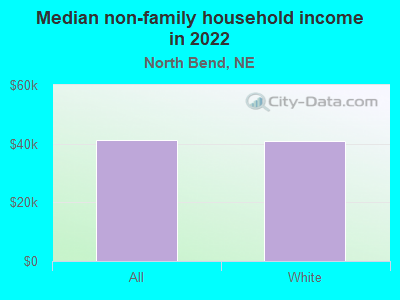
Median non-family income in North Bend in 2022:
North Bend:
$41,125
State:
$40,712
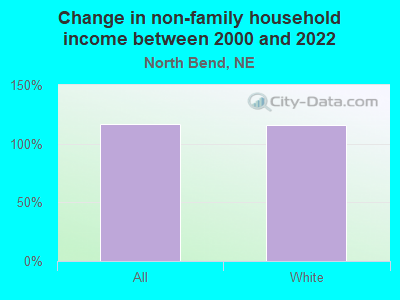
Change in median non-family income between 2000 and 2022:
North Bend, Nebraska:
+116.7%
State:
+77.1%
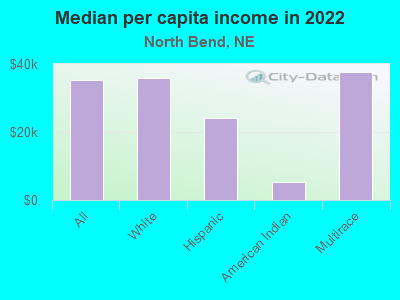
Median per capita income in North Bend in 2022:
North Bend:
$35,208
Nebraska:
$38,997
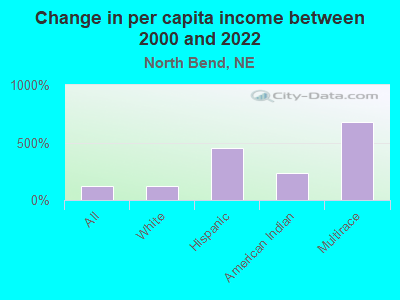
Change in median per capita income between 2000 and 2022:
North Bend, Nebraska:
+121.5%
State:
+98.8%
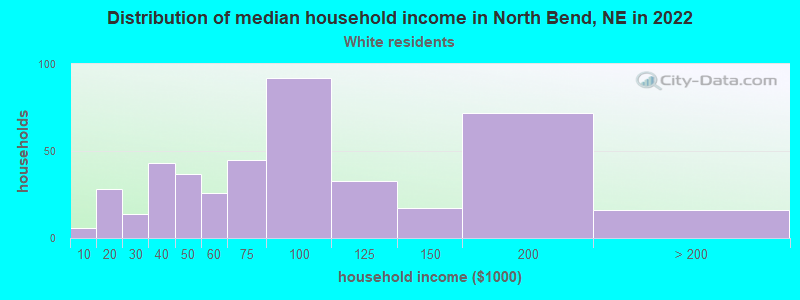
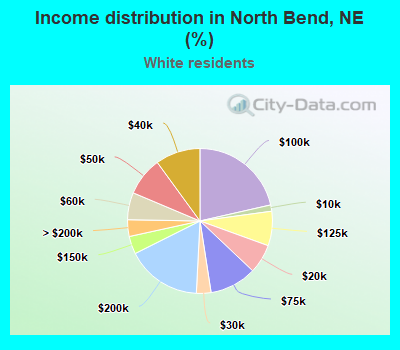
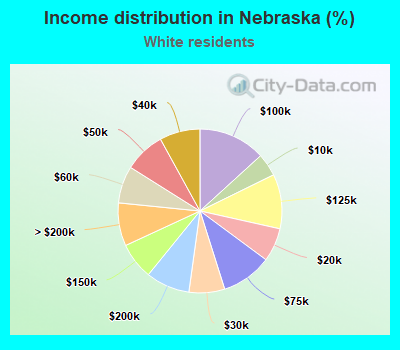
Income statistics for White residents
Median household income in North Bend, NE in 2022:
North Bend:
$78,700
State:
$72,200
Change in median household income between 2000 and 2022:
North Bend, Nebraska:
+102.2%
State:
+79.8%
Number of households with income < $10k:
North Bend:
1.4% (6)
State:
4.5% (30,161)
Number of households with income $10k - 20k:
North Bend:
6.5% (28)
State:
6.6% (44,570)
Number of households with income $20k - 30k:
North Bend:
3.3% (14)
State:
7.0% (47,313)
Number of households with income $30k - 40k:
North Bend:
10.0% (43)
Nebraska:
8.0% (53,672)
Number of households with income $40k - 50k:
North Bend:
8.6% (37)
Nebraska:
8.1% (54,226)
Number of households with income $50k - 60k:
North Bend:
6.1% (26)
State:
7.3% (49,363)
Number of households with income $60k - 75k:
North Bend:
10.5% (45)
State:
10.0% (67,227)
Number of households with income $75k - 100k:
North Bend:
21.4% (92)
State:
13.2% (88,988)
Number of households with income $100k - 125k:
North Bend:
7.7% (33)
Nebraska:
10.8% (72,291)
Number of households with income $125k - 150k:
North Bend:
4.0% (17)
State:
7.2% (48,670)
Number of households with income $150k - 200k:
North Bend:
16.8% (72)
Nebraska:
8.7% (58,306)
Number of households with income > $200k:
North Bend:
3.7% (16)
Nebraska:
8.5% (57,020)
Aggregate household income in North Bend in 2022: $39,818,729
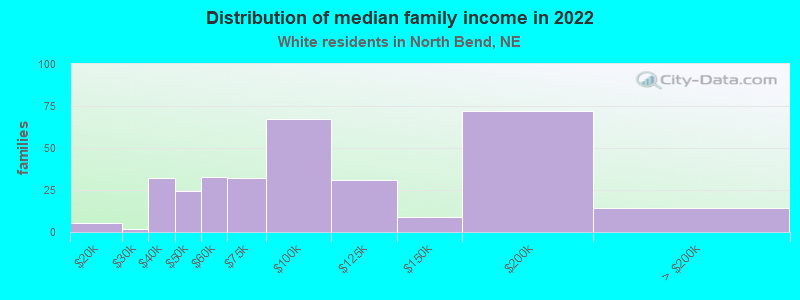
Median family income in North Bend in 2022:
North Bend:
$85,129
State:
$97,416
Number of families with income $10k - 20k:
North Bend:
1.7% (5)
State:
2.7% (11,277)
Number of families with income $20k - 30k:
North Bend:
0.5% (2)
State:
3.7% (15,266)
Number of families with income $30k - 40k:
North Bend:
9.9% (32)
State:
4.9% (20,081)
Number of families with income $40k - 50k:
North Bend:
7.7% (25)
Nebraska:
6.0% (24,700)
Number of families with income $50k - 60k:
North Bend:
10.2% (33)
Nebraska:
6.1% (25,277)
Number of families with income $60k - 75k:
North Bend:
9.9% (32)
Nebraska:
10.3% (42,609)
Number of families with income $75k - 100k:
North Bend:
21.0% (67)
State:
15.1% (62,421)
Number of families with income $100k - 125k:
North Bend:
9.6% (31)
State:
14.0% (57,836)
Number of families with income $125k - 150k:
North Bend:
2.8% (9)
State:
10.2% (42,226)
Number of families with income $150k - 200k:
North Bend:
22.4% (72)
State:
12.5% (51,522)
Number of families with income > $200k:
North Bend:
4.4% (14)
State:
12.1% (50,040)
Median non-family income in North Bend in 2022:
North Bend:
$41,037
Nebraska:
$41,549
Change in median non-family income between 2000 and 2022:
North Bend, Nebraska:
+116.2%
State:
+78.3%
Median per capita income in North Bend in 2022:
North Bend:
$36,027
Nebraska:
$42,734
Change in median per capita income between 2000 and 2022:
North Bend, Nebraska:
+124.9%
Nebraska:
+108.4%
Income statistics for Hispanic or Latino residents
Median household income in North Bend, NE in 2022:
North Bend:
$88,327
Nebraska:
$60,800
Aggregate household income in North Bend in 2022: $876,558
Median family income in North Bend in 2022:
North Bend:
$89,638
Nebraska:
$67,625
Median per capita income in North Bend in 2022:
North Bend:
$24,063
State:
$21,511
Income statistics for American Indian and Alaska Native residents
Median per capita income in North Bend in 2022:
North Bend:
$5,157
State:
$31,134
Income statistics for Multirace residents
Number of households with income < $10k:
North Bend:
0.0% (0)
Nebraska:
6.9% (3,446)
Number of households with income $10k - 20k:
North Bend:
0.0% (0)
Nebraska:
6.9% (3,482)
Number of households with income $20k - 30k:
North Bend:
0.0% (0)
State:
8.0% (4,043)
Number of households with income $30k - 40k:
North Bend:
0.0% (0)
State:
9.8% (4,942)
Number of households with income $40k - 50k:
North Bend:
0.0% (0)
State:
7.2% (3,635)
Number of households with income $50k - 60k:
North Bend:
0.0% (0)
State:
8.5% (4,296)
Number of households with income $60k - 75k:
North Bend:
0.0% (0)
State:
8.9% (4,478)
Number of households with income $75k - 100k:
North Bend:
100.0% (15)
State:
14.4% (7,238)
Number of households with income $100k - 125k:
North Bend:
0.0% (0)
Nebraska:
11.2% (5,634)
Number of households with income $125k - 150k:
North Bend:
0.0% (0)
State:
6.0% (3,011)
Number of households with income $150k - 200k:
North Bend:
0.0% (0)
State:
6.5% (3,267)
Number of households with income > $200k:
North Bend:
0.0% (0)
State:
5.5% (2,778)
Median per capita income in North Bend in 2022:
North Bend:
$37,722
Nebraska:
$24,026
Discuss North Bend, Nebraska (NE) on our hugely popular Nebraska forum.