North Creek, Washington (WA) income map, earnings map, and wages data
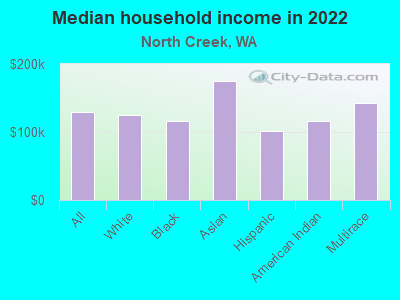
The median household income in North Creek, WA in 2022 was $128,759, which was 29.1% greater than the median annual income of $91,306 across the entire state of Washington. Compared to the median income of $67,289 in 2000 this represents an increase of 47.7%. The per capita income in 2022 was $56,694, which means an increase of 54.4% compared to 2000 when it was $25,861.
Income statistics for all residents
Median household income in North Creek, WA in 2022:| North Creek: | $128,760 |
| Washington: | $91,306 |
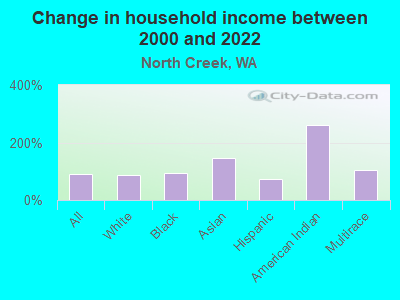
Change in median household income between 2000 and 2022:| North Creek, Washington: | +91.4% |
| Washington: | +99.5% |
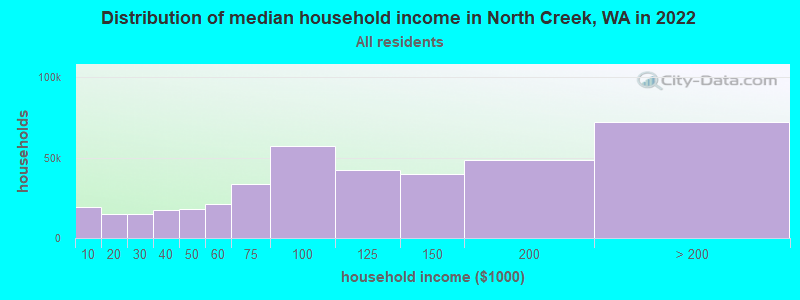
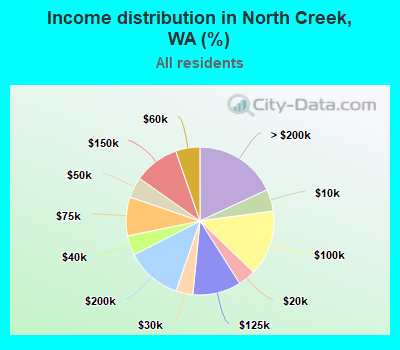
Number of households with income < $10k:| North Creek: | 4.8% (19,076) |
| Washington: | 4.5% (139,331) |
Number of households with income $10k - 20k:| North Creek: | 3.8% (15,215) |
| Washington: | 5.0% (154,508) |
Number of households with income $20k - 30k:| North Creek: | 3.7% (14,766) |
| State: | 5.4% (166,555) |
Number of households with income $30k - 40k:| North Creek: | 4.3% (17,242) |
| State: | 5.5% (170,324) |
Number of households with income $40k - 50k:| North Creek: | 4.5% (18,077) |
| Washington: | 6.0% (183,941) |
Number of households with income $50k - 60k:| North Creek: | 5.3% (21,178) |
| State: | 6.1% (187,395) |
Number of households with income $60k - 75k:| North Creek: | 8.5% (33,869) |
| State: | 8.7% (266,771) |
Number of households with income $75k - 100k:| North Creek: | 14.3% (57,132) |
| Washington: | 13.1% (404,672) |
Number of households with income $100k - 125k:| North Creek: | 10.6% (42,145) |
| State: | 11.0% (337,911) |
Number of households with income $125k - 150k:| North Creek: | 9.9% (39,583) |
| Washington: | 8.0% (244,934) |
Number of households with income $150k - 200k:| North Creek: | 12.2% (48,781) |
| State: | 10.5% (323,812) |
Number of households with income > $200k:| North Creek: | 18.1% (72,267) |
| State: | 16.2% (499,799) |
Aggregate household income in North Creek in 2022: $13,078,015,867
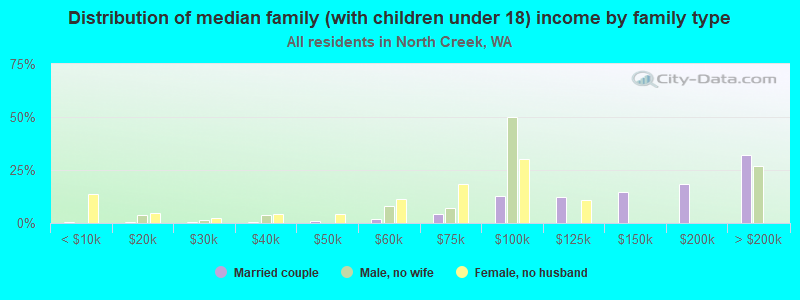
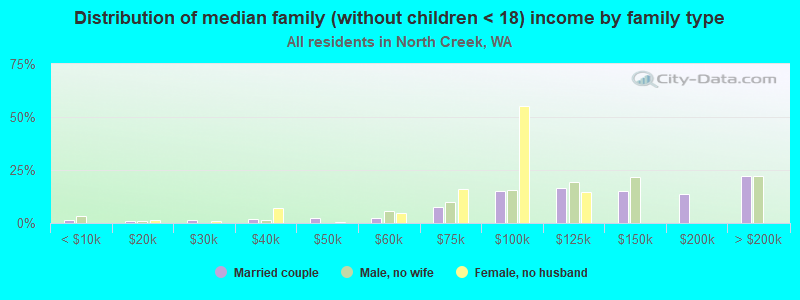
Median family income in North Creek in 2022:| North Creek: | $145,099 |
| State: | $109,192 |
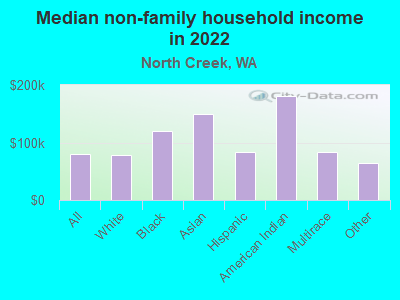
Median non-family income in North Creek in 2022:| North Creek: | $79,212 |
| State: | $57,299 |
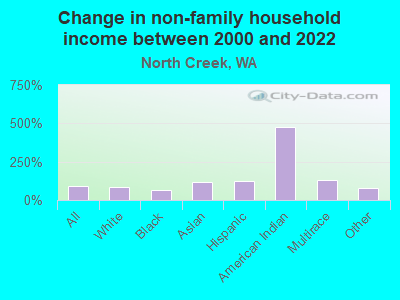
Change in median non-family income between 2000 and 2022:| North Creek, Washington: | +89.1% |
| Washington: | +94.9% |
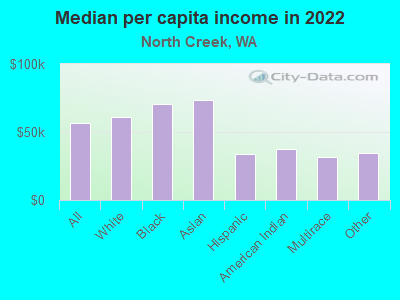
Median per capita income in North Creek in 2022:| North Creek: | $56,695 |
| State: | $50,764 |
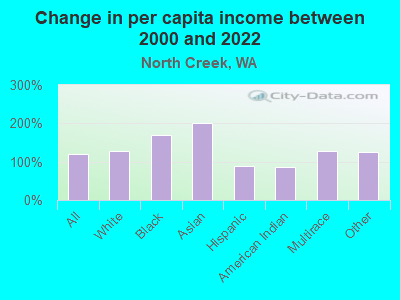
Change in median per capita income between 2000 and 2022:| North Creek, Washington: | +119.2% |
| State: | +121.0% |
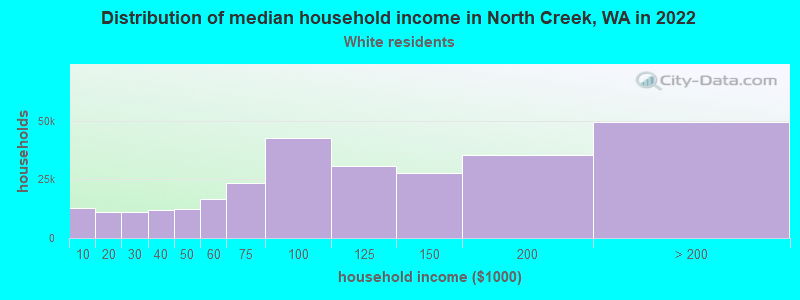
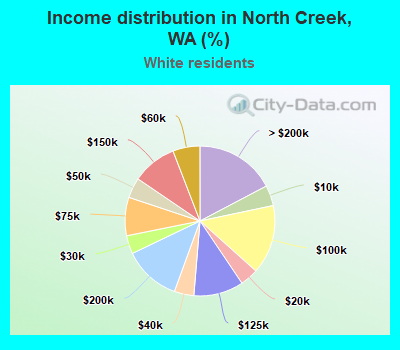
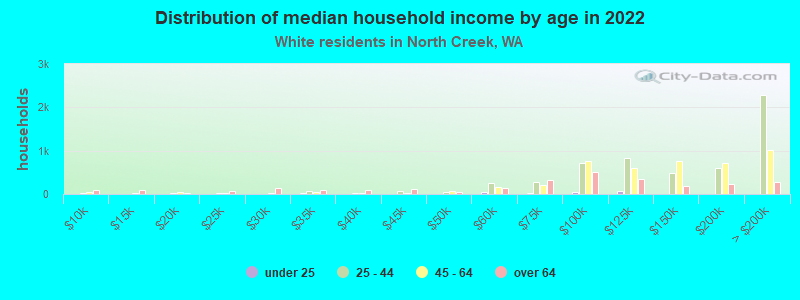
Income statistics for White residents
Median household income in North Creek, WA in 2022:| North Creek: | $125,331 |
| Washington: | $91,916 |
Change in median household income between 2000 and 2022:| North Creek, Washington: | +86.4% |
| State: | +95.4% |
Number of households with income < $10k:| North Creek: | 4.4% (12,574) |
| Washington: | 4.3% (95,850) |
Number of households with income $10k - 20k:| North Creek: | 3.9% (11,214) |
| Washington: | 4.8% (106,421) |
Number of households with income $20k - 30k:| North Creek: | 3.9% (11,276) |
| Washington: | 5.5% (122,860) |
Number of households with income $30k - 40k:| North Creek: | 4.2% (12,109) |
| State: | 5.4% (119,627) |
Number of households with income $40k - 50k:| North Creek: | 4.4% (12,556) |
| State: | 5.9% (132,276) |
Number of households with income $50k - 60k:| North Creek: | 5.9% (16,716) |
| Washington: | 6.1% (136,212) |
Number of households with income $60k - 75k:| North Creek: | 8.3% (23,650) |
| State: | 8.8% (196,086) |
Number of households with income $75k - 100k:| North Creek: | 14.9% (42,653) |
| State: | 13.4% (299,192) |
Number of households with income $100k - 125k:| North Creek: | 10.8% (30,740) |
| Washington: | 11.3% (252,209) |
Number of households with income $125k - 150k:| North Creek: | 9.6% (27,552) |
| State: | 7.9% (175,962) |
Number of households with income $150k - 200k:| North Creek: | 12.3% (35,226) |
| Washington: | 10.7% (239,156) |
Number of households with income > $200k:| North Creek: | 17.3% (49,434) |
| Washington: | 16.1% (359,917) |
Aggregate household income in North Creek in 2022: $8,433,783,256
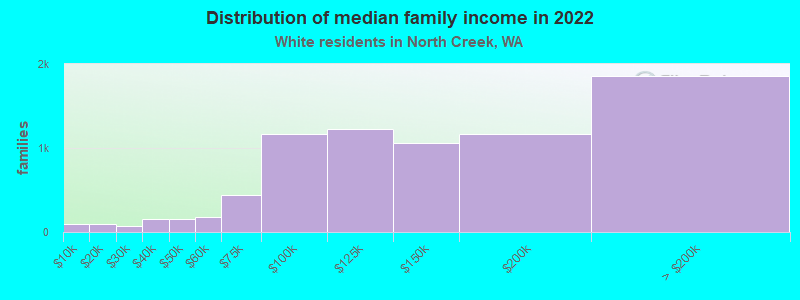
Median family income in North Creek in 2022:| North Creek: | $147,139 |
| Washington: | $112,511 |
Number of families with income < $10k:| North Creek: | 1.2% (92) |
| State: | 2.4% (33,676) |
Number of families with income $10k - 20k:| North Creek: | 1.3% (98) |
| State: | 2.0% (28,228) |
Number of families with income $20k - 30k:| North Creek: | 0.9% (66) |
| State: | 2.9% (39,288) |
Number of families with income $30k - 40k:| North Creek: | 2.0% (149) |
| State: | 3.6% (50,190) |
Number of families with income $40k - 50k:| North Creek: | 2.0% (153) |
| State: | 4.6% (63,009) |
Number of families with income $50k - 60k:| North Creek: | 2.4% (184) |
| Washington: | 5.0% (69,270) |
Number of families with income $60k - 75k:| North Creek: | 5.7% (437) |
| Washington: | 8.2% (112,369) |
Number of families with income $75k - 100k:| North Creek: | 15.2% (1,162) |
| State: | 14.1% (194,214) |
Number of families with income $100k - 125k:| North Creek: | 16.1% (1,232) |
| State: | 13.2% (182,184) |
Number of families with income $125k - 150k:| North Creek: | 13.8% (1,058) |
| Washington: | 9.5% (130,928) |
Number of families with income $150k - 200k:| North Creek: | 15.2% (1,163) |
| Washington: | 13.7% (188,621) |
Number of families with income > $200k:| North Creek: | 24.3% (1,861) |
| State: | 20.8% (285,982) |
Median non-family income in North Creek in 2022:| North Creek: | $78,792 |
| State: | $56,103 |
Change in median non-family income between 2000 and 2022:| North Creek, Washington: | +87.4% |
| State: | +87.7% |
Median per capita income in North Creek in 2022:| North Creek: | $60,701 |
| Washington: | $55,212 |
Change in median per capita income between 2000 and 2022:| North Creek, Washington: | +128.1% |
| State: | +123.8% |
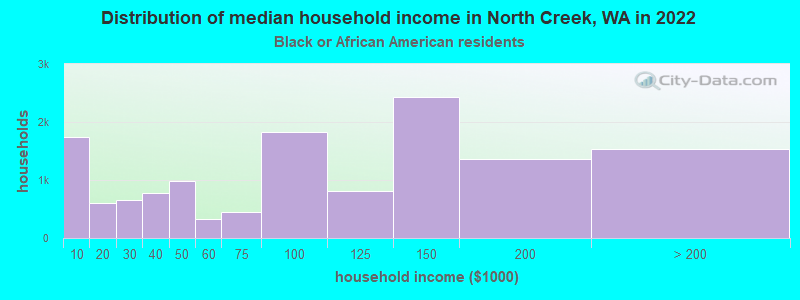
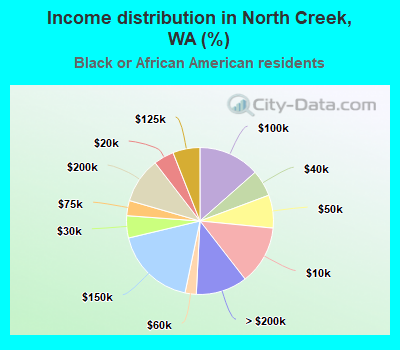
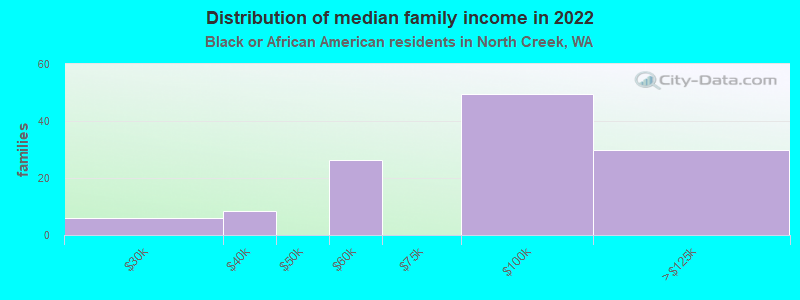
Income statistics for Black or African American residents
Median household income in North Creek, WA in 2022:| North Creek: | $115,613 |
| State: | $68,202 |
Change in median household income between 2000 and 2022:| North Creek, Washington: | +93.7% |
| State: | +89.9% |
Number of households with income < $10k:| North Creek: | 12.9% (1,745) |
| State: | 7.2% (8,014) |
Number of households with income $10k - 20k:| North Creek: | 4.5% (602) |
| Washington: | 8.0% (8,904) |
Number of households with income $20k - 30k:| North Creek: | 4.9% (661) |
| State: | 7.4% (8,207) |
Number of households with income $30k - 40k:| North Creek: | 5.8% (783) |
| State: | 5.6% (6,220) |
Number of households with income $40k - 50k:| North Creek: | 7.3% (980) |
| Washington: | 9.5% (10,585) |
Number of households with income $50k - 60k:| North Creek: | 2.5% (332) |
| State: | 7.3% (8,078) |
Number of households with income $60k - 75k:| North Creek: | 3.3% (448) |
| State: | 8.7% (9,704) |
Number of households with income $75k - 100k:| North Creek: | 13.5% (1,820) |
| State: | 12.9% (14,315) |
Number of households with income $100k - 125k:| North Creek: | 6.0% (807) |
| State: | 7.7% (8,592) |
Number of households with income $125k - 150k:| North Creek: | 18.0% (2,428) |
| State: | 8.9% (9,840) |
Number of households with income $150k - 200k:| North Creek: | 10.1% (1,357) |
| State: | 7.6% (8,434) |
Number of households with income > $200k:| North Creek: | 11.3% (1,527) |
| State: | 9.1% (10,075) |
Aggregate household income in North Creek in 2022: $37,056,458
Median family income in North Creek in 2022:| North Creek: | $118,730 |
| State: | $82,165 |
Number of families with income $20k - 30k:| North Creek: | 4.9% (6) |
| State: | 4.7% (3,151) |
Number of families with income $30k - 40k:| North Creek: | 6.9% (8) |
| State: | 5.3% (3,525) |
Number of families with income $50k - 60k:| North Creek: | 21.9% (26) |
| State: | 7.0% (4,687) |
Number of families with income $75k - 100k:| North Creek: | 41.3% (49) |
| State: | 14.8% (9,876) |
Number of families with income $100k - 125k:| North Creek: | 25.0% (30) |
| State: | 9.0% (6,018) |
Median non-family income in North Creek in 2022:| North Creek: | $119,575 |
| State: | $49,169 |
Change in median non-family income between 2000 and 2022:| North Creek, Washington: | +67.8% |
| Washington: | +87.7% |
Median per capita income in North Creek in 2022:| North Creek: | $70,268 |
| State: | $38,209 |
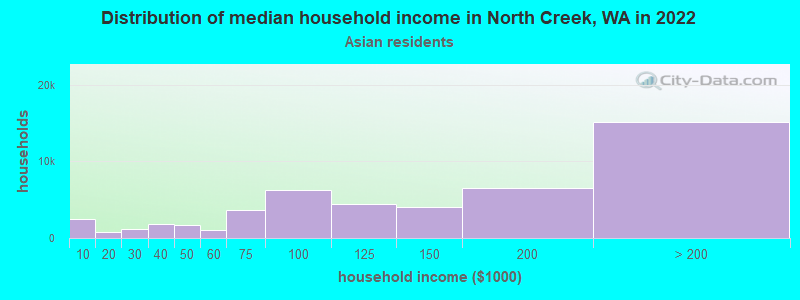
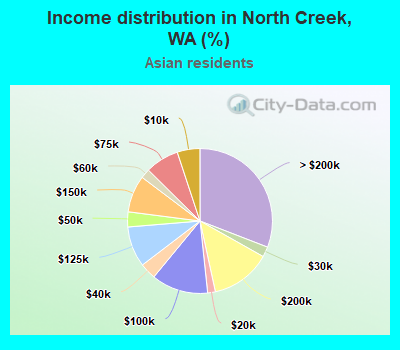
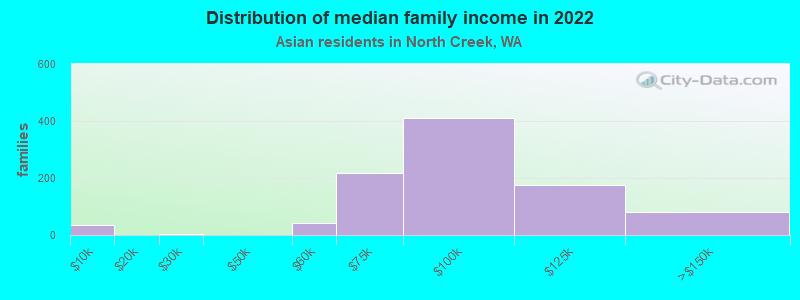
Income statistics for Asian residents
Median household income in North Creek, WA in 2022:| North Creek: | $174,476 |
| State: | $125,692 |
Change in median household income between 2000 and 2022:| North Creek, Washington: | +145.0% |
| Washington: | +164.5% |
Number of households with income < $10k:| North Creek: | 5.1% (2,477) |
| Washington: | 4.9% (14,099) |
Number of households with income $10k - 20k:| North Creek: | 1.7% (843) |
| State: | 3.5% (9,873) |
Number of households with income $20k - 30k:| North Creek: | 2.3% (1,115) |
| State: | 2.9% (8,352) |
Number of households with income $30k - 40k:| North Creek: | 3.6% (1,779) |
| State: | 4.0% (11,415) |
Number of households with income $40k - 50k:| North Creek: | 3.3% (1,639) |
| State: | 4.0% (11,421) |
Number of households with income $50k - 60k:| North Creek: | 2.1% (1,034) |
| State: | 4.2% (12,100) |
Number of households with income $60k - 75k:| North Creek: | 7.5% (3,690) |
| Washington: | 6.3% (17,903) |
Number of households with income $75k - 100k:| North Creek: | 12.7% (6,200) |
| State: | 10.4% (29,663) |
Number of households with income $100k - 125k:| North Creek: | 9.1% (4,438) |
| Washington: | 9.4% (26,839) |
Number of households with income $125k - 150k:| North Creek: | 8.3% (4,041) |
| State: | 8.5% (24,200) |
Number of households with income $150k - 200k:| North Creek: | 13.4% (6,580) |
| Washington: | 12.6% (35,976) |
Number of households with income > $200k:| North Creek: | 30.9% (15,119) |
| State: | 29.2% (83,109) |
Aggregate household income in North Creek in 2022: $389,418,847
Median family income in North Creek in 2022:| North Creek: | $165,169 |
| State: | $143,595 |
Number of families with income < $10k:| North Creek: | 3.7% (36) |
| State: | 2.9% (5,479) |
Number of families with income $20k - 30k:| North Creek: | 0.2% (2) |
| State: | 1.9% (3,558) |
Number of families with income $50k - 60k:| North Creek: | 4.4% (42) |
| State: | 4.1% (7,663) |
Number of families with income $60k - 75k:| North Creek: | 22.4% (216) |
| State: | 5.1% (9,490) |
Number of families with income $75k - 100k:| North Creek: | 42.7% (412) |
| State: | 11.7% (21,919) |
Number of families with income $100k - 125k:| North Creek: | 18.2% (175) |
| State: | 9.3% (17,280) |
Number of families with income $125k - 150k:| North Creek: | 8.3% (80) |
| State: | 8.4% (15,602) |
Median non-family income in North Creek in 2022:| North Creek: | $150,196 |
| State: | $84,971 |
Change in median non-family income between 2000 and 2022:| North Creek, Washington: | +119.9% |
| State: | +211.1% |
Median per capita income in North Creek in 2022:| North Creek: | $73,285 |
| State: | $67,666 |
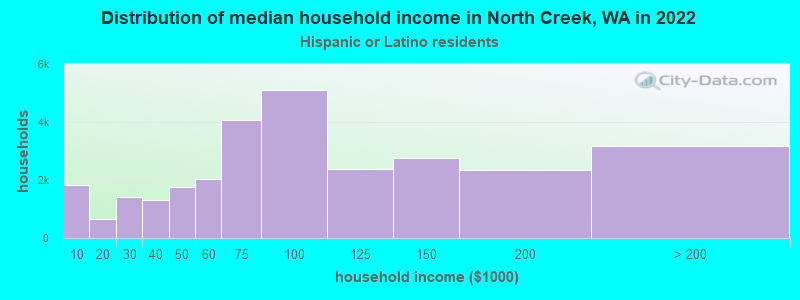
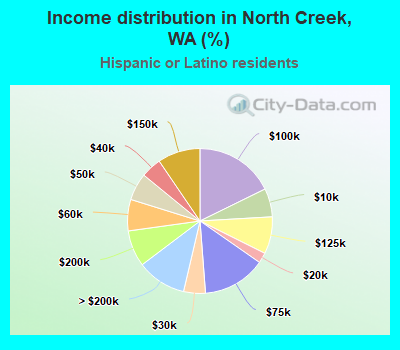
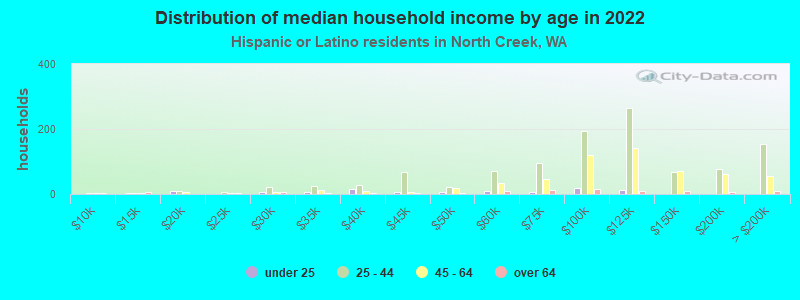
Income statistics for Hispanic or Latino residents
Median household income in North Creek, WA in 2022:| North Creek: | $101,720 |
| Washington: | $74,770 |
Change in median household income between 2000 and 2022:| North Creek, Washington: | +74.5% |
| State: | +128.3% |
Number of households with income < $10k:| North Creek: | 6.4% (1,835) |
| Washington: | 4.9% (14,456) |
Number of households with income $10k - 20k:| North Creek: | 2.3% (671) |
| State: | 5.3% (15,449) |
Number of households with income $20k - 30k:| North Creek: | 4.9% (1,404) |
| Washington: | 6.8% (20,016) |
Number of households with income $30k - 40k:| North Creek: | 4.6% (1,323) |
| State: | 7.7% (22,548) |
Number of households with income $40k - 50k:| North Creek: | 6.1% (1,756) |
| State: | 7.3% (21,450) |
Number of households with income $50k - 60k:| North Creek: | 7.0% (2,021) |
| State: | 7.7% (22,744) |
Number of households with income $60k - 75k:| North Creek: | 14.1% (4,066) |
| Washington: | 10.5% (30,737) |
Number of households with income $75k - 100k:| North Creek: | 17.7% (5,117) |
| State: | 14.9% (43,843) |
Number of households with income $100k - 125k:| North Creek: | 8.3% (2,387) |
| State: | 11.1% (32,554) |
Number of households with income $125k - 150k:| North Creek: | 9.5% (2,744) |
| State: | 7.4% (21,624) |
Number of households with income $150k - 200k:| North Creek: | 8.1% (2,336) |
| Washington: | 7.3% (21,360) |
Number of households with income > $200k:| North Creek: | 11.0% (3,187) |
| Washington: | 9.2% (27,055) |
Aggregate household income in North Creek in 2022: $107,875,516
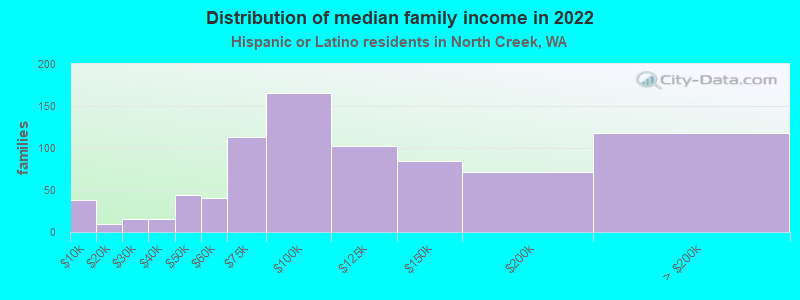
Median family income in North Creek in 2022:| North Creek: | $90,660 |
| State: | $76,866 |
Number of families with income < $10k:| North Creek: | 4.6% (38) |
| State: | 4.4% (9,443) |
Number of families with income $10k - 20k:| North Creek: | 1.1% (9) |
| State: | 3.5% (7,524) |
Number of families with income $20k - 30k:| North Creek: | 1.8% (15) |
| State: | 5.6% (12,052) |
Number of families with income $30k - 40k:| North Creek: | 1.9% (15) |
| State: | 8.3% (17,803) |
Number of families with income $40k - 50k:| North Creek: | 5.4% (44) |
| State: | 7.7% (16,361) |
Number of families with income $50k - 60k:| North Creek: | 5.0% (41) |
| State: | 7.9% (16,852) |
Number of families with income $60k - 75k:| North Creek: | 13.9% (113) |
| Washington: | 11.4% (24,342) |
Number of families with income $75k - 100k:| North Creek: | 20.4% (166) |
| State: | 14.4% (30,698) |
Number of families with income $100k - 125k:| North Creek: | 12.4% (102) |
| Washington: | 11.4% (24,331) |
Number of families with income $125k - 150k:| North Creek: | 10.3% (84) |
| State: | 7.5% (16,099) |
Number of families with income $150k - 200k:| North Creek: | 8.7% (71) |
| State: | 8.2% (17,551) |
Number of families with income > $200k:| North Creek: | 14.5% (118) |
| State: | 9.7% (20,653) |
Median non-family income in North Creek in 2022:| North Creek: | $83,092 |
| State: | $54,173 |
Change in median non-family income between 2000 and 2022:| North Creek, Washington: | +122.3% |
| Washington: | +105.8% |
Median per capita income in North Creek in 2022:| North Creek: | $34,053 |
| State: | $28,252 |
Change in median per capita income between 2000 and 2022:| North Creek, Washington: | +89.2% |
| State: | +150.2% |
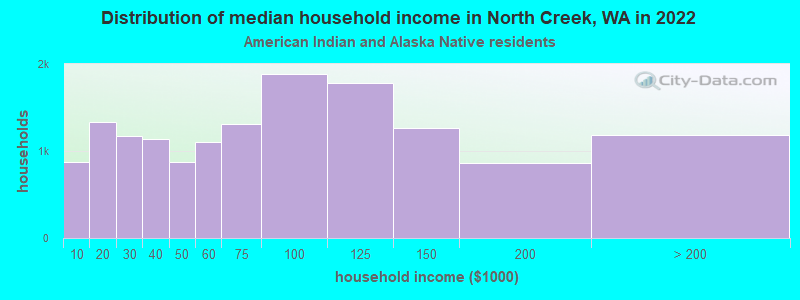
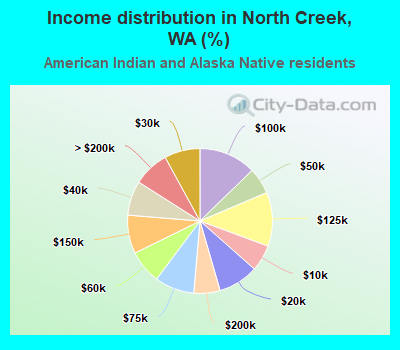
Income statistics for American Indian and Alaska Native residents
Median household income in North Creek, WA in 2022:| North Creek: | $115,791 |
| Washington: | $71,255 |
Number of households with income < $10k:| North Creek: | 5.9% (870) |
| State: | 5.9% (1,768) |
Number of households with income $10k - 20k:| North Creek: | 9.0% (1,328) |
| Washington: | 8.9% (2,694) |
Number of households with income $20k - 30k:| North Creek: | 8.0% (1,175) |
| Washington: | 8.0% (2,412) |
Number of households with income $30k - 40k:| North Creek: | 7.7% (1,138) |
| State: | 7.7% (2,327) |
Number of households with income $40k - 50k:| North Creek: | 5.9% (870) |
| State: | 5.8% (1,755) |
Number of households with income $50k - 60k:| North Creek: | 7.5% (1,107) |
| State: | 7.5% (2,259) |
Number of households with income $60k - 75k:| North Creek: | 8.8% (1,305) |
| State: | 8.8% (2,669) |
Number of households with income $75k - 100k:| North Creek: | 12.7% (1,881) |
| State: | 12.8% (3,861) |
Number of households with income $100k - 125k:| North Creek: | 12.0% (1,776) |
| Washington: | 12.0% (3,618) |
Number of households with income $125k - 150k:| North Creek: | 8.6% (1,268) |
| State: | 8.6% (2,580) |
Number of households with income $150k - 200k:| North Creek: | 5.9% (867) |
| State: | 5.9% (1,774) |
Number of households with income > $200k:| North Creek: | 8.0% (1,187) |
| Washington: | 8.1% (2,447) |
Aggregate household income in North Creek in 2022: $3,917,154
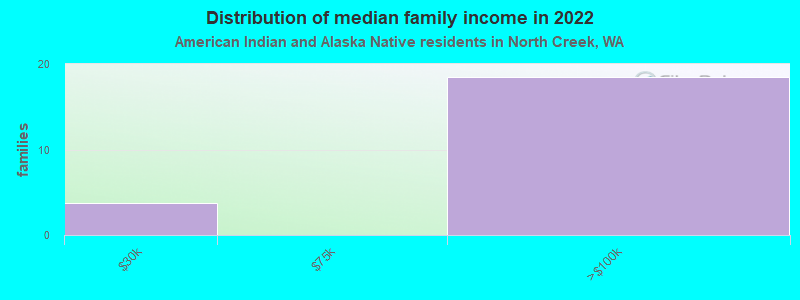
Median family income in North Creek in 2022:| North Creek: | $182,633 |
| State: | $79,010 |
Number of families with income $20k - 30k:| North Creek: | 16.7% (4) |
| Washington: | 6.2% (1,258) |
Number of families with income $75k - 100k:| North Creek: | 83.3% (18) |
| Washington: | 13.1% (2,669) |
Median non-family income in North Creek in 2022:| North Creek: | $180,156 |
| Washington: | $35,591 |
Median per capita income in North Creek in 2022:| North Creek: | $37,638 |
| State: | $27,053 |
Change in median per capita income between 2000 and 2022:| North Creek, Washington: | +85.4% |
| State: | +98.6% |
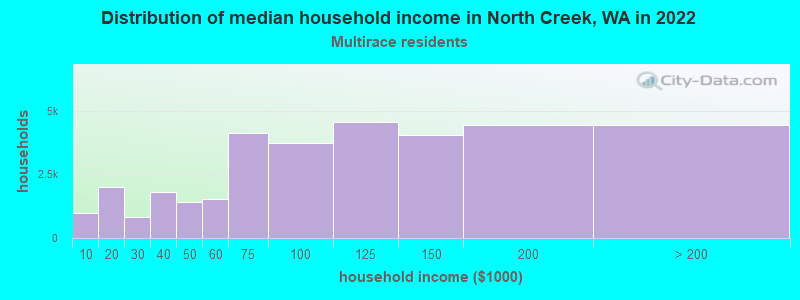
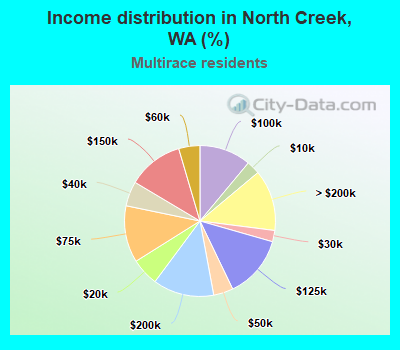
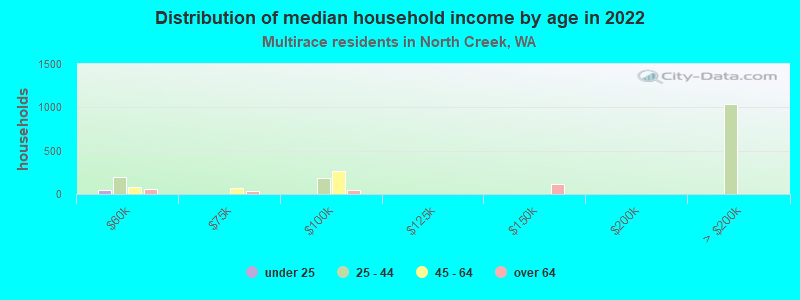
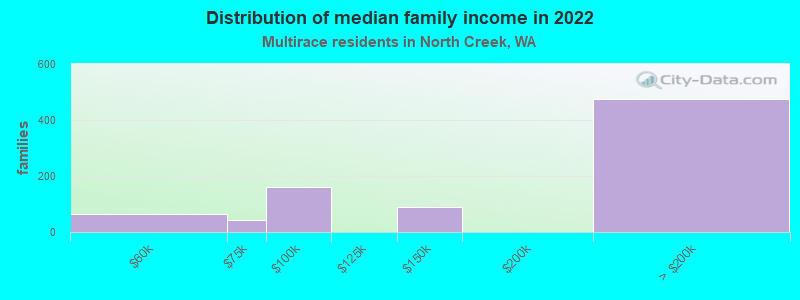
Income statistics for Multirace residents
Median household income in North Creek, WA in 2022:| North Creek: | $142,653 |
| Washington: | $84,303 |
Change in median household income between 2000 and 2022:| North Creek, Washington: | +103.5% |
| State: | +125.7% |
Number of households with income < $10k:| North Creek: | 2.9% (971) |
| State: | 4.3% (12,040) |
Number of households with income $10k - 20k:| North Creek: | 5.9% (1,999) |
| Washington: | 6.6% (18,437) |
Number of households with income $20k - 30k:| North Creek: | 2.4% (818) |
| State: | 5.2% (14,559) |
Number of households with income $30k - 40k:| North Creek: | 5.3% (1,796) |
| State: | 6.7% (18,491) |
Number of households with income $40k - 50k:| North Creek: | 4.2% (1,428) |
| State: | 6.3% (17,459) |
Number of households with income $50k - 60k:| North Creek: | 4.5% (1,541) |
| State: | 6.9% (19,086) |
Number of households with income $60k - 75k:| North Creek: | 12.2% (4,126) |
| State: | 9.1% (25,310) |
Number of households with income $75k - 100k:| North Creek: | 11.1% (3,746) |
| State: | 13.5% (37,493) |
Number of households with income $100k - 125k:| North Creek: | 13.4% (4,554) |
| State: | 10.7% (29,626) |
Number of households with income $125k - 150k:| North Creek: | 11.9% (4,033) |
| State: | 8.6% (23,899) |
Number of households with income $150k - 200k:| North Creek: | 13.1% (4,436) |
| Washington: | 10.2% (28,214) |
Number of households with income > $200k:| North Creek: | 13.1% (4,443) |
| Washington: | 11.9% (32,947) |
Aggregate household income in North Creek in 2022: $134,882,863
Median family income in North Creek in 2022:| North Creek: | $148,786 |
| State: | $95,629 |
Number of families with income $50k - 60k:| North Creek: | 8.0% (66) |
| State: | 5.6% (9,922) |
Number of families with income $60k - 75k:| North Creek: | 5.1% (42) |
| State: | 9.7% (17,113) |
Number of families with income $75k - 100k:| North Creek: | 19.2% (160) |
| State: | 13.6% (23,984) |
Number of families with income $125k - 150k:| North Creek: | 10.6% (88) |
| State: | 10.5% (18,481) |
Number of families with income > $200k:| North Creek: | 57.1% (475) |
| State: | 14.4% (25,289) |
Median non-family income in North Creek in 2022:| North Creek: | $82,716 |
| State: | $56,573 |
Change in median non-family income between 2000 and 2022:| North Creek, Washington: | +128.2% |
| State: | +115.0% |
Median per capita income in North Creek in 2022:| North Creek: | $31,792 |
| State: | $32,496 |
Change in median per capita income between 2000 and 2022:| North Creek, Washington: | +128.0% |
| State: | +156.8% |
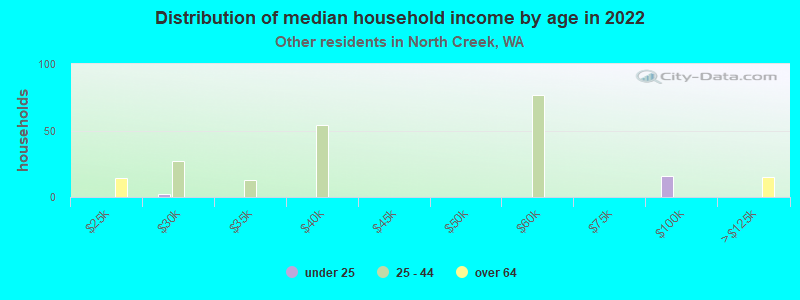
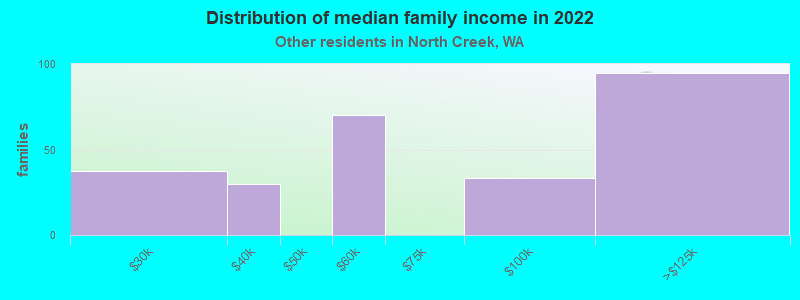
Income statistics for other residents
Number of households with income < $10k:| North Creek: | 6.6% (25) |
| State: | 5.3% (6,540) |
Number of households with income $10k - 20k:| North Creek: | 2.4% (9) |
| State: | 6.0% (7,385) |
Number of households with income $20k - 30k:| North Creek: | 5.0% (19) |
| State: | 7.5% (9,289) |
Number of households with income $30k - 40k:| North Creek: | 4.7% (18) |
| State: | 8.9% (11,015) |
Number of households with income $40k - 50k:| North Creek: | 8.7% (33) |
| Washington: | 7.6% (9,399) |
Number of households with income $50k - 60k:| North Creek: | 9.0% (34) |
| State: | 7.2% (8,867) |
Number of households with income $60k - 75k:| North Creek: | 14.2% (54) |
| State: | 10.5% (13,032) |
Number of households with income $75k - 100k:| North Creek: | 16.1% (61) |
| State: | 14.6% (18,007) |
Number of households with income $100k - 125k:| North Creek: | 9.8% (37) |
| Washington: | 12.2% (15,128) |
Number of households with income $125k - 150k:| North Creek: | 8.7% (33) |
| Washington: | 5.6% (6,950) |
Number of households with income $150k - 200k:| North Creek: | 6.1% (23) |
| State: | 7.1% (8,749) |
Number of households with income > $200k:| North Creek: | 8.7% (33) |
| Washington: | 7.5% (9,208) |
Aggregate household income in North Creek in 2022: $37,040,498
Median family income in North Creek in 2022:| North Creek: | $68,457 |
| State: | $72,588 |
Number of families with income $20k - 30k:| North Creek: | 14.2% (38) |
| State: | 6.6% (6,293) |
Number of families with income $30k - 40k:| North Creek: | 11.3% (30) |
| Washington: | 9.2% (8,827) |
Number of families with income $50k - 60k:| North Creek: | 26.4% (70) |
| Washington: | 7.7% (7,357) |
Number of families with income $75k - 100k:| North Creek: | 12.5% (33) |
| State: | 14.5% (13,800) |
Number of families with income $100k - 125k:| North Creek: | 35.6% (95) |
| Washington: | 12.9% (12,298) |
Median non-family income in North Creek in 2022:| North Creek: | $64,035 |
| Washington: | $44,777 |
Change in median non-family income between 2000 and 2022:| North Creek, Washington: | +81.2% |
| State: | +84.2% |
Median per capita income in North Creek in 2022:| North Creek: | $34,336 |
| Washington: | $27,542 |
Change in median per capita income between 2000 and 2022:| North Creek, Washington: | +125.7% |
| State: | +167.8% |