The median household income in Northern Cambria, PA in 2022 was $50,377, which was 42.5% less than the median annual income of $71,798 across the entire state of Pennsylvania. Compared to the median income of $24,655 in 2000 this represents an increase of 51.1%. The per capita income in 2022 was $23,872, which means an increase of 45.0% compared to 2000 when it was $13,129.
Whole page based on the data from 2000 / 2022 when the population of Northern Cambria, Pennsylvania was 4,199 / 3,499
Income statistics for all residents
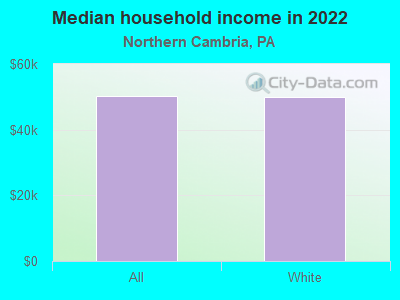
Median household income in Northern Cambria, PA in 2022:
Northern Cambria:
$50,378
State:
$71,798
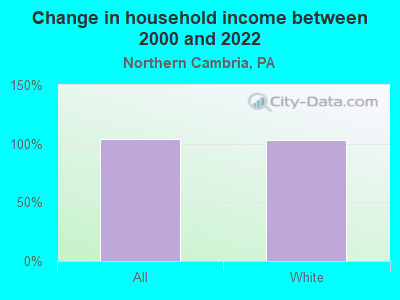
Change in median household income between 2000 and 2022:
Northern Cambria, Pennsylvania:
+104.3%
Pennsylvania:
+79.0%
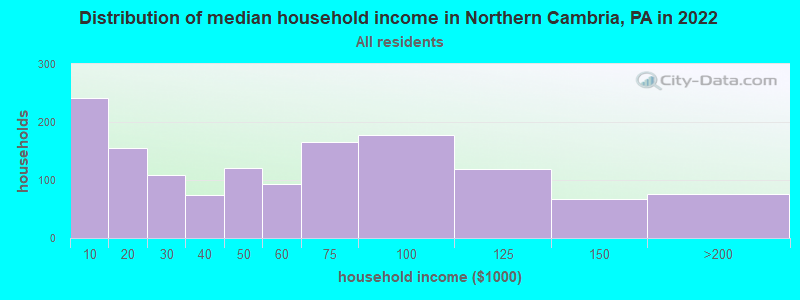
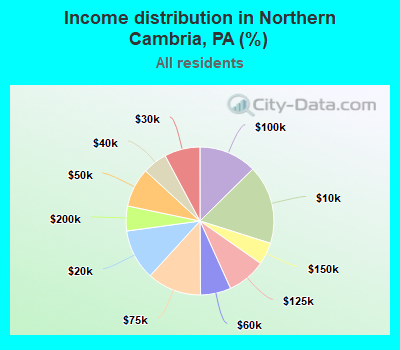
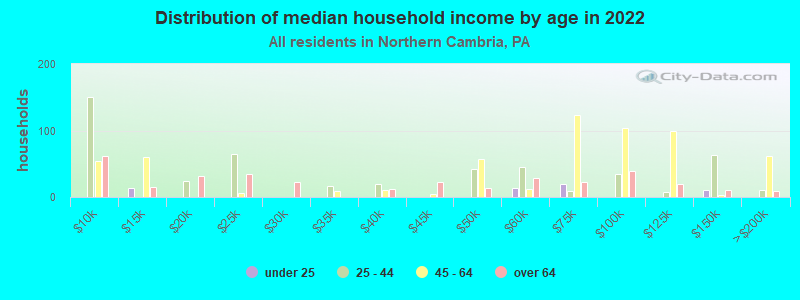
Number of households with income < $10k:
Northern Cambria:
17.2% (241)
State:
5.5% (291,562)
Number of households with income $10k - 20k:
Northern Cambria:
11.1% (155)
State:
7.3% (384,726)
Number of households with income $20k - 30k:
Northern Cambria:
7.8% (109)
State:
7.4% (389,464)
Number of households with income $30k - 40k:
Northern Cambria:
5.4% (75)
State:
7.6% (402,138)
Number of households with income $40k - 50k:
Northern Cambria:
8.6% (120)
Pennsylvania:
7.3% (387,945)
Number of households with income $50k - 60k:
Northern Cambria:
6.6% (93)
State:
7.0% (372,468)
Number of households with income $60k - 75k:
Northern Cambria:
11.9% (166)
State:
9.9% (524,786)
Number of households with income $75k - 100k:
Northern Cambria:
12.7% (177)
State:
12.6% (666,253)
Number of households with income $100k - 125k:
Northern Cambria:
8.5% (119)
Pennsylvania:
9.9% (526,402)
Number of households with income $125k - 150k:
Northern Cambria:
4.9% (68)
Pennsylvania:
6.9% (362,702)
Number of households with income $150k - 200k:
Northern Cambria:
5.4% (76)
State:
8.3% (440,827)
Number of households with income > $200k:
Northern Cambria:
0.0% (0)
State:
10.3% (544,792)
Aggregate household income in Northern Cambria in 2022: $82,081,717
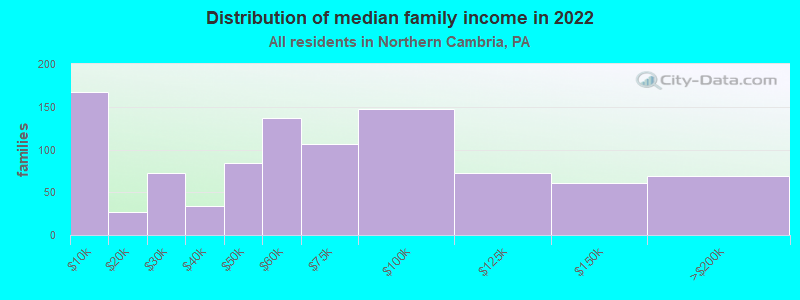
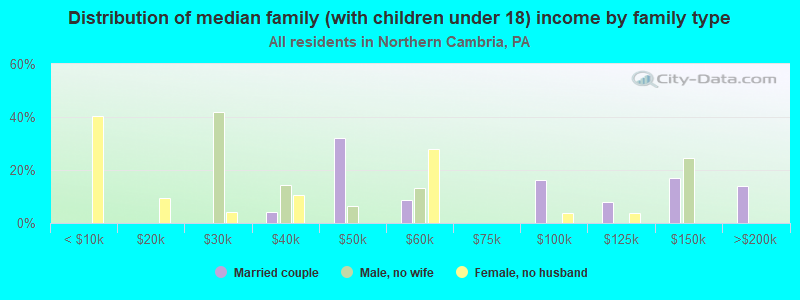
Median family income in Northern Cambria in 2022:
Northern Cambria:
$62,670
Pennsylvania:
$93,029
Number of families with income < $10k:
Northern Cambria:
17.1% (167)
Pennsylvania:
3.1% (101,868)
Number of families with income $10k - 20k:
Northern Cambria:
2.7% (27)
State:
3.5% (115,881)
Number of families with income $20k - 30k:
Northern Cambria:
7.4% (72)
Pennsylvania:
4.8% (156,521)
Number of families with income $30k - 40k:
Northern Cambria:
3.4% (34)
State:
5.8% (191,305)
Number of families with income $40k - 50k:
Northern Cambria:
8.6% (84)
State:
6.4% (211,380)
Number of families with income $50k - 60k:
Northern Cambria:
14.0% (137)
Pennsylvania:
6.4% (209,910)
Number of families with income $60k - 75k:
Northern Cambria:
11.0% (107)
State:
9.7% (318,991)
Number of families with income $75k - 100k:
Northern Cambria:
15.1% (147)
Pennsylvania:
14.0% (461,021)
Number of families with income $100k - 125k:
Northern Cambria:
7.3% (72)
State:
12.2% (400,961)
Number of families with income $125k - 150k:
Northern Cambria:
6.3% (61)
State:
8.8% (288,471)
Number of families with income $150k - 200k:
Northern Cambria:
7.0% (69)
State:
11.2% (367,642)
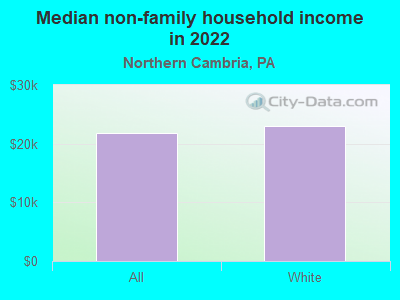
Median non-family income in Northern Cambria in 2022:
Northern Cambria:
$21,742
State:
$42,203
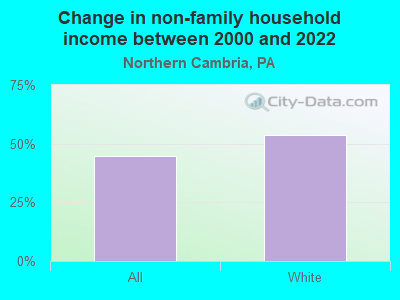
Change in median non-family income between 2000 and 2022:
Northern Cambria, Pennsylvania:
+44.9%
State:
+90.1%
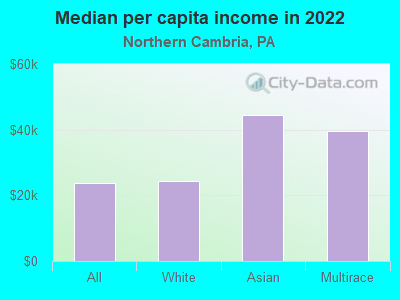
Median per capita income in Northern Cambria in 2022:
Northern Cambria:
$23,873
State:
$41,489
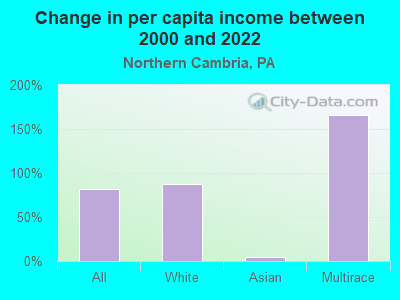
Change in median per capita income between 2000 and 2022:
Northern Cambria, Pennsylvania:
+81.8%
State:
+98.7%
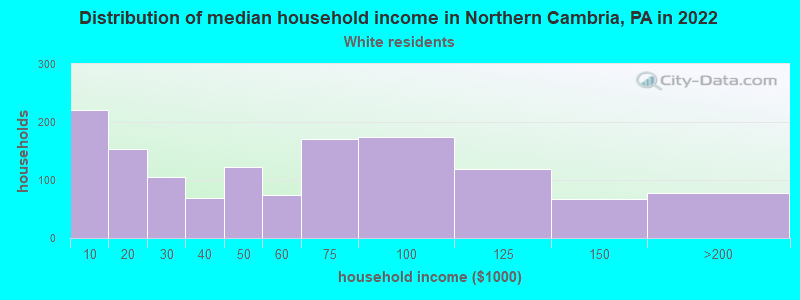
Income statistics for White residents
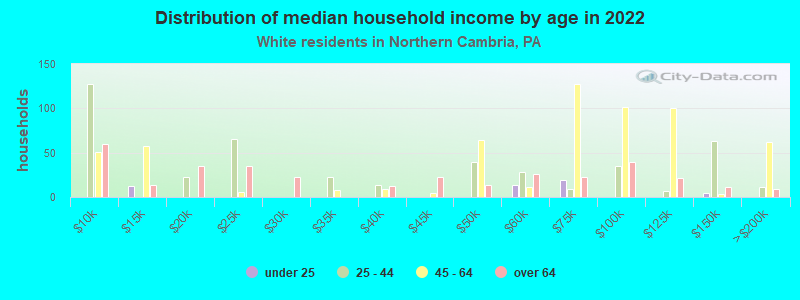
Median household income in Northern Cambria, PA in 2022:
Northern Cambria:
$50,077
State:
$76,765
Change in median household income between 2000 and 2022:
Northern Cambria, Pennsylvania:
+103.1%
State:
+84.3%
Number of households with income < $10k:
Northern Cambria:
16.3% (221)
State:
4.3% (179,792)
Number of households with income $10k - 20k:
Northern Cambria:
11.3% (153)
State:
6.5% (268,738)
Number of households with income $20k - 30k:
Northern Cambria:
7.8% (105)
Pennsylvania:
7.0% (288,138)
Number of households with income $30k - 40k:
Northern Cambria:
5.1% (69)
State:
7.2% (300,208)
Number of households with income $40k - 50k:
Northern Cambria:
9.0% (122)
State:
7.2% (298,756)
Number of households with income $50k - 60k:
Northern Cambria:
5.5% (75)
Pennsylvania:
6.8% (283,251)
Number of households with income $60k - 75k:
Northern Cambria:
12.6% (170)
Pennsylvania:
9.9% (408,159)
Number of households with income $75k - 100k:
Northern Cambria:
12.9% (174)
State:
13.2% (547,809)
Number of households with income $100k - 125k:
Northern Cambria:
8.8% (119)
State:
10.5% (436,652)
Number of households with income $125k - 150k:
Northern Cambria:
5.0% (67)
State:
7.3% (304,132)
Number of households with income $150k - 200k:
Northern Cambria:
5.7% (77)
Pennsylvania:
9.0% (374,658)
Number of households with income > $200k:
Northern Cambria:
0.0% (0)
State:
10.9% (452,618)
Aggregate household income in Northern Cambria in 2022: $80,585,663
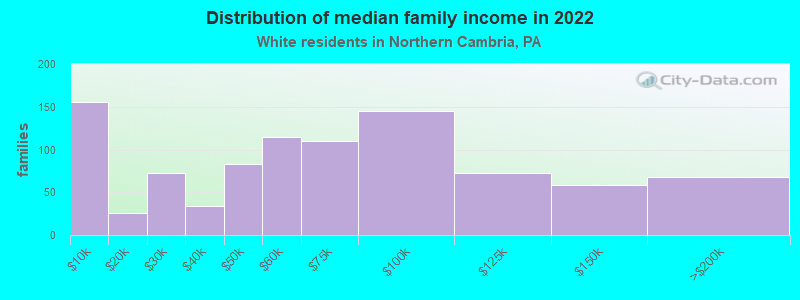
Median family income in Northern Cambria in 2022:
Northern Cambria:
$63,471
Pennsylvania:
$99,396
Number of families with income < $10k:
Northern Cambria:
16.6% (156)
State:
2.2% (56,136)
Number of families with income $10k - 20k:
Northern Cambria:
2.7% (26)
Pennsylvania:
2.7% (69,032)
Number of families with income $20k - 30k:
Northern Cambria:
7.7% (72)
State:
3.9% (100,065)
Number of families with income $30k - 40k:
Northern Cambria:
3.6% (34)
State:
5.2% (134,367)
Number of families with income $40k - 50k:
Northern Cambria:
8.9% (83)
State:
6.0% (154,327)
Number of families with income $50k - 60k:
Northern Cambria:
12.2% (115)
Pennsylvania:
6.1% (157,983)
Number of families with income $60k - 75k:
Northern Cambria:
11.7% (110)
State:
9.6% (249,292)
Number of families with income $75k - 100k:
Northern Cambria:
15.4% (145)
State:
14.7% (379,316)
Number of families with income $100k - 125k:
Northern Cambria:
7.6% (72)
Pennsylvania:
12.9% (333,626)
Number of families with income $125k - 150k:
Northern Cambria:
6.3% (59)
State:
9.4% (243,915)
Number of families with income $150k - 200k:
Northern Cambria:
7.3% (68)
State:
12.2% (314,926)
Median non-family income in Northern Cambria in 2022:
Northern Cambria:
$22,967
State:
$44,251
Change in median non-family income between 2000 and 2022:
Northern Cambria, Pennsylvania:
+53.5%
State:
+94.2%
Median per capita income in Northern Cambria in 2022:
Northern Cambria:
$24,506
Pennsylvania:
$45,306
Change in median per capita income between 2000 and 2022:
Northern Cambria, Pennsylvania:
+86.8%
State:
+105.4%
Income statistics for Asian residents
Number of households with income < $10k:
Northern Cambria:
0.0% (0)
State:
5.8% (9,650)
Number of households with income $10k - 20k:
Northern Cambria:
0.0% (0)
Pennsylvania:
4.3% (7,158)
Number of households with income $20k - 30k:
Northern Cambria:
0.0% (0)
State:
5.7% (9,531)
Number of households with income $30k - 40k:
Northern Cambria:
0.0% (0)
State:
5.7% (9,580)
Number of households with income $40k - 50k:
Northern Cambria:
0.0% (0)
Pennsylvania:
5.4% (9,050)
Number of households with income $50k - 60k:
Northern Cambria:
100.0% (15)
State:
6.1% (10,189)
Number of households with income $60k - 75k:
Northern Cambria:
0.0% (0)
Pennsylvania:
7.8% (13,008)
Number of households with income $75k - 100k:
Northern Cambria:
0.0% (0)
Pennsylvania:
10.1% (16,923)
Number of households with income $100k - 125k:
Northern Cambria:
0.0% (0)
Pennsylvania:
8.8% (14,765)
Number of households with income $125k - 150k:
Northern Cambria:
0.0% (0)
Pennsylvania:
7.5% (12,634)
Number of households with income $150k - 200k:
Northern Cambria:
0.0% (0)
State:
10.0% (16,823)
Number of households with income > $200k:
Northern Cambria:
0.0% (0)
Pennsylvania:
22.9% (38,426)
Aggregate household income in Northern Cambria in 2022: $123,900
Median per capita income in Northern Cambria in 2022:
Northern Cambria:
$44,551
Pennsylvania:
$48,341
Change in median per capita income between 2000 and 2022:
Northern Cambria, Pennsylvania:
+5.3%
State:
+140.6%
Income statistics for Multirace residents
Median per capita income in Northern Cambria in 2022:
Northern Cambria:
$39,447
State:
$27,581
Discuss Northern Cambria, Pennsylvania (PA) on our hugely popular Pennsylvania forum.