The median household income in Northlake, SC in 2022 was $93,829, which was 31.7% greater than the median annual income of $64,115 across the entire state of South Carolina. Compared to the median income of $51,371 in 2000 this represents an increase of 45.3%. The per capita income in 2022 was $51,645, which means an increase of 44.0% compared to 2000 when it was $28,912.
Whole page based on the data from 2000 / 2022 when the population of Northlake, South Carolina was 3,659 / 4,086
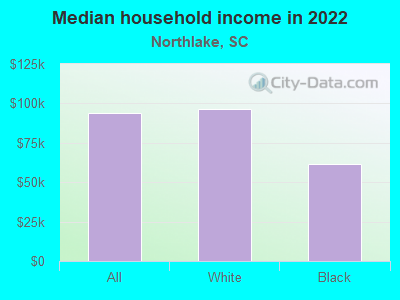
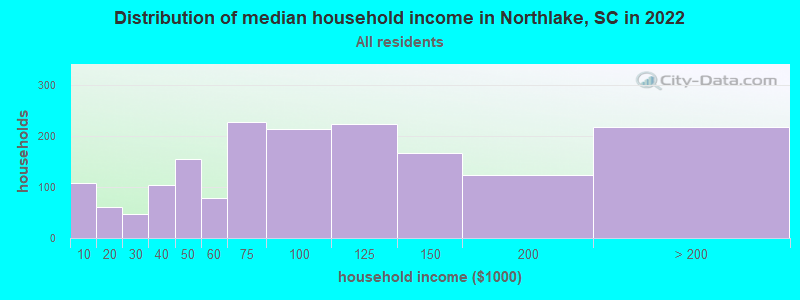
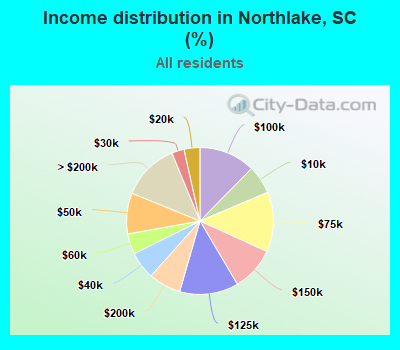
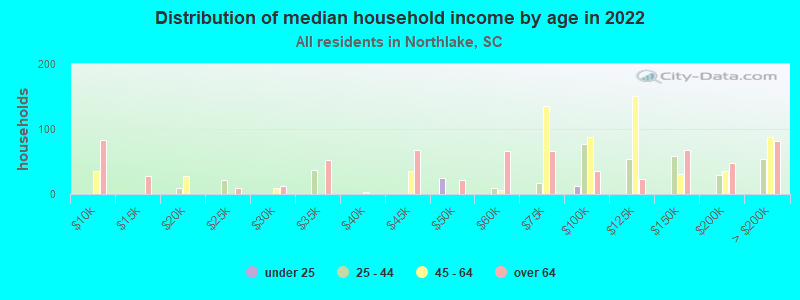
Income statistics for all residents
Median household income in Northlake, SC in 2022:
Northlake:
$93,829
State:
$64,115
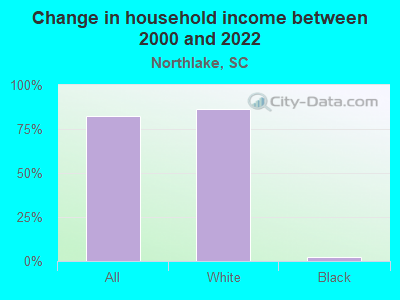
Change in median household income between 2000 and 2022:
Northlake, South Carolina:
+82.6%
South Carolina:
+72.9%
Number of households with income < $10k:
Northlake:
6.3% (108)
South Carolina:
6.1% (130,922)
Number of households with income $10k - 20k:
Northlake:
3.5% (60)
State:
7.9% (168,918)
Number of households with income $20k - 30k:
Northlake:
2.7% (47)
South Carolina:
8.0% (171,564)
Number of households with income $30k - 40k:
Northlake:
6.0% (104)
State:
9.2% (195,662)
Number of households with income $40k - 50k:
Northlake:
9.0% (155)
State:
8.2% (176,179)
Number of households with income $50k - 60k:
Northlake:
4.5% (78)
South Carolina:
7.5% (159,159)
Number of households with income $60k - 75k:
Northlake:
13.2% (227)
State:
9.9% (211,862)
Number of households with income $75k - 100k:
Northlake:
12.4% (213)
State:
13.5% (287,601)
Number of households with income $100k - 125k:
Northlake:
13.0% (223)
State:
9.3% (199,068)
Number of households with income $125k - 150k:
Northlake:
9.7% (167)
South Carolina:
6.2% (133,330)
Number of households with income $150k - 200k:
Northlake:
7.1% (123)
State:
6.6% (141,363)
Number of households with income > $200k:
Northlake:
12.6% (217)
South Carolina:
7.5% (160,452)
Aggregate household income in Northlake in 2022: $210,062,871
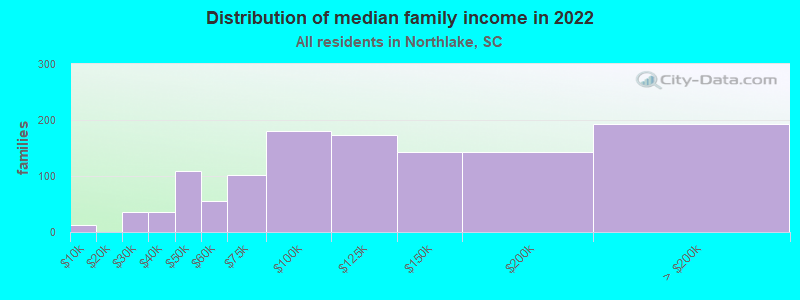
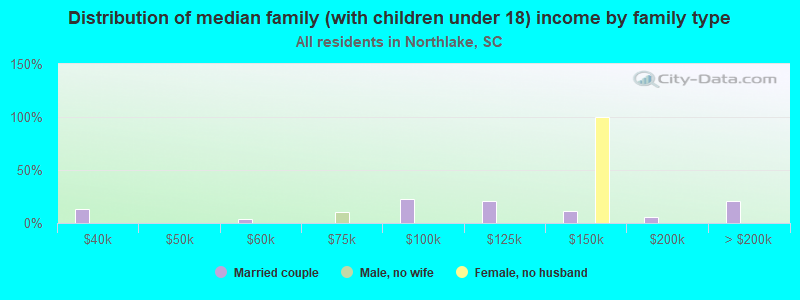
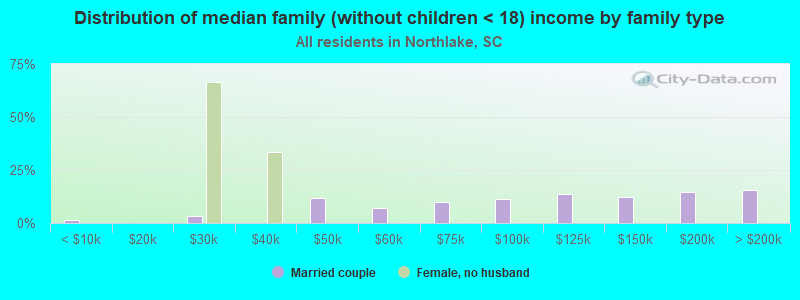
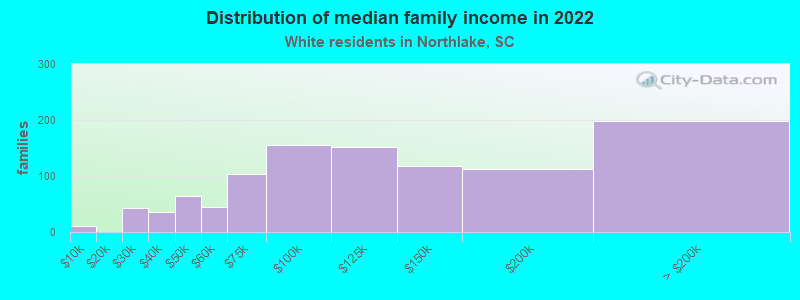
Median family income in Northlake in 2022:
Northlake:
$105,653
State:
$79,886
Number of families with income < $10k:
Northlake:
1.1% (13)
State:
3.7% (51,214)
Number of families with income $20k - 30k:
Northlake:
3.1% (36)
South Carolina:
5.9% (82,415)
Number of families with income $30k - 40k:
Northlake:
3.1% (36)
State:
7.5% (105,475)
Number of families with income $40k - 50k:
Northlake:
9.2% (109)
State:
7.7% (107,666)
Number of families with income $50k - 60k:
Northlake:
4.7% (55)
South Carolina:
7.1% (98,803)
Number of families with income $60k - 75k:
Northlake:
8.6% (101)
State:
9.9% (138,412)
Number of families with income $75k - 100k:
Northlake:
15.3% (181)
South Carolina:
15.4% (214,716)
Number of families with income $100k - 125k:
Northlake:
14.6% (173)
State:
11.4% (159,999)
Number of families with income $125k - 150k:
Northlake:
12.0% (142)
State:
8.0% (112,152)
Number of families with income $150k - 200k:
Northlake:
12.0% (142)
South Carolina:
8.8% (123,525)
Number of families with income > $200k:
Northlake:
16.4% (193)
South Carolina:
10.1% (140,575)
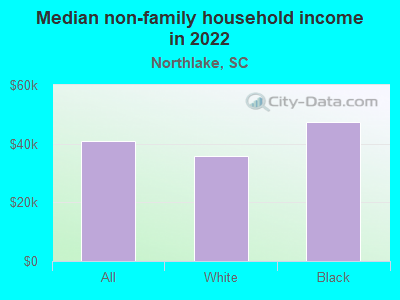
Median non-family income in Northlake in 2022:
Northlake:
$40,882
State:
$38,426
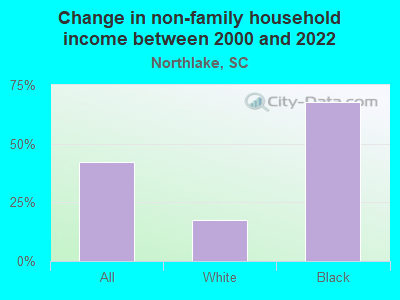
Change in median non-family income between 2000 and 2022:
Northlake, South Carolina:
+42.2%
South Carolina:
+78.7%
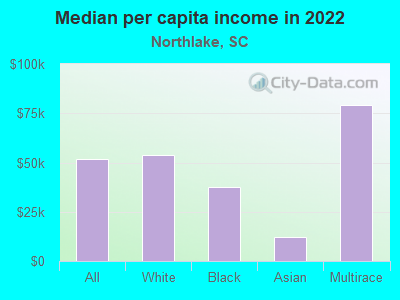
Median per capita income in Northlake in 2022:
Northlake:
$51,645
State:
$36,675
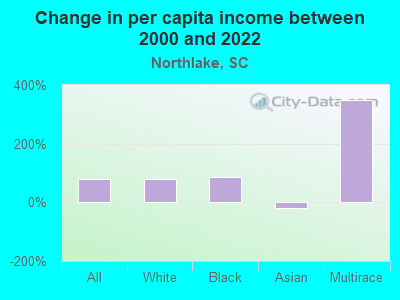
Change in median per capita income between 2000 and 2022:
Northlake, South Carolina:
+78.6%
State:
+95.1%
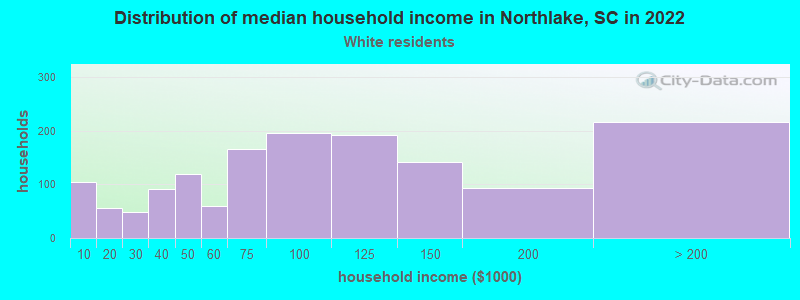
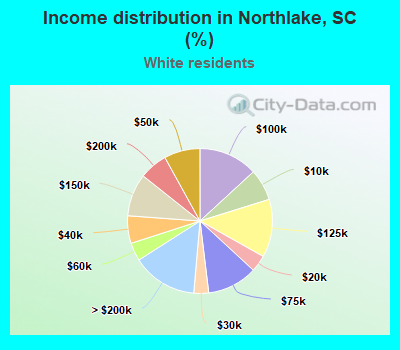
Income statistics for White residents
Median household income in Northlake, SC in 2022:
Northlake:
$96,270
South Carolina:
$73,516
Change in median household income between 2000 and 2022:
Northlake, South Carolina:
+86.4%
State:
+74.8%
Number of households with income < $10k:
Northlake:
7.0% (104)
State:
4.8% (68,379)
Number of households with income $10k - 20k:
Northlake:
3.7% (55)
State:
5.9% (85,105)
Number of households with income $20k - 30k:
Northlake:
3.3% (49)
State:
7.1% (101,178)
Number of households with income $30k - 40k:
Northlake:
6.1% (91)
State:
8.0% (114,877)
Number of households with income $40k - 50k:
Northlake:
8.0% (119)
State:
7.9% (112,749)
Number of households with income $50k - 60k:
Northlake:
4.1% (60)
State:
7.1% (101,835)
Number of households with income $60k - 75k:
Northlake:
11.2% (166)
State:
10.2% (145,879)
Number of households with income $75k - 100k:
Northlake:
13.2% (195)
South Carolina:
14.0% (200,068)
Number of households with income $100k - 125k:
Northlake:
13.0% (192)
State:
10.4% (148,542)
Number of households with income $125k - 150k:
Northlake:
9.5% (141)
State:
7.3% (105,118)
Number of households with income $150k - 200k:
Northlake:
6.3% (93)
South Carolina:
8.0% (114,506)
Number of households with income > $200k:
Northlake:
14.6% (216)
State:
9.3% (133,550)
Aggregate household income in Northlake in 2022: $186,786,492
Median family income in Northlake in 2022:
Northlake:
$102,672
State:
$90,709
Number of families with income < $10k:
Northlake:
1.1% (11)
State:
2.4% (22,376)
Number of families with income $20k - 30k:
Northlake:
4.1% (43)
State:
4.4% (42,131)
Number of families with income $30k - 40k:
Northlake:
3.4% (35)
State:
6.1% (57,510)
Number of families with income $40k - 50k:
Northlake:
6.2% (65)
State:
7.0% (66,712)
Number of families with income $50k - 60k:
Northlake:
4.4% (45)
South Carolina:
6.6% (62,489)
Number of families with income $60k - 75k:
Northlake:
10.0% (104)
South Carolina:
10.0% (94,724)
Number of families with income $75k - 100k:
Northlake:
15.0% (156)
State:
15.5% (147,207)
Number of families with income $100k - 125k:
Northlake:
14.6% (152)
State:
12.5% (118,160)
Number of families with income $125k - 150k:
Northlake:
11.3% (118)
South Carolina:
9.5% (90,395)
Number of families with income $150k - 200k:
Northlake:
10.8% (112)
South Carolina:
10.6% (100,043)
Number of families with income > $200k:
Northlake:
19.1% (199)
State:
12.4% (117,500)
Median non-family income in Northlake in 2022:
Northlake:
$35,918
State:
$42,596
Change in median non-family income between 2000 and 2022:
Northlake, South Carolina:
+17.3%
State:
+74.9%
Median per capita income in Northlake in 2022:
Northlake:
$53,883
State:
$42,728
Change in median per capita income between 2000 and 2022:
Northlake, South Carolina:
+81.2%
State:
+93.4%
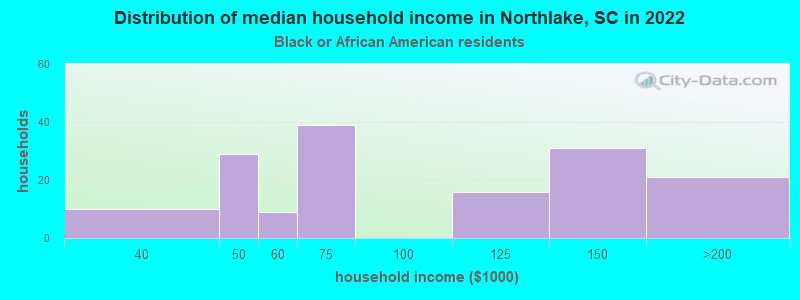
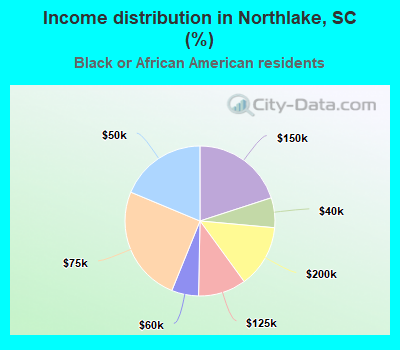
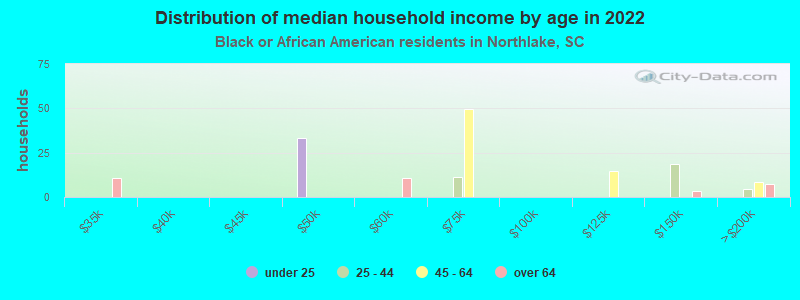
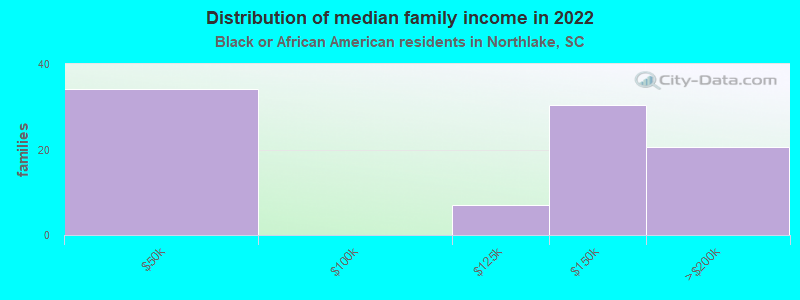
Income statistics for Black or African American residents
Median household income in Northlake, SC in 2022:
Northlake:
$61,743
State:
$44,187
Change in median household income between 2000 and 2022:
Northlake, South Carolina:
+2.5%
State:
+76.5%
Number of households with income < $10k:
Northlake:
0.0% (0)
State:
10.0% (52,303)
Number of households with income $10k - 20k:
Northlake:
0.0% (0)
South Carolina:
13.4% (69,913)
Number of households with income $20k - 30k:
Northlake:
0.0% (0)
State:
10.4% (54,216)
Number of households with income $30k - 40k:
Northlake:
6.5% (10)
State:
12.0% (62,722)
Number of households with income $40k - 50k:
Northlake:
18.7% (29)
State:
9.2% (47,773)
Number of households with income $50k - 60k:
Northlake:
5.8% (9)
South Carolina:
8.3% (43,083)
Number of households with income $60k - 75k:
Northlake:
25.2% (39)
State:
9.3% (48,640)
Number of households with income $75k - 100k:
Northlake:
0.0% (0)
State:
12.2% (63,723)
Number of households with income $100k - 125k:
Northlake:
10.3% (16)
South Carolina:
6.4% (33,117)
Number of households with income $125k - 150k:
Northlake:
20.0% (31)
South Carolina:
3.2% (16,465)
Number of households with income $150k - 200k:
Northlake:
13.5% (21)
State:
3.2% (16,672)
Number of households with income > $200k:
Northlake:
0.0% (0)
South Carolina:
2.3% (12,213)
Aggregate household income in Northlake in 2022: $16,919,763
Median family income in Northlake in 2022:
Northlake:
$127,065
State:
$54,267
Number of families with income $40k - 50k:
Northlake:
37.0% (34)
South Carolina:
9.5% (30,858)
Number of families with income $100k - 125k:
Northlake:
7.7% (7)
South Carolina:
8.6% (27,974)
Number of families with income $125k - 150k:
Northlake:
32.9% (30)
State:
3.9% (12,743)
Number of families with income $150k - 200k:
Northlake:
22.4% (21)
South Carolina:
4.5% (14,809)
Median non-family income in Northlake in 2022:
Northlake:
$47,307
State:
$28,585
Change in median non-family income between 2000 and 2022:
Northlake, South Carolina:
+67.8%
South Carolina:
+100.5%
Median per capita income in Northlake in 2022:
Northlake:
$37,605
State:
$24,863
Change in median per capita income between 2000 and 2022:
Northlake, South Carolina:
+85.5%
South Carolina:
+111.1%
Income statistics for Asian residents
Aggregate household income in Northlake in 2022: $7,060,553
Median per capita income in Northlake in 2022:
Northlake:
$12,348
State:
$48,909
Change in median per capita income between 2000 and 2022:: -21.4%
Northlake, South Carolina:
-21.4%
South Carolina:
+138.1%
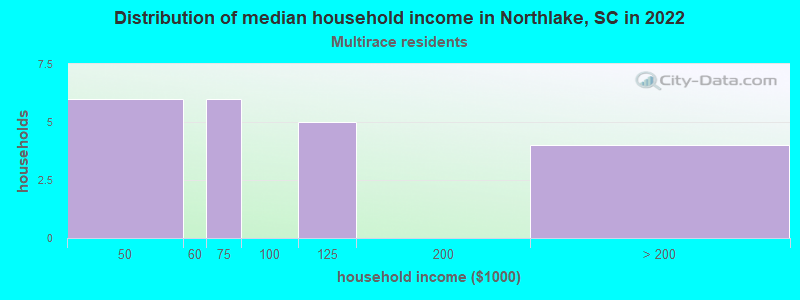
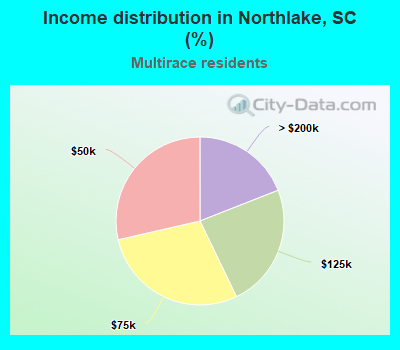
Income statistics for Multirace residents
Number of households with income < $10k:
Northlake:
0.0% (0)
State:
6.9% (6,974)
Number of households with income $10k - 20k:
Northlake:
0.0% (0)
State:
8.0% (8,052)
Number of households with income $20k - 30k:
Northlake:
0.0% (0)
State:
9.9% (9,972)
Number of households with income $30k - 40k:
Northlake:
0.0% (0)
State:
10.0% (10,121)
Number of households with income $40k - 50k:
Northlake:
28.6% (6)
State:
8.1% (8,188)
Number of households with income $50k - 60k:
Northlake:
0.0% (0)
South Carolina:
6.5% (6,530)
Number of households with income $60k - 75k:
Northlake:
28.6% (6)
State:
8.9% (9,021)
Number of households with income $75k - 100k:
Northlake:
0.0% (0)
State:
13.4% (13,544)
Number of households with income $100k - 125k:
Northlake:
23.8% (5)
South Carolina:
9.8% (9,916)
Number of households with income $125k - 150k:
Northlake:
0.0% (0)
State:
6.6% (6,657)
Number of households with income $150k - 200k:
Northlake:
0.0% (0)
State:
5.9% (5,979)
Number of households with income > $200k:
Northlake:
19.0% (4)
State:
6.2% (6,266)
Aggregate household income in Northlake in 2022: $2,333,537
Median per capita income in Northlake in 2022:
Northlake:
$79,310
State:
$26,391
Discuss Northlake, South Carolina (SC) on our hugely popular South Carolina forum.