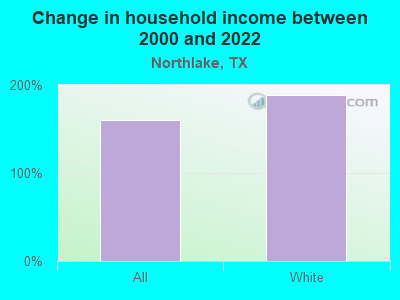
The median household income in Northlake, TX in 2022 was $104,180, which was 30.6% greater than the median annual income of $72,284 across the entire state of Texas. Compared to the median income of $40,000 in 2000 this represents an increase of 61.6%. The per capita income in 2022 was $50,329, which means an increase of 63.2% compared to 2000 when it was $18,517.
Whole page based on the data from 2000 / 2022 when the population of Northlake, Texas was 921 / 6,625
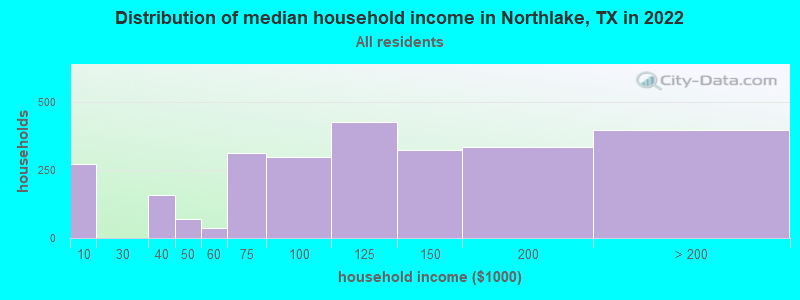
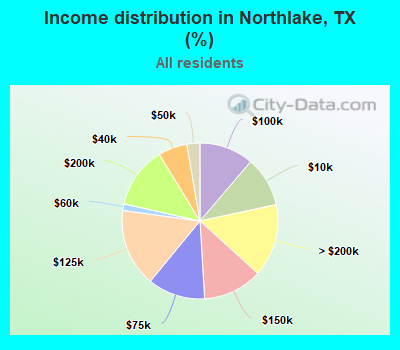
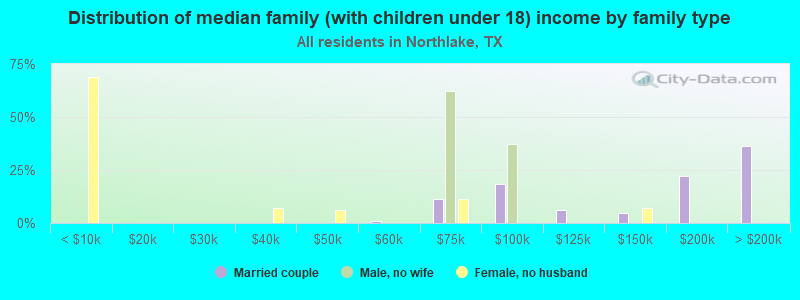
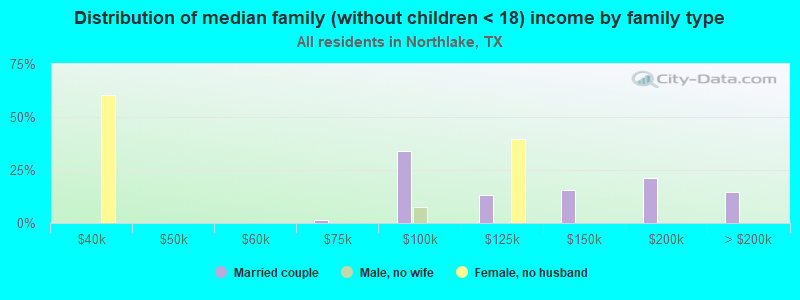
Income statistics for all residents
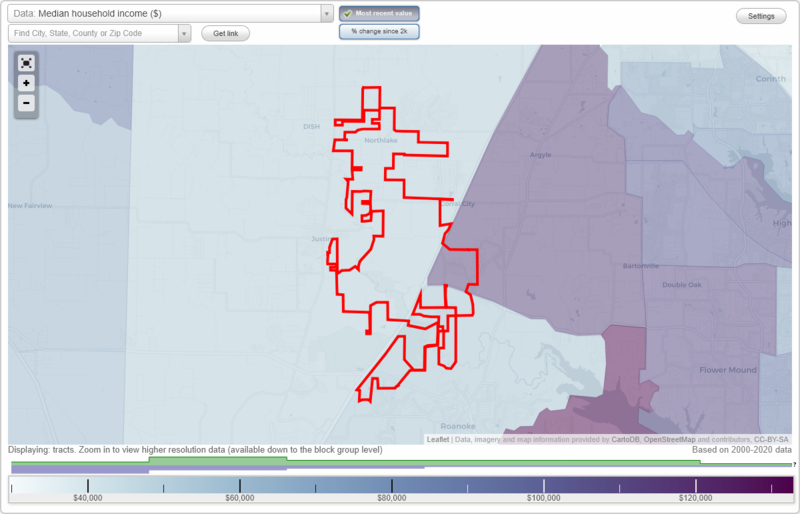
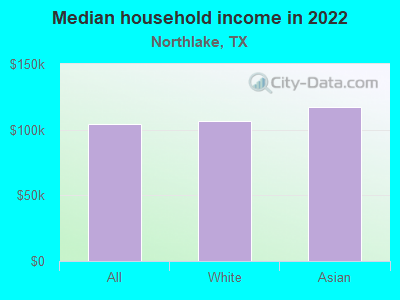
Median household income in Northlake, TX in 2022:
Northlake:
$104,180
State:
$72,284
Number of households with income < $10k:
Northlake:
10.4% (273)
State:
5.5% (611,011)
Number of households with income $10k - 20k:
Northlake:
0.0% (0)
State:
6.7% (743,157)
Number of households with income $20k - 30k:
Northlake:
0.0% (0)
State:
7.2% (803,381)
Number of households with income $30k - 40k:
Northlake:
6.0% (158)
State:
7.8% (866,080)
Number of households with income $40k - 50k:
Northlake:
2.7% (71)
State:
7.3% (810,440)
Number of households with income $50k - 60k:
Northlake:
1.4% (36)
State:
7.2% (799,783)
Number of households with income $60k - 75k:
Northlake:
11.9% (313)
State:
9.9% (1,095,384)
Number of households with income $75k - 100k:
Northlake:
11.3% (296)
State:
12.8% (1,419,057)
Number of households with income $100k - 125k:
Northlake:
16.2% (426)
State:
9.5% (1,054,577)
Number of households with income $125k - 150k:
Northlake:
12.3% (324)
State:
6.7% (741,518)
Number of households with income $150k - 200k:
Northlake:
12.7% (335)
Texas:
8.7% (961,776)
Number of households with income > $200k:
Northlake:
15.1% (397)
State:
10.7% (1,181,544)
Aggregate household income in Northlake in 2022: $326,008,598
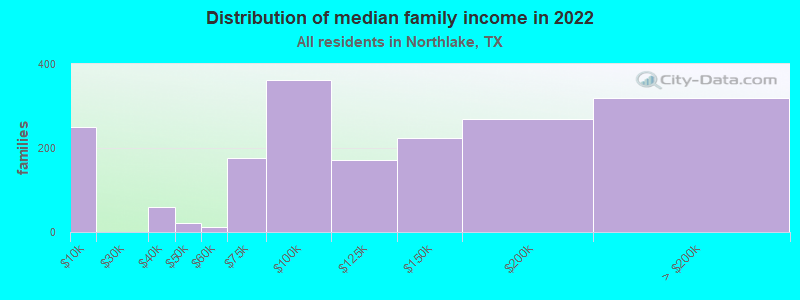
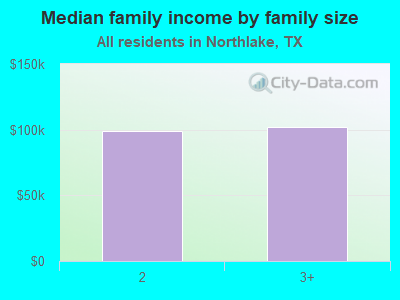
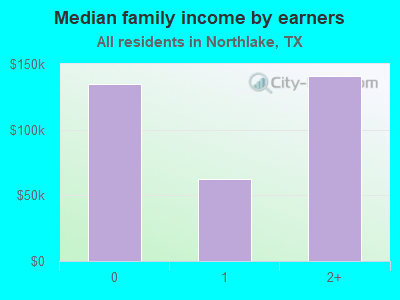
Median family income in Northlake in 2022:
Northlake:
$107,238
Texas:
$86,267
Number of families with income < $10k:
Northlake:
13.4% (249)
State:
4.0% (297,884)
Number of families with income $30k - 40k:
Northlake:
3.2% (60)
State:
6.6% (493,535)
Number of families with income $40k - 50k:
Northlake:
1.2% (22)
Texas:
6.7% (499,663)
Number of families with income $50k - 60k:
Northlake:
0.6% (11)
State:
6.6% (492,203)
Number of families with income $60k - 75k:
Northlake:
9.5% (176)
State:
9.5% (710,229)
Number of families with income $75k - 100k:
Northlake:
19.4% (362)
State:
13.6% (1,015,480)
Number of families with income $100k - 125k:
Northlake:
9.2% (172)
State:
10.7% (797,961)
Number of families with income $125k - 150k:
Northlake:
12.0% (224)
State:
8.1% (602,985)
Number of families with income $150k - 200k:
Northlake:
14.4% (268)
Texas:
10.7% (804,459)
Number of families with income > $200k:
Northlake:
17.1% (319)
Texas:
13.5% (1,013,514)
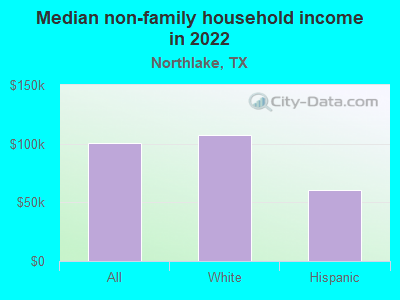
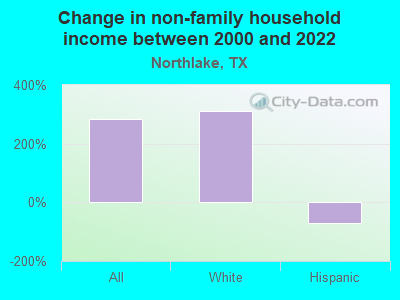
Median non-family income in Northlake in 2022:
Northlake:
$100,490
State:
$45,999
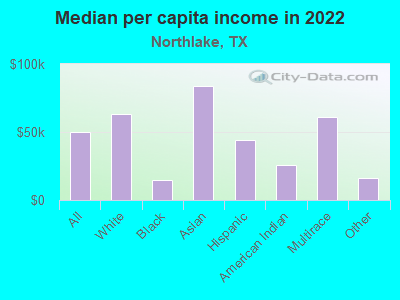
Median per capita income in Northlake in 2022:
Northlake:
$50,329
State:
$38,123
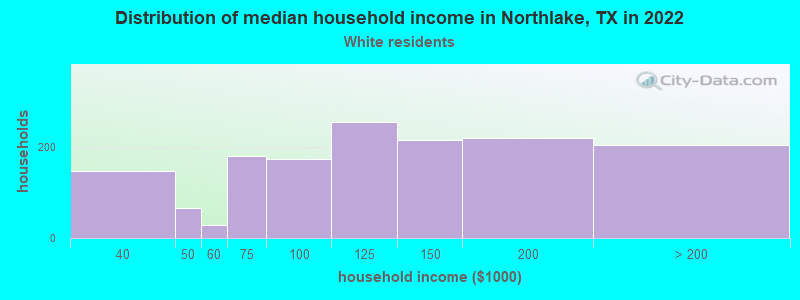
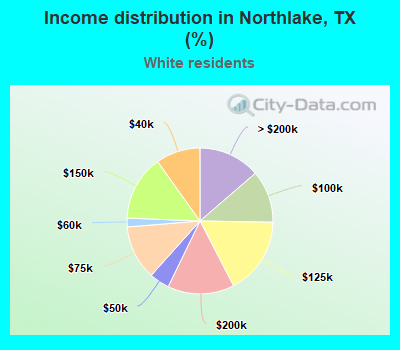
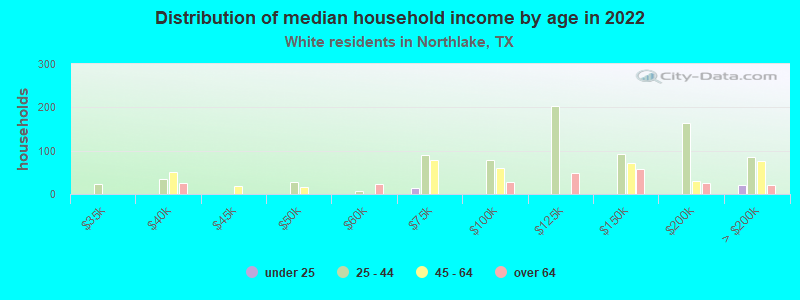
Income statistics for White residents
Median household income in Northlake, TX in 2022:
Northlake:
$106,848
State:
$82,032
Number of households with income < $10k:
Northlake:
0.0% (0)
State:
4.7% (273,716)
Number of households with income $10k - 20k:
Northlake:
0.0% (0)
State:
5.5% (322,702)
Number of households with income $20k - 30k:
Northlake:
0.0% (0)
Texas:
6.2% (363,947)
Number of households with income $30k - 40k:
Northlake:
9.8% (146)
State:
6.8% (399,275)
Number of households with income $40k - 50k:
Northlake:
4.5% (66)
State:
6.5% (383,417)
Number of households with income $50k - 60k:
Northlake:
2.0% (29)
State:
6.6% (388,535)
Number of households with income $60k - 75k:
Northlake:
12.1% (179)
State:
9.7% (566,295)
Number of households with income $75k - 100k:
Northlake:
11.6% (172)
State:
13.0% (760,276)
Number of households with income $100k - 125k:
Northlake:
17.1% (254)
State:
10.2% (597,596)
Number of households with income $125k - 150k:
Northlake:
14.5% (215)
State:
7.4% (436,830)
Number of households with income $150k - 200k:
Northlake:
14.8% (219)
State:
9.9% (583,067)
Number of households with income > $200k:
Northlake:
13.7% (203)
State:
13.5% (792,647)
Aggregate household income in Northlake in 2022: $201,200,542
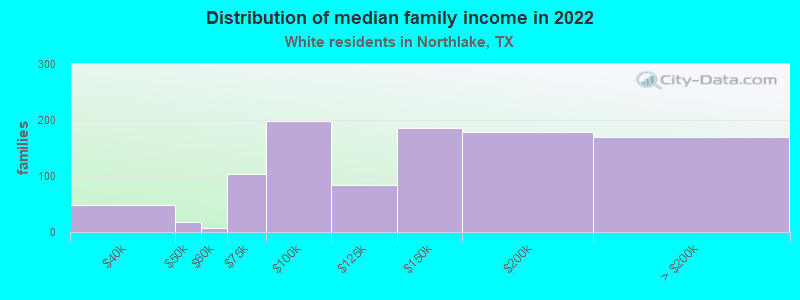
Median family income in Northlake in 2022:
Northlake:
$141,909
State:
$101,788
Number of families with income $30k - 40k:
Northlake:
4.9% (49)
Texas:
5.2% (198,847)
Number of families with income $40k - 50k:
Northlake:
1.7% (17)
State:
5.6% (216,490)
Number of families with income $50k - 60k:
Northlake:
0.8% (8)
Texas:
5.7% (220,689)
Number of families with income $60k - 75k:
Northlake:
10.4% (103)
State:
9.0% (346,106)
Number of families with income $75k - 100k:
Northlake:
20.1% (199)
State:
13.7% (527,363)
Number of families with income $100k - 125k:
Northlake:
8.4% (84)
State:
11.6% (448,411)
Number of families with income $125k - 150k:
Northlake:
18.7% (185)
State:
9.2% (355,798)
Number of families with income $150k - 200k:
Northlake:
18.0% (178)
Texas:
12.5% (480,185)
Number of families with income > $200k:
Northlake:
17.0% (169)
State:
17.6% (677,490)
Median non-family income in Northlake in 2022:
Northlake:
$107,192
State:
$50,587
Median per capita income in Northlake in 2022:
Northlake:
$63,436
State:
$47,740
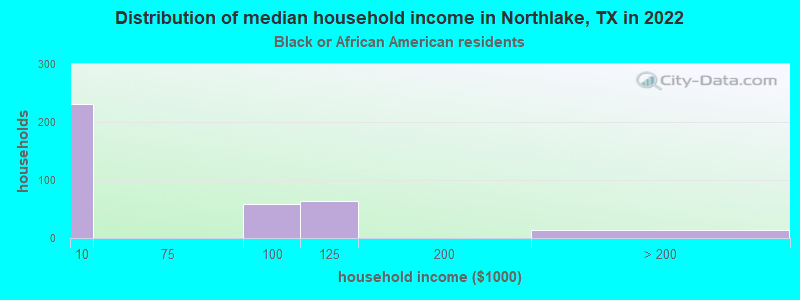
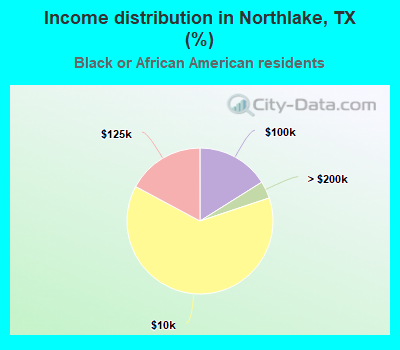
Income statistics for Black or African American residents
Number of households with income < $10k:
Northlake:
62.9% (231)
Texas:
8.9% (126,378)
Number of households with income $10k - 20k:
Northlake:
0.0% (0)
State:
9.9% (140,369)
Number of households with income $20k - 30k:
Northlake:
0.0% (0)
Texas:
8.5% (120,639)
Number of households with income $30k - 40k:
Northlake:
0.0% (0)
State:
9.7% (137,517)
Number of households with income $40k - 50k:
Northlake:
0.0% (0)
State:
8.0% (112,973)
Number of households with income $50k - 60k:
Northlake:
0.0% (0)
State:
8.3% (117,156)
Number of households with income $60k - 75k:
Northlake:
0.0% (0)
State:
10.4% (147,462)
Number of households with income $75k - 100k:
Northlake:
16.1% (59)
State:
11.5% (162,718)
Number of households with income $100k - 125k:
Northlake:
17.2% (63)
Texas:
8.2% (115,829)
Number of households with income $125k - 150k:
Northlake:
0.0% (0)
State:
4.9% (69,556)
Number of households with income $150k - 200k:
Northlake:
0.0% (0)
Texas:
6.4% (90,701)
Number of households with income > $200k:
Northlake:
3.8% (14)
State:
5.5% (77,988)
Aggregate household income in Northlake in 2022: $16,464,024
Median per capita income in Northlake in 2022:
Northlake:
$14,775
State:
$30,490
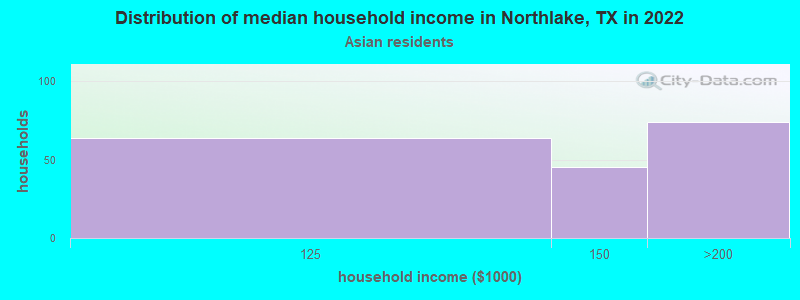
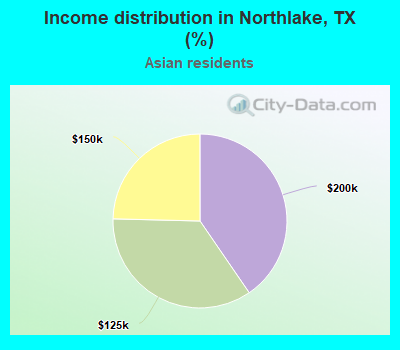
Income statistics for Asian residents
Median household income in Northlake, TX in 2022:
Northlake:
$117,106
State:
$107,673
Number of households with income < $10k:
Northlake:
0.0% (0)
Texas:
5.2% (29,885)
Number of households with income $10k - 20k:
Northlake:
0.0% (0)
State:
4.7% (27,044)
Number of households with income $20k - 30k:
Northlake:
0.0% (0)
State:
4.1% (23,363)
Number of households with income $30k - 40k:
Northlake:
0.0% (0)
Texas:
4.1% (23,309)
Number of households with income $40k - 50k:
Northlake:
0.0% (0)
State:
5.2% (29,826)
Number of households with income $50k - 60k:
Northlake:
0.0% (0)
State:
4.7% (26,512)
Number of households with income $60k - 75k:
Northlake:
0.0% (0)
State:
6.5% (36,905)
Number of households with income $75k - 100k:
Northlake:
0.0% (0)
State:
11.3% (64,350)
Number of households with income $100k - 125k:
Northlake:
35.0% (64)
State:
11.4% (64,714)
Number of households with income $125k - 150k:
Northlake:
24.6% (45)
State:
9.3% (52,719)
Number of households with income $150k - 200k:
Northlake:
40.4% (74)
Texas:
12.5% (70,953)
Number of households with income > $200k:
Northlake:
0.0% (0)
Texas:
21.1% (120,260)
Aggregate household income in Northlake in 2022: $24,775,292
Median family income in Northlake in 2022:
Northlake:
$167,209
State:
$123,328
Number of families with income $150k - 200k:
Northlake:
100.0% (75)
State:
14.7% (64,203)
Median per capita income in Northlake in 2022:
Northlake:
$83,672
Texas:
$48,626
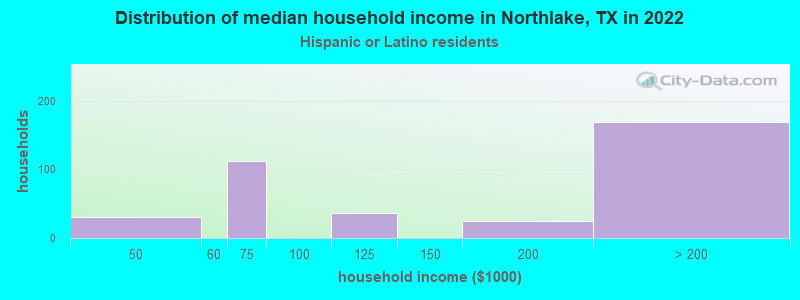
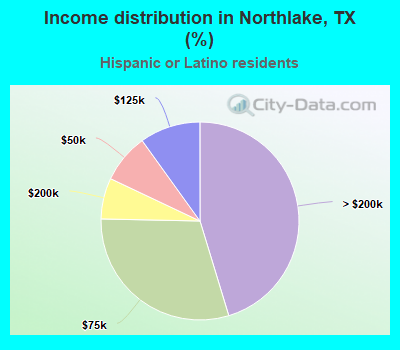
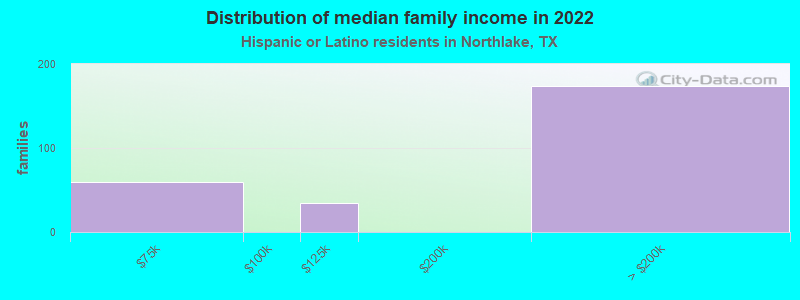
Income statistics for Hispanic or Latino residents
Number of households with income < $10k:
Northlake:
0.0% (0)
State:
5.8% (213,953)
Number of households with income $10k - 20k:
Northlake:
0.0% (0)
Texas:
8.0% (297,456)
Number of households with income $20k - 30k:
Northlake:
0.0% (0)
State:
9.2% (340,166)
Number of households with income $30k - 40k:
Northlake:
0.0% (0)
Texas:
9.5% (354,336)
Number of households with income $40k - 50k:
Northlake:
8.0% (30)
State:
8.8% (327,013)
Number of households with income $50k - 60k:
Northlake:
0.0% (0)
State:
8.3% (308,818)
Number of households with income $60k - 75k:
Northlake:
30.0% (112)
Texas:
10.9% (405,109)
Number of households with income $75k - 100k:
Northlake:
0.0% (0)
State:
13.8% (511,639)
Number of households with income $100k - 125k:
Northlake:
9.9% (37)
Texas:
8.6% (319,728)
Number of households with income $125k - 150k:
Northlake:
0.0% (0)
State:
5.7% (210,932)
Number of households with income $150k - 200k:
Northlake:
6.7% (25)
State:
6.4% (236,055)
Number of households with income > $200k:
Northlake:
45.3% (169)
Texas:
5.1% (189,259)
Aggregate household income in Northlake in 2022: $62,903,737
Median family income in Northlake in 2022:
Northlake:
$229,828
State:
$65,080
Number of families with income $60k - 75k:
Northlake:
22.0% (59)
State:
10.9% (302,688)
Number of families with income $100k - 125k:
Northlake:
12.8% (34)
State:
9.5% (264,007)
Number of families with income > $200k:
Northlake:
65.2% (174)
State:
5.9% (165,129)
Median non-family income in Northlake in 2022:
Northlake:
$60,666
Texas:
$39,934
Change in median non-family income between 2000 and 2022:: -69.7%
Northlake, Texas:
-69.7%
Texas:
+109.1%
Median per capita income in Northlake in 2022:
Northlake:
$43,994
Texas:
$24,862
Income statistics for American Indian and Alaska Native residents
Median per capita income in Northlake in 2022:
Northlake:
$25,608
State:
$28,166
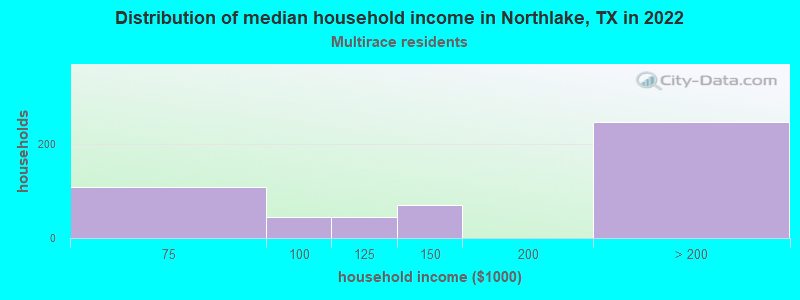
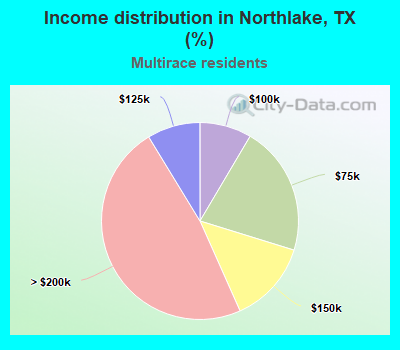
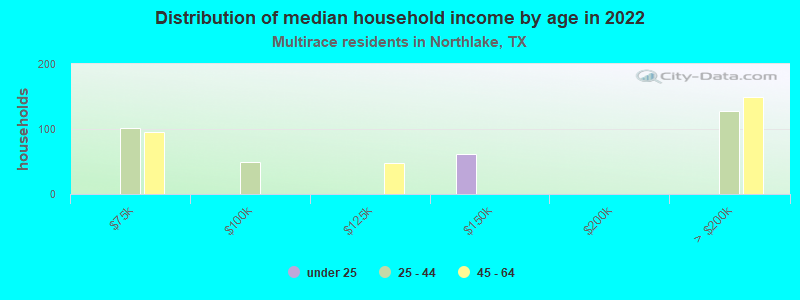
Income statistics for Multirace residents
Number of households with income < $10k:
Northlake:
0.0% (0)
Texas:
5.5% (122,324)
Number of households with income $10k - 20k:
Northlake:
0.0% (0)
Texas:
8.2% (182,232)
Number of households with income $20k - 30k:
Northlake:
0.0% (0)
State:
8.5% (189,456)
Number of households with income $30k - 40k:
Northlake:
0.0% (0)
Texas:
8.9% (197,499)
Number of households with income $40k - 50k:
Northlake:
0.0% (0)
Texas:
8.7% (191,735)
Number of households with income $50k - 60k:
Northlake:
0.0% (0)
State:
8.0% (177,535)
Number of households with income $60k - 75k:
Northlake:
21.3% (110)
State:
10.5% (232,479)
Number of households with income $75k - 100k:
Northlake:
8.5% (44)
State:
13.1% (290,448)
Number of households with income $100k - 125k:
Northlake:
8.7% (45)
State:
8.6% (191,595)
Number of households with income $125k - 150k:
Northlake:
13.5% (70)
State:
6.0% (133,361)
Number of households with income $150k - 200k:
Northlake:
0.0% (0)
Texas:
7.2% (159,195)
Number of households with income > $200k:
Northlake:
48.0% (248)
Texas:
6.7% (148,064)
Aggregate household income in Northlake in 2022: $98,407,347
Median per capita income in Northlake in 2022:
Northlake:
$61,229
State:
$26,785
Income statistics for other residents
Number of households with income < $10k:
Northlake:
0.0% (0)
State:
5.9% (54,162)
Number of households with income $10k - 20k:
Northlake:
0.0% (0)
State:
6.8% (62,891)
Number of households with income $20k - 30k:
Northlake:
0.0% (0)
State:
10.6% (97,294)
Number of households with income $30k - 40k:
Northlake:
0.0% (0)
State:
10.8% (99,670)
Number of households with income $40k - 50k:
Northlake:
0.0% (0)
State:
9.3% (85,548)
Number of households with income $50k - 60k:
Northlake:
0.0% (0)
State:
9.0% (82,757)
Number of households with income $60k - 75k:
Northlake:
0.0% (0)
State:
10.9% (100,326)
Number of households with income $75k - 100k:
Northlake:
0.0% (0)
State:
14.0% (128,767)
Number of households with income $100k - 125k:
Northlake:
0.0% (0)
State:
8.2% (75,218)
Number of households with income $125k - 150k:
Northlake:
0.0% (0)
State:
4.8% (44,223)
Number of households with income $150k - 200k:
Northlake:
100.0% (38)
Texas:
5.6% (51,376)
Number of households with income > $200k:
Northlake:
0.0% (0)
Texas:
4.0% (36,393)
Aggregate household income in Northlake in 2022: $4,729,084
Median per capita income in Northlake in 2022:
Northlake:
$16,433
State:
$23,899
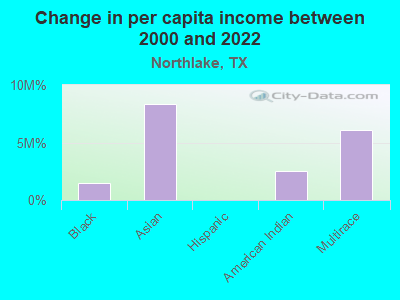
Change in median per capita income between 2000 and 2022:
Northlake, Texas:
+33.9%
Texas:
+135.2%
Discuss Northlake, Texas (TX) on our hugely popular Texas forum.