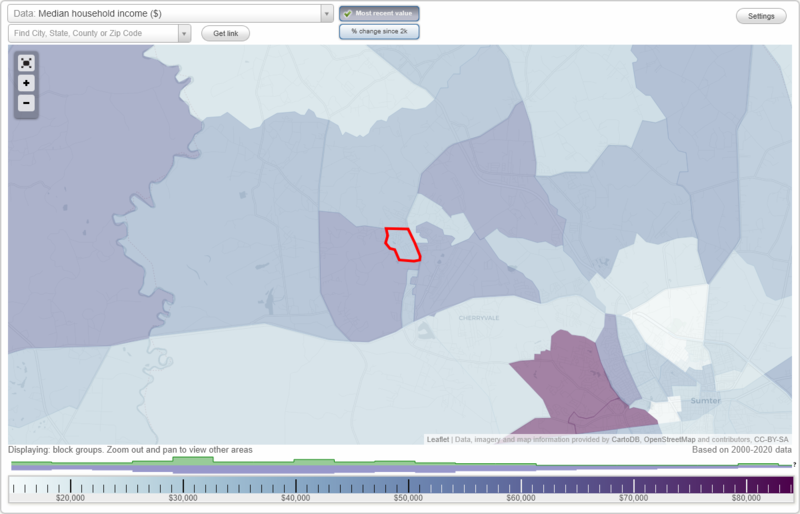
The median household income in Oakland, SC in 2022 was $58,988, which was 8.7% less than the median annual income of $64,115 across the entire state of South Carolina. Compared to the median income of $43,889 in 2000 this represents an increase of 25.6%. The per capita income in 2022 was $31,259, which means an increase of 32.0% compared to 2000 when it was $21,272.
Whole page based on the data from 2000 / 2022 when the population of Oakland, South Carolina was 1,272 / 947
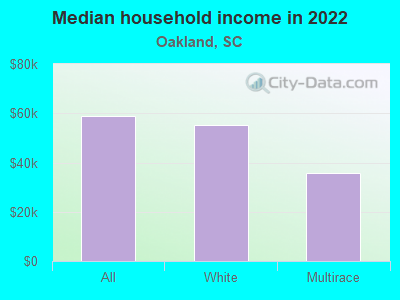
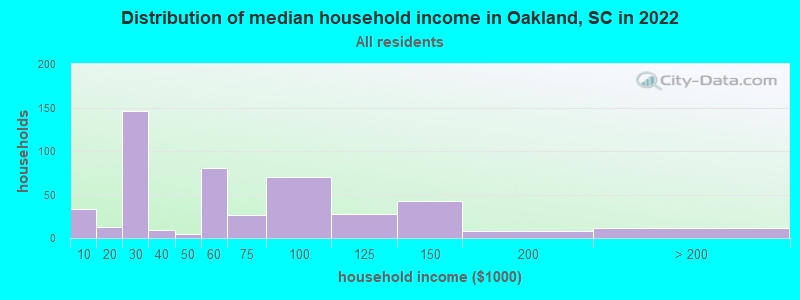
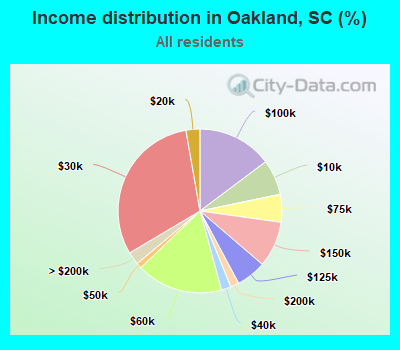
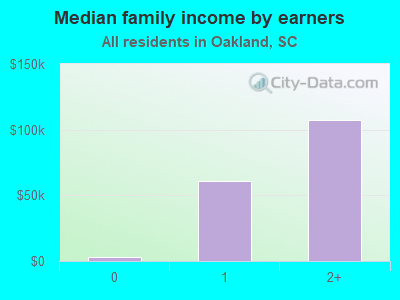
Income statistics for all residents
Median household income in Oakland, SC in 2022:
Oakland:
$58,989
South Carolina:
$64,115
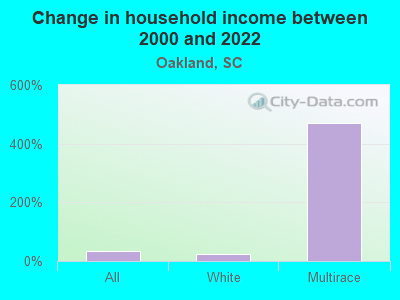
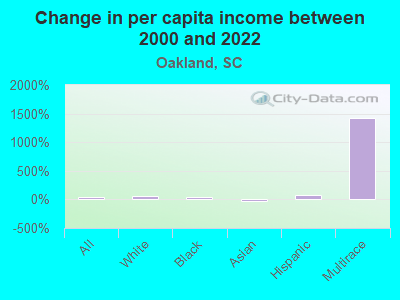
Change in median household income between 2000 and 2022:
Oakland, South Carolina:
+34.4%
South Carolina:
+72.9%
Number of households with income < $10k:
Oakland:
7.0% (33)
State:
6.1% (130,922)
Number of households with income $10k - 20k:
Oakland:
2.7% (13)
State:
7.9% (168,918)
Number of households with income $20k - 30k:
Oakland:
30.8% (146)
South Carolina:
8.0% (171,564)
Number of households with income $30k - 40k:
Oakland:
1.9% (9)
South Carolina:
9.2% (195,662)
Number of households with income $40k - 50k:
Oakland:
1.1% (5)
State:
8.2% (176,179)
Number of households with income $50k - 60k:
Oakland:
17.1% (81)
State:
7.5% (159,159)
Number of households with income $60k - 75k:
Oakland:
5.5% (26)
State:
9.9% (211,862)
Number of households with income $75k - 100k:
Oakland:
14.8% (70)
State:
13.5% (287,601)
Number of households with income $100k - 125k:
Oakland:
5.9% (28)
State:
9.3% (199,068)
Number of households with income $125k - 150k:
Oakland:
9.1% (43)
South Carolina:
6.2% (133,330)
Number of households with income $150k - 200k:
Oakland:
1.7% (8)
State:
6.6% (141,363)
Number of households with income > $200k:
Oakland:
2.5% (12)
South Carolina:
7.5% (160,452)
Aggregate household income in Oakland in 2022: $28,219,292
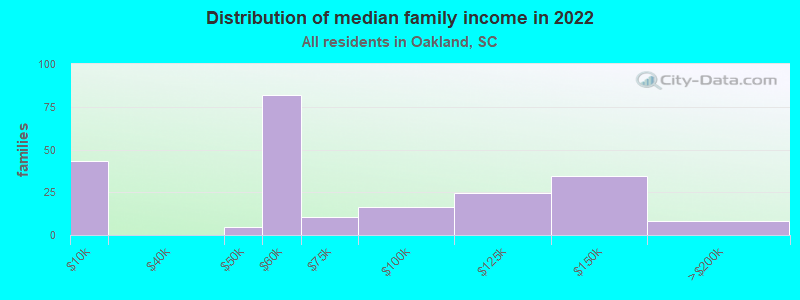
Median family income in Oakland in 2022:
Oakland:
$56,010
State:
$79,886
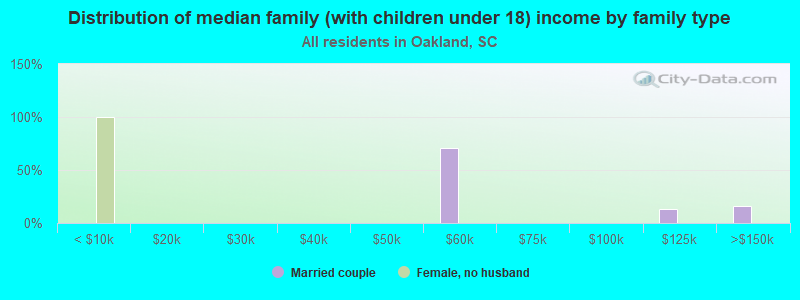
Number of families with income < $10k:
Oakland:
19.2% (43)
South Carolina:
3.7% (51,214)
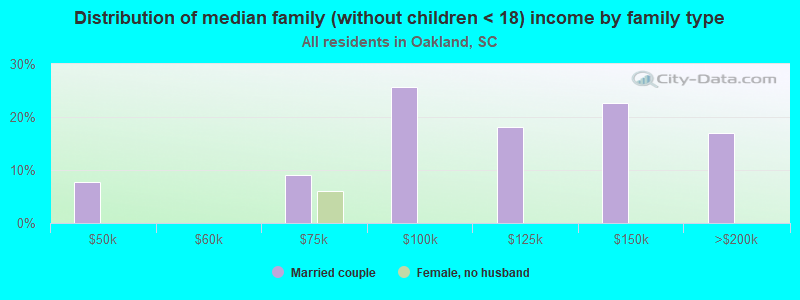
Number of families with income $40k - 50k:
Oakland:
2.2% (5)
South Carolina:
7.7% (107,666)
Number of families with income $50k - 60k:
Oakland:
36.6% (82)
South Carolina:
7.1% (98,803)
Number of families with income $60k - 75k:
Oakland:
4.7% (10)
South Carolina:
9.9% (138,412)
Number of families with income $75k - 100k:
Oakland:
7.4% (17)
State:
15.4% (214,716)
Number of families with income $100k - 125k:
Oakland:
10.9% (24)
State:
11.4% (159,999)
Number of families with income $125k - 150k:
Oakland:
15.5% (35)
South Carolina:
8.0% (112,152)
Number of families with income $150k - 200k:
Oakland:
3.6% (8)
South Carolina:
8.8% (123,525)
Median income for 3 person families:
Oakland:
$57,211
State:
$84,463
Median non-family income in Oakland in 2022:
Oakland:
$29,800
State:
$38,426
Change in median non-family income between 2000 and 2022:: -4.2%
Oakland, South Carolina:
-4.2%
State:
+78.7%
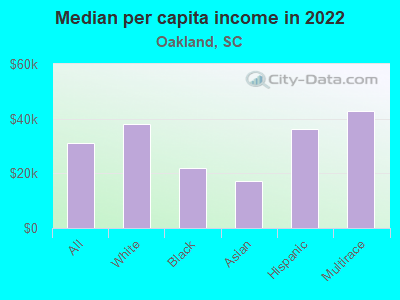
Median per capita income in Oakland in 2022:
Oakland:
$31,260
State:
$36,675
Change in median per capita income between 2000 and 2022:
Oakland, South Carolina:
+47.0%
State:
+95.1%
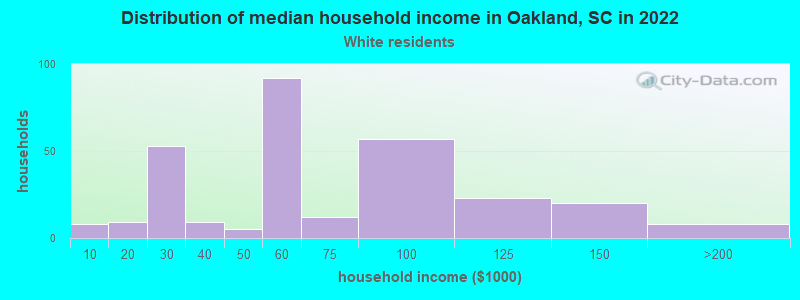
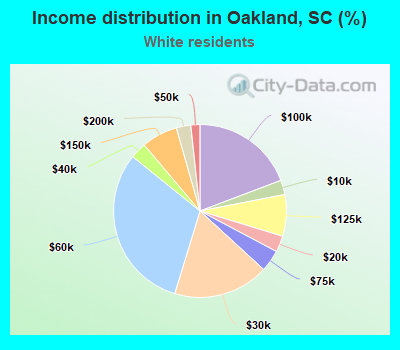
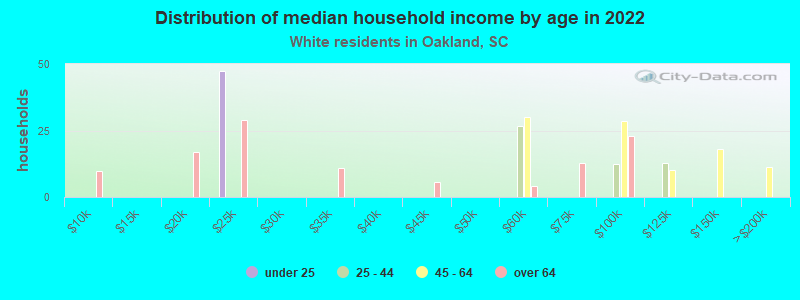
Income statistics for White residents
Median household income in Oakland, SC in 2022:
Oakland:
$55,076
State:
$73,516
Change in median household income between 2000 and 2022:
Oakland, South Carolina:
+22.5%
State:
+74.8%
Number of households with income < $10k:
Oakland:
2.7% (8)
State:
4.8% (68,379)
Number of households with income $10k - 20k:
Oakland:
3.0% (9)
State:
5.9% (85,105)
Number of households with income $20k - 30k:
Oakland:
17.9% (53)
State:
7.1% (101,178)
Number of households with income $30k - 40k:
Oakland:
3.0% (9)
South Carolina:
8.0% (114,877)
Number of households with income $40k - 50k:
Oakland:
1.7% (5)
State:
7.9% (112,749)
Number of households with income $50k - 60k:
Oakland:
31.1% (92)
South Carolina:
7.1% (101,835)
Number of households with income $60k - 75k:
Oakland:
4.1% (12)
State:
10.2% (145,879)
Number of households with income $75k - 100k:
Oakland:
19.3% (57)
State:
14.0% (200,068)
Number of households with income $100k - 125k:
Oakland:
7.8% (23)
State:
10.4% (148,542)
Number of households with income $125k - 150k:
Oakland:
6.8% (20)
South Carolina:
7.3% (105,118)
Number of households with income $150k - 200k:
Oakland:
2.7% (8)
South Carolina:
8.0% (114,506)
Number of households with income > $200k:
Oakland:
0.0% (0)
State:
9.3% (133,550)
Aggregate household income in Oakland in 2022: $17,826,964
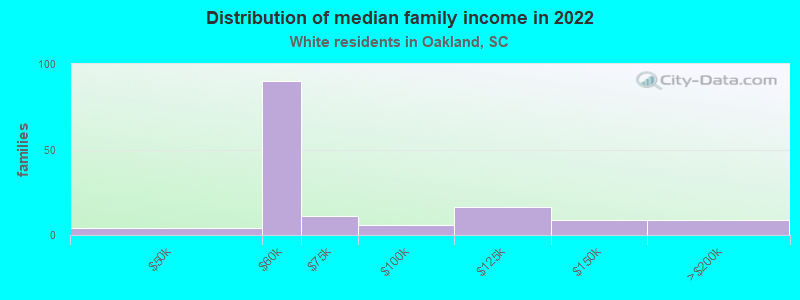
Median family income in Oakland in 2022:
Oakland:
$55,145
State:
$90,709
Number of families with income $40k - 50k:
Oakland:
2.9% (4)
South Carolina:
7.0% (66,712)
Number of families with income $50k - 60k:
Oakland:
62.1% (90)
State:
6.6% (62,489)
Number of families with income $60k - 75k:
Oakland:
7.7% (11)
State:
10.0% (94,724)
Number of families with income $75k - 100k:
Oakland:
4.0% (6)
State:
15.5% (147,207)
Number of families with income $100k - 125k:
Oakland:
11.2% (16)
South Carolina:
12.5% (118,160)
Number of families with income $125k - 150k:
Oakland:
6.2% (9)
South Carolina:
9.5% (90,395)
Number of families with income $150k - 200k:
Oakland:
6.0% (9)
State:
10.6% (100,043)
Median per capita income in Oakland in 2022:
Oakland:
$38,135
State:
$42,728
Change in median per capita income between 2000 and 2022:
Oakland, South Carolina:
+53.6%
State:
+93.4%
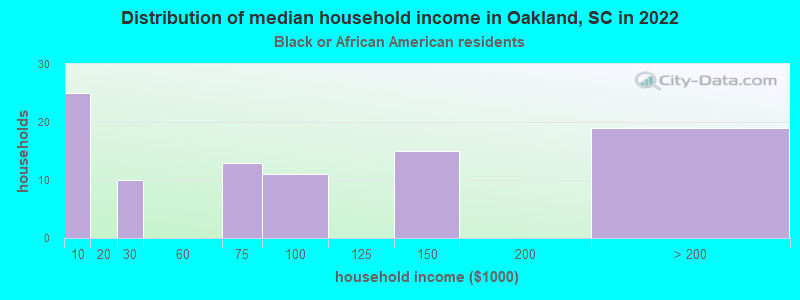
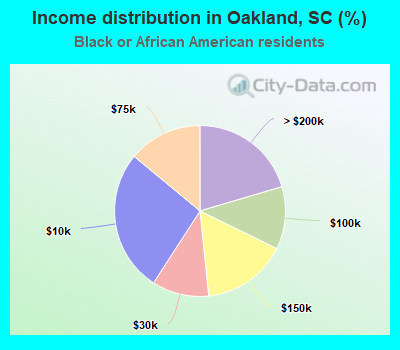
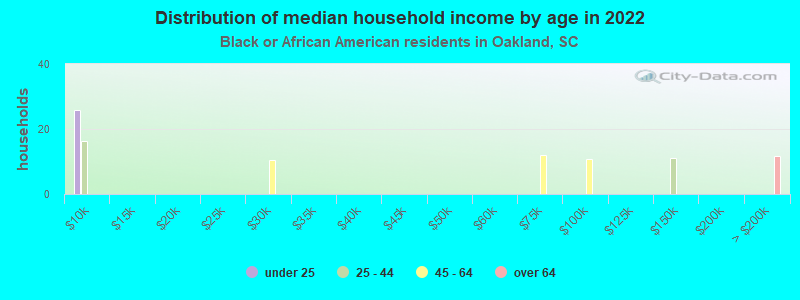
Income statistics for Black or African American residents
Number of households with income < $10k:
Oakland:
26.9% (25)
State:
10.0% (52,303)
Number of households with income $10k - 20k:
Oakland:
0.0% (0)
State:
13.4% (69,913)
Number of households with income $20k - 30k:
Oakland:
10.8% (10)
State:
10.4% (54,216)
Number of households with income $30k - 40k:
Oakland:
0.0% (0)
South Carolina:
12.0% (62,722)
Number of households with income $40k - 50k:
Oakland:
0.0% (0)
State:
9.2% (47,773)
Number of households with income $50k - 60k:
Oakland:
0.0% (0)
State:
8.3% (43,083)
Number of households with income $60k - 75k:
Oakland:
14.0% (13)
State:
9.3% (48,640)
Number of households with income $75k - 100k:
Oakland:
11.8% (11)
State:
12.2% (63,723)
Number of households with income $100k - 125k:
Oakland:
0.0% (0)
South Carolina:
6.4% (33,117)
Number of households with income $125k - 150k:
Oakland:
16.1% (15)
South Carolina:
3.2% (16,465)
Number of households with income $150k - 200k:
Oakland:
0.0% (0)
South Carolina:
3.2% (16,672)
Number of households with income > $200k:
Oakland:
20.4% (19)
State:
2.3% (12,213)
Aggregate household income in Oakland in 2022: $6,559,466
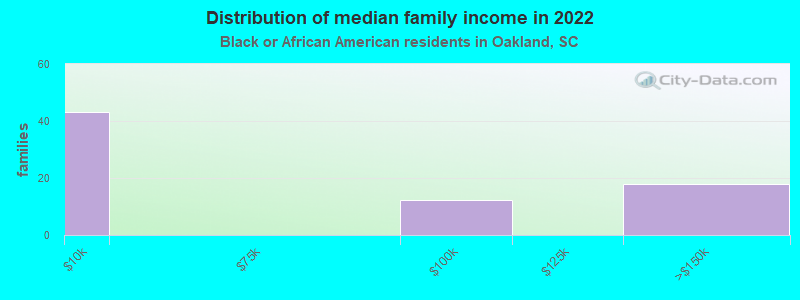
Median family income in Oakland in 2022:
Oakland:
$2,843
South Carolina:
$54,267
Number of families with income < $10k:
Oakland:
59.0% (43)
South Carolina:
7.3% (23,752)
Number of families with income $75k - 100k:
Oakland:
16.6% (12)
State:
15.2% (49,441)
Number of families with income $125k - 150k:
Oakland:
24.3% (18)
State:
3.9% (12,743)
Median per capita income in Oakland in 2022:
Oakland:
$21,816
State:
$24,863
Change in median per capita income between 2000 and 2022:
Oakland, South Carolina:
+45.6%
State:
+111.1%
Income statistics for Asian residents
Median per capita income in Oakland in 2022:
Oakland:
$17,156
South Carolina:
$48,909
Change in median per capita income between 2000 and 2022:: -26.0%
Oakland, South Carolina:
-26.0%
State:
+138.1%
Income statistics for Hispanic or Latino residents
Number of households with income < $10k:
Oakland:
0.0% (0)
South Carolina:
7.1% (7,036)
Number of households with income $10k - 20k:
Oakland:
0.0% (0)
State:
5.4% (5,379)
Number of households with income $20k - 30k:
Oakland:
0.0% (0)
South Carolina:
10.0% (9,993)
Number of households with income $30k - 40k:
Oakland:
0.0% (0)
South Carolina:
11.9% (11,872)
Number of households with income $40k - 50k:
Oakland:
0.0% (0)
South Carolina:
8.3% (8,239)
Number of households with income $50k - 60k:
Oakland:
100.0% (36)
State:
8.5% (8,475)
Number of households with income $60k - 75k:
Oakland:
0.0% (0)
State:
9.4% (9,330)
Number of households with income $75k - 100k:
Oakland:
0.0% (0)
State:
14.5% (14,491)
Number of households with income $100k - 125k:
Oakland:
0.0% (0)
State:
8.1% (8,026)
Number of households with income $125k - 150k:
Oakland:
0.0% (0)
State:
6.3% (6,313)
Number of households with income $150k - 200k:
Oakland:
0.0% (0)
State:
5.0% (4,963)
Number of households with income > $200k:
Oakland:
0.0% (0)
State:
5.6% (5,548)
Aggregate household income in Oakland in 2022: $3,903,499
Median per capita income in Oakland in 2022:
Oakland:
$36,262
State:
$23,692
Change in median per capita income between 2000 and 2022:
Oakland, South Carolina:
+81.8%
State:
+95.1%
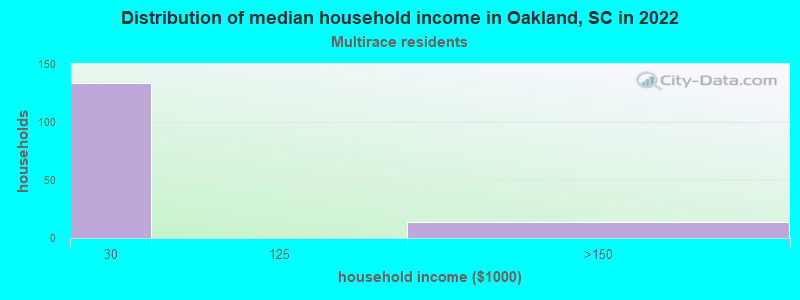
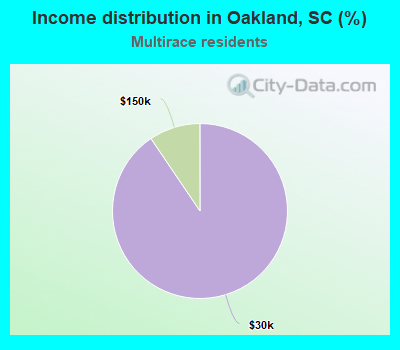
Income statistics for Multirace residents
Median household income in Oakland, SC in 2022:
Oakland:
$35,538
South Carolina:
$61,314
Number of households with income < $10k:
Oakland:
0.0% (0)
South Carolina:
6.9% (6,974)
Number of households with income $10k - 20k:
Oakland:
0.0% (0)
State:
8.0% (8,052)
Number of households with income $20k - 30k:
Oakland:
90.5% (134)
South Carolina:
9.9% (9,972)
Number of households with income $30k - 40k:
Oakland:
0.0% (0)
State:
10.0% (10,121)
Number of households with income $40k - 50k:
Oakland:
0.0% (0)
South Carolina:
8.1% (8,188)
Number of households with income $50k - 60k:
Oakland:
0.0% (0)
South Carolina:
6.5% (6,530)
Number of households with income $60k - 75k:
Oakland:
0.0% (0)
State:
8.9% (9,021)
Number of households with income $75k - 100k:
Oakland:
0.0% (0)
State:
13.4% (13,544)
Number of households with income $100k - 125k:
Oakland:
0.0% (0)
State:
9.8% (9,916)
Number of households with income $125k - 150k:
Oakland:
9.5% (14)
South Carolina:
6.6% (6,657)
Number of households with income $150k - 200k:
Oakland:
0.0% (0)
South Carolina:
5.9% (5,979)
Number of households with income > $200k:
Oakland:
0.0% (0)
State:
6.2% (6,266)
Aggregate household income in Oakland in 2022: $3,625,610
Median per capita income in Oakland in 2022:
Oakland:
$42,638
State:
$26,391
Discuss Oakland, South Carolina (SC) on our hugely popular South Carolina forum.