Old Shawneetown, Illinois (IL) income map, earnings map, and wages data
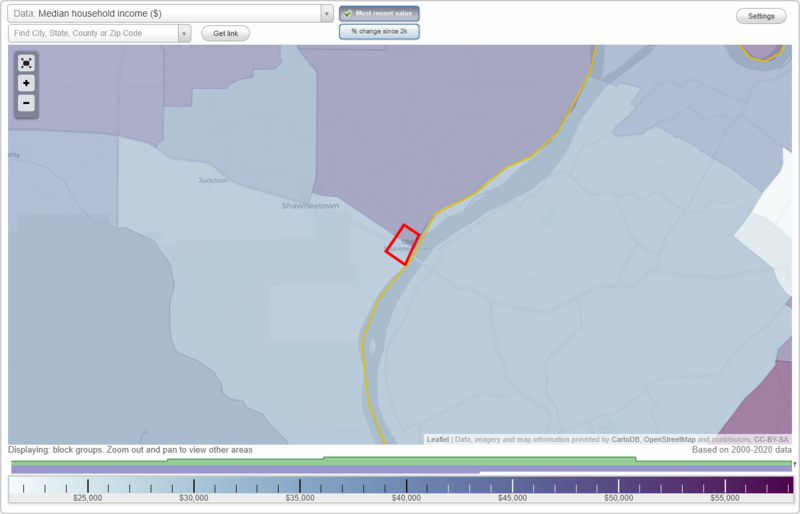
Data:
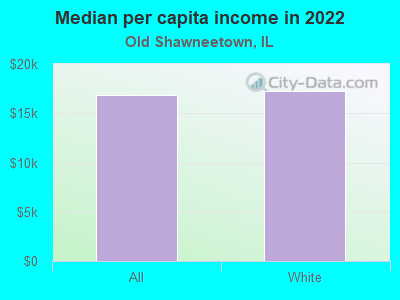
The per capita income in 2022 was $16,821, which means an increase of 44.2% compared to 2000 when it was $9,379.
Whole page based on the data from 2000 / 2022 when the population of Old Shawneetown, Illinois was 278 / 140
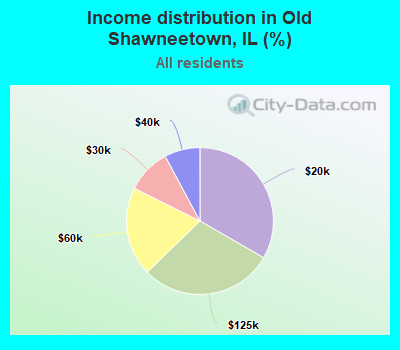
Income statistics for all residents
Number of households with income < $10k:| Old Shawneetown: | 0.0% (0) |
| State: | 5.9% (296,090) |
Number of households with income $10k - 20k:| Old Shawneetown: | 33.3% (17) |
| State: | 6.6% (333,259) |
Number of households with income $20k - 30k:| Old Shawneetown: | 9.8% (5) |
| Illinois: | 6.8% (342,921) |
Number of households with income $30k - 40k:| Old Shawneetown: | 7.8% (4) |
| State: | 7.0% (355,254) |
Number of households with income $40k - 50k:| Old Shawneetown: | 0.0% (0) |
| State: | 6.7% (340,678) |
Number of households with income $50k - 60k:| Old Shawneetown: | 19.6% (10) |
| Illinois: | 6.7% (339,405) |
Number of households with income $60k - 75k:| Old Shawneetown: | 0.0% (0) |
| State: | 9.2% (465,709) |
Number of households with income $75k - 100k:| Old Shawneetown: | 0.0% (0) |
| Illinois: | 12.9% (651,353) |
Number of households with income $100k - 125k:| Old Shawneetown: | 29.4% (15) |
| State: | 10.3% (522,359) |
Number of households with income $125k - 150k:| Old Shawneetown: | 0.0% (0) |
| Illinois: | 7.3% (367,136) |
Number of households with income $150k - 200k:| Old Shawneetown: | 0.0% (0) |
| State: | 9.0% (455,249) |
Number of households with income > $200k:| Old Shawneetown: | 0.0% (0) |
| State: | 11.6% (586,947) |
Aggregate household income in Old Shawneetown in 2022: $2,513,006
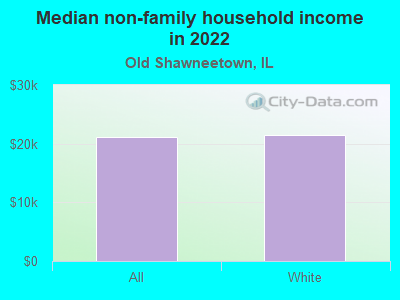
Median non-family income in Old Shawneetown in 2022:| Old Shawneetown: | $21,186 |
| Illinois: | $46,533 |
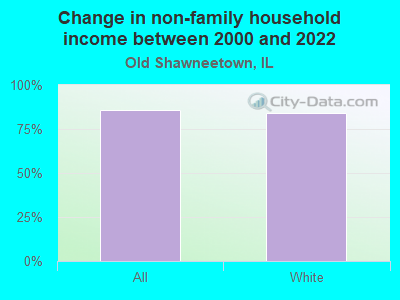
Change in median non-family income between 2000 and 2022:| Old Shawneetown, Illinois: | +85.7% |
| Illinois: | +64.0% |
Median per capita income in Old Shawneetown in 2022:| Old Shawneetown: | $16,821 |
| State: | $43,317 |
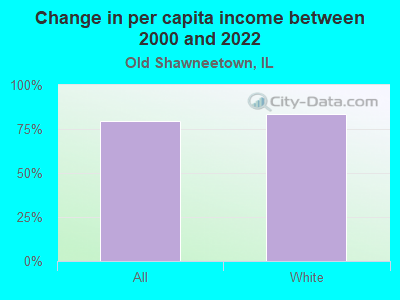
Change in median per capita income between 2000 and 2022:| Old Shawneetown, Illinois: | +79.3% |
| Illinois: | +87.5% |
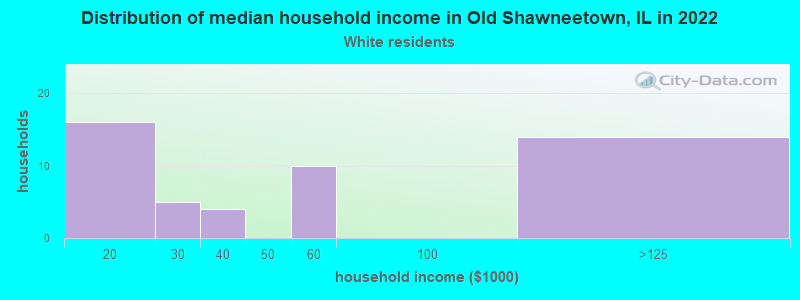
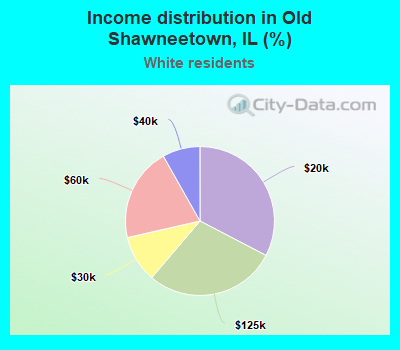
Income statistics for White residents
Number of households with income < $10k:| Old Shawneetown: | 0.0% (0) |
| Illinois: | 4.5% (149,895) |
Number of households with income $10k - 20k:| Old Shawneetown: | 32.7% (16) |
| State: | 5.5% (184,529) |
Number of households with income $20k - 30k:| Old Shawneetown: | 10.2% (5) |
| Illinois: | 6.1% (205,767) |
Number of households with income $30k - 40k:| Old Shawneetown: | 8.2% (4) |
| State: | 6.7% (225,572) |
Number of households with income $40k - 50k:| Old Shawneetown: | 0.0% (0) |
| State: | 6.5% (216,965) |
Number of households with income $50k - 60k:| Old Shawneetown: | 20.4% (10) |
| Illinois: | 6.6% (222,841) |
Number of households with income $60k - 75k:| Old Shawneetown: | 0.0% (0) |
| Illinois: | 9.3% (312,758) |
Number of households with income $75k - 100k:| Old Shawneetown: | 0.0% (0) |
| Illinois: | 12.9% (433,180) |
Number of households with income $100k - 125k:| Old Shawneetown: | 28.6% (14) |
| State: | 10.7% (360,753) |
Number of households with income $125k - 150k:| Old Shawneetown: | 0.0% (0) |
| State: | 7.9% (266,532) |
Number of households with income $150k - 200k:| Old Shawneetown: | 0.0% (0) |
| Illinois: | 10.0% (337,357) |
Number of households with income > $200k:| Old Shawneetown: | 0.0% (0) |
| Illinois: | 13.3% (446,069) |
Aggregate household income in Old Shawneetown in 2022: $2,391,905
Median non-family income in Old Shawneetown in 2022:| Old Shawneetown: | $21,541 |
| Illinois: | $50,934 |
Change in median non-family income between 2000 and 2022:| Old Shawneetown, Illinois: | +83.8% |
| State: | +70.7% |
Median per capita income in Old Shawneetown in 2022:| Old Shawneetown: | $17,274 |
| State: | $50,738 |
Change in median per capita income between 2000 and 2022:| Old Shawneetown, Illinois: | +83.7% |
| State: | +95.5% |